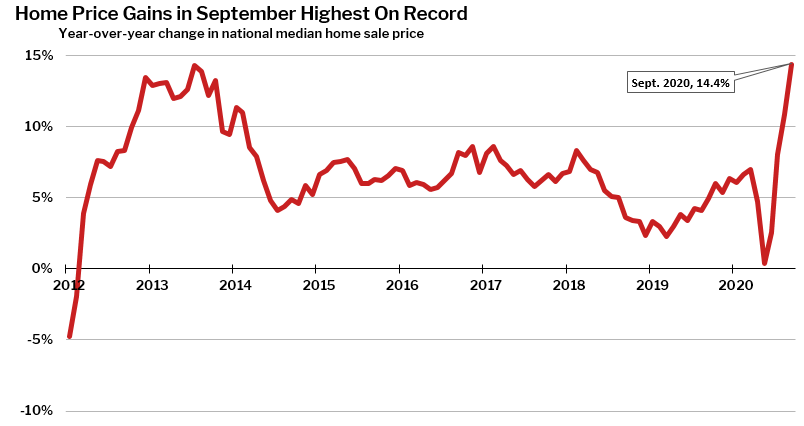
Home prices skyrocketed more than 14% year over year in September, the biggest increase on record. The real estate market also experienced historically high sales growth and the fastest pace Redfin has ever recorded.
The national median home price rose 14.4% year over year to $333,900 in September, the biggest annual increase of any month on record in Redfin’s data, which goes back to 2012. Prices continue to rise due to record-low mortgage rates (the average 30-year fixed rate was 2.89% in September and 2.94% in August), a historic shortage of housing supply and pandemic-driven demand for spacious homes.
“2020 will be known for a lot of things and a record-breaking year for real estate will certainly be one of its more unexpected legacies,” said Redfin chief economist Daryl Fairweather. “Demand typically abates in late summer and early fall, but seasonal patterns don’t stand a chance against the other factors motivating homebuyers this year. Homebuyers are seeking spacious homes in areas outside big cities to accommodate homeschooling and remote work. That plus low mortgage rates and record-low inventory are fueling historically high price growth and the fastest market in recent history.”
Median prices increased year over year in every single one of the 87 largest metro areas Redfin tracks. Bridgeport, CT (+33.1%) and Memphis, TN (+29.7%) had the biggest annual increases for the second month in a row, followed by Philadelphia (+23.6%). Honolulu saw the smallest increase, though prices were still up by a strong 5.3% year over year, followed by Milwaukee (+6.1%) and Baton Rouge (+6.2%).
| Market Summary | September 2020 | Month-Over-Month | Year-Over-Year |
| Median sale price | $333,900 | 1.7% | 14.4% |
| Homes sold, seasonally adjusted | 620,100 | 4.1% | 17.6% |
| Pending sales, seasonally adjusted | 601,600 | 7.3% | 32.9% |
| New listings, seasonally adjusted | 661,700 | 1.0% | 5.9% |
| All Homes for sale, seasonally adjusted | 1,655,900 | -2.1% | -22.8% |
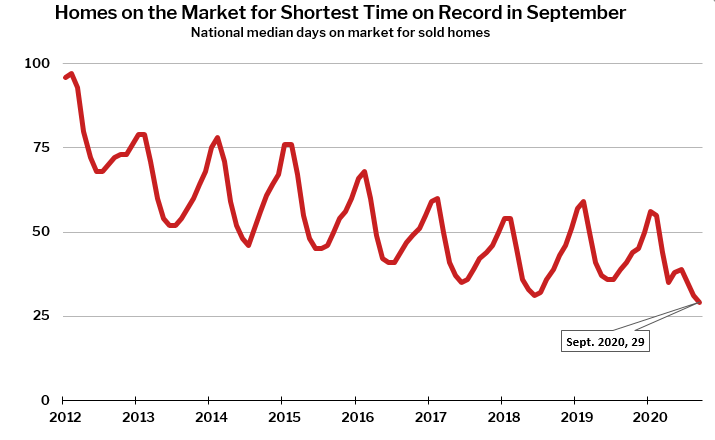
| Median days on market | 29 | -2 | -12 |
| Months of supply | 1.6 | -0.1 | -1.5 |
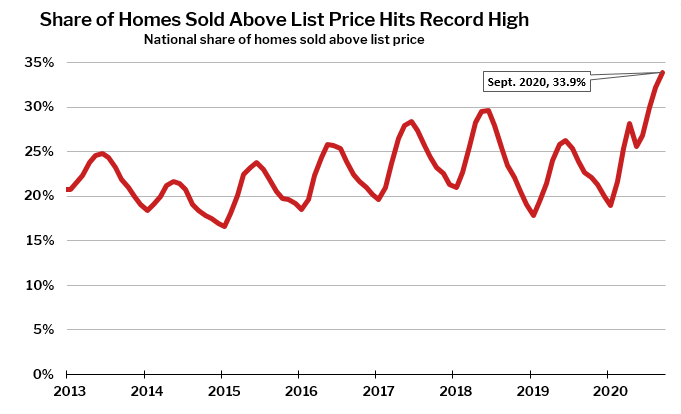
| Sold above list | 33.9% | 1.7 pts† | 11.3 pts† |
| Median Off-Market Redfin Estimate | $322,700 | 2.5% | 3.8% |
| Average Sale-to-list | 99.4% | 0.2 pts† | 1.2 pts† |
† – “pts” = percentage point change
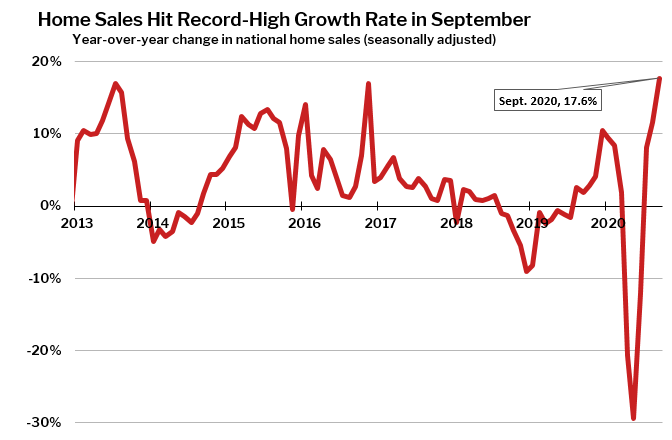
Home sales were up 17.6% in September from a year earlier on a seasonally adjusted basis, another metric that represents the biggest increase since Redfin started tracking housing market data.
Home sales increased in September from a year earlier in all but two of the largest metro areas—only Buffalo, NY (-6.7%) and Memphis (-1.8%) experienced annual drops. The largest increases were in Bridgeport, CT (+80.2%), San Francisco (+48.5%) and Lake County, IL (+47.3%).
Active listings—the count of all homes that were for sale at any time during the month—fell 22.8% year over year on a seasonally adjusted basis to their lowest level on record in September, the thirteenth straight month of declines. Intense demand from buyers is contributing to the continuing housing shortage, as is the fast pace of the market.
“It’s a great time to be a seller, but tough to be a buyer,” said San Diego Redfin agent Charles Wheeler. “People walk into a home and think ‘wow, this is amazing,’ but 100 other people are thinking the same thing. People are listing their homes and within three days they’re gone.”
“Low rates are the main motivator for buyers, and they’re also seeing that the pandemic isn’t really slowing down and they want to move into a bigger home with a big backyard,” Wheeler continued. “Because of the pandemic, people who have been lucky enough to keep their jobs are saving more money than usual because they’re not going on vacations or going out to eat. They’ve been able to save more toward a down payment and they have the means to buy a home to make their socially distant lifestyles more comfortable.”
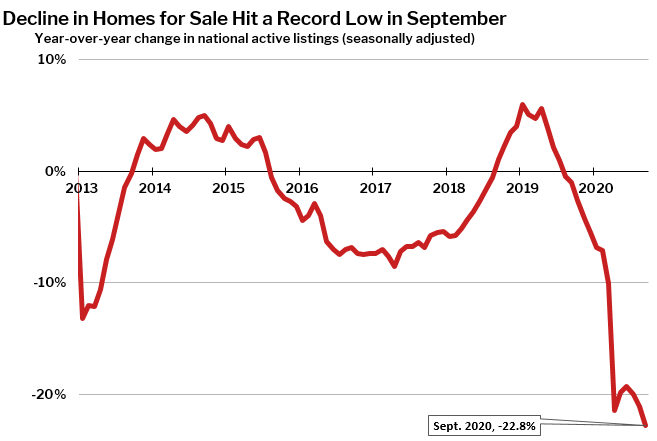
For the second month in a row, San Francisco (+51%) and New York City (+20%) were the only two of the largest 87 metros tracked by Redfin to post a year-over-year increase in the number of homes for sale. As companies continue to loosen their work-from-home policies, people are leaving expensive cities to work remotely from places with more affordable housing markets.
Movement out of places like San Francisco and New York City is having a measurable impact on smaller, more affordable markets around the country. In Western New York, Rochester and Buffalo were two of the most competitive markets of September, with about 60% of homes in each metro selling above list price. And Tacoma, smaller and more affordable than Seattle, its neighbor to the north, was the fastest market in the country for the third month in a row.
It’s also worth noting that even though listings were up significantly in San Francisco, home sales were also up by 48.5% year over year, outpacing national home-sale growth.
“If it feels like everyone you know is moving, you’re right,” said local Redfin real estate agent Tom Baumgartner. “The demands we put on our homes have changed because of the pandemic, with two adults and a couple kids working out of the living room. A lot of people selling their homes are staying in the area, but they’re trading up for larger spaces, often in the San Francisco suburbs.”
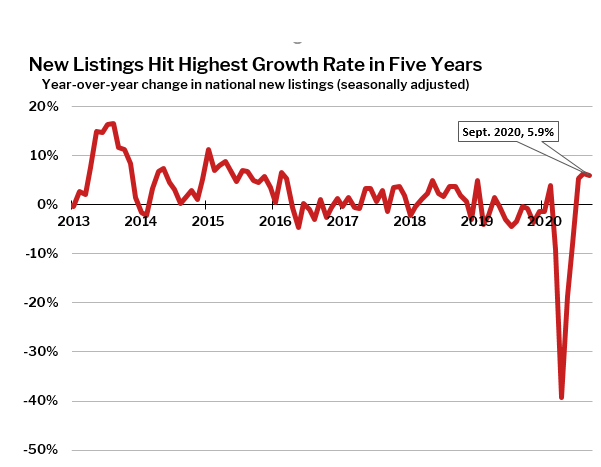
The number of new listings of homes for sale increased 5.9% in September from a year earlier on a seasonally adjusted basis, the third such increase in a row after four straight months of declines, starting with the onset of the pandemic in March. It’s the biggest increase in new listings since November 2015. The uptick contributed to an increase in pending sales, which were up 32.9% from a year ago on a seasonally adjusted basis.
The record-high price growth is partly due to the speed of the market and competition, which both bucked the typical seasonal slowdown this time of year to set their own records.
The typical home that sold in September went under contract in 29 days, the fastest pace on record, 12 days less than a year earlier and two days less than August. This is the first time since Redfin started tracking housing data when more than half of homes nationwide went under contract in less than a month.
In September, 33.9% of homes sold above list price—the highest level ever recorded by Redfin—and up from 22.6% a year earlier.
Other September Highlights
Competition
- For the third month in a row, Tacoma, WA was the fastest market, with half of all homes pending sale in just 6 days, down from 16 days a year earlier. Seattle, Indianapolis and Grand Rapids, MI were the next fastest markets, each with a median of 7 days on market.
- For the second month in a row, the most competitive markets were Oakland, CA, where 66.5% of homes sold above list price in September. Rochester, NY (+60.6%) and Tacoma, WA (+59.6%). Buffalo, NY (57.7%) and San Jose (57.6%) came next.
Prices
- Bridgeport, CT had the nation’s highest price growth, rising 33.1% since last year to $499,000. Memphis, TN had the second highest growth at 29.7% year-over-year price growth to $240,000, followed by Philadelphia (+23.6% to $247,250), Newark, NJ (+22% to 438,000) and Tulsa (+20.7% to $210,000).
- No metros saw price declines.
Sales
- Bridgeport, CT led the nation in year-over-year sales growth, up 80.2%, followed by San Francisco, up 48.5% and Lake County, IL (47.3%).
- Buffalo, NY (-6.7%) and Memphis (-1.8%) were the only two metros with declines in home sales from last year.
Inventory
- For the second month in a row, San Francisco had the biggest increase in the number of homes for sale, up 51% year over year, followed by New York (20%).
- Kansas City, MO (-52%), Allentown, PA (-50.2%) and Salt Lake City (-50%) had the biggest declines in the number of active listings.
Below are market-by-market breakdowns for prices, inventory, new listings and sales for markets with populations of 750,000 or more. For downloadable data on all of the markets Redfin tracks, visit the Redfin Data Center.
Median Sale Price
| Redfin Metro | Median Sale Price | Month-Over-Month | Year-Over-Year |
| Albany, NY | $250,000 | 4.2% | 13.6% |
| Allentown, PA | $240,000 | 0.0% | 16.2% |
| Anaheim, CA | $780,000 | -1.9% | 9.1% |
| Atlanta, GA | $280,600 | 0.2% | 12.2% |
| Austin, TX | $355,000 | 1.4% | 10.9% |
| Bakersfield, CA | $271,200 | -1.4% | 9.4% |
| Baltimore, MD | $320,000 | -1.5% | 7.4% |
| Baton Rouge, LA | $225,000 | 0.0% | 6.2% |
| Birmingham, AL | $245,000 | 3.4% | 18.9% |
| Boston, MA | $560,000 | -1.6% | 14.3% |
| Bridgeport, CT | $499,000 | -6.7% | 33.1% |
| Buffalo, NY | $189,900 | -0.1% | 15.8% |
| Camden, NJ | $235,000 | 0.0% | 19.0% |
| Charlotte, NC | $295,400 | -0.9% | 11.5% |
| Chicago, IL | $278,000 | -2.5% | 13.5% |
| Cincinnati, OH | $218,000 | -3.5% | 17.8% |
| Cleveland, OH | $175,000 | -2.2% | 12.2% |
| Columbus, OH | $248,000 | -0.8% | 14.3% |
| Dallas, TX | $322,900 | -0.5% | 11.7% |
| Dayton, OH | $170,500 | 3.3% | 11.4% |
| Denver, CO | $455,000 | 0.0% | 9.7% |
| Detroit, MI | $163,000 | 1.9% | 15.8% |
| El Paso, TX | $182,500 | -0.2% | 10.0% |
| Elgin, IL | $250,000 | -0.8% | 16.6% |
| Fort Lauderdale, FL | $312,000 | -2.5% | 17.7% |
| Fort Worth, TX | $268,000 | 0.9% | 9.4% |
| Frederick, MD | $440,000 | 0.1% | 11.7% |
| Fresno, CA | $320,000 | 1.6% | 11.7% |
| Grand Rapids, MI | $245,000 | 6.1% | 16.7% |
| Greensboro, NC | $200,000 | -3.6% | 18.3% |
| Greenville, SC | $236,500 | -2.7% | 9.0% |
| Hartford, CT | $254,900 | -2.0% | 14.9% |
| Honolulu, HI | $643,500 | 3.0% | 5.3% |
| Houston, TX | $264,000 | -1.1% | 7.8% |
| Indianapolis, IN | $224,700 | 0.3% | 18.3% |
| Jacksonville, FL | $260,000 | -1.1% | 7.9% |
| Kansas City, MO | $259,000 | 1.6% | 20.5% |
| Knoxville, TN | $245,100 | -1.8% | 12.7% |
| Lake County, IL | $275,000 | 3.5% | 19.6% |
| Las Vegas, NV | $317,000 | 2.3% | 8.6% |
| Los Angeles, CA | $730,000 | 2.8% | 14.1% |
| Louisville, KY | $230,000 | -1.2% | 16.2% |
| McAllen, TX | $181,500 | 2.3% | 15.6% |
| Memphis, TN | $240,000 | 3.2% | 29.7% |
| Miami, FL | $358,000 | 1.4% | 15.5% |
| Milwaukee, WI | $244,000 | -10.9% | 6.1% |
| Minneapolis, MN | $310,000 | -1.6% | 10.7% |
| Montgomery County, PA | $364,900 | -1.4% | 10.6% |
| Nashville, TN | $329,000 | -0.3% | 9.7% |
| Nassau County, NY | $525,000 | 1.9% | 10.5% |
| New Brunswick, NJ | $387,700 | 2.3% | 17.5% |
| New Haven, CT | $260,000 | 4.0% | 19.8% |
| New Orleans, LA | $246,100 | 0.4% | 12.9% |
| New York, NY | $550,000 | 0.0% | 6.8% |
| Newark, NJ | $438,000 | -1.6% | 22.0% |
| North Port, FL | $299,400 | -2.8% | 6.9% |
| Oakland, CA | $840,000 | 1.2% | 15.1% |
| Oklahoma City, OK | $207,000 | -3.7% | 11.9% |
| Omaha, NE | $227,500 | -5.2% | 10.7% |
| Orlando, FL | $281,000 | -1.8% | 8.1% |
| Oxnard, CA | $700,000 | 3.7% | 15.7% |
| Philadelphia, PA | $247,200 | 0.9% | 23.6% |
| Phoenix, AZ | $330,000 | 0.7% | 16.6% |
| Pittsburgh, PA | $202,200 | 0.6% | 16.9% |
| Portland, OR | $449,000 | 0.9% | 12.3% |
| Providence, RI | $339,100 | 1.2% | 14.9% |
| Raleigh, NC | $315,000 | -1.5% | 8.3% |
| Richmond, VA | $290,500 | 1.9% | 11.7% |
| Riverside, CA | $440,000 | 3.3% | 14.3% |
| Rochester, NY | $176,000 | 0.3% | 14.7% |
| Sacramento, CA | $475,000 | 1.7% | 13.8% |
| Salt Lake City, UT | $382,900 | 1.0% | 11.0% |
| San Antonio, TX | $262,000 | 1.9% | 13.6% |
| San Diego, CA | $665,000 | 1.8% | 15.7% |
| San Francisco, CA | $1,450,000 | -3.3% | 6.6% |
| San Jose, CA | $1,200,000 | -2.0% | 12.7% |
| Seattle, WA | $640,000 | 1.6% | 18.5% |
| St. Louis, MO | $215,000 | -1.5% | 16.3% |
| Tacoma, WA | $435,000 | 1.2% | 14.5% |
| Tampa, FL | $270,000 | 1.3% | 14.9% |
| Tucson, AZ | $261,500 | 2.5% | 14.7% |
| Tulsa, OK | $210,000 | 1.9% | 20.7% |
| Virginia Beach, VA | $270,000 | 0.9% | 12.5% |
| Warren, MI | $249,800 | 0.9% | 13.0% |
| Washington, D.C. | $457,100 | -1.6% | 14.3% |
| West Palm Beach, FL | $320,000 | -1.5% | 10.3% |
| Worcester, MA | $330,000 | 3.2% | 17.9% |
| National | $333,900 | 1.7% | 14.4% |
Homes Sold
| Redfin Metro | Homes Sold | Month-Over-Month | Year-Over-Year |
| Albany, NY | 1,082 | 0.1% | 26.5% |
| Allentown, PA | 1,112 | -3.5% | 22.5% |
| Anaheim, CA | 3,352 | 5.5% | 29.8% |
| Atlanta, GA | 10,459 | -5.4% | 19.2% |
| Austin, TX | 3,362 | 0.1% | 19.4% |
| Bakersfield, CA | 895 | 10.4% | 9.4% |
| Baltimore, MD | 4,369 | -4.0% | 23.8% |
| Baton Rouge, LA | 1,157 | 5.2% | 36.4% |
| Birmingham, AL | 1,591 | -3.4% | 10.2% |
| Boston, MA | 5,102 | -6.6% | 23.3% |
| Bridgeport, CT | 1,811 | -3.5% | 80.2% |
| Buffalo, NY | 1,095 | -1.8% | -6.7% |
| Camden, NJ | 1,952 | -8.8% | 10.3% |
| Charlotte, NC | 4,661 | -1.6% | 13.9% |
| Chicago, IL | 10,311 | -7.8% | 33.9% |
| Cincinnati, OH | 3,162 | -5.7% | 17.9% |
| Cleveland, OH | 2,934 | -5.7% | 13.5% |
| Columbus, OH | 3,177 | -1.1% | 14.4% |
| Dallas, TX | 6,744 | -7.9% | 21.2% |
| Dayton, OH | 1,214 | -4.9% | 19.3% |
| Denver, CO | 6,078 | -2.0% | 26.7% |
| Detroit, MI | 2,004 | -9.7% | 8.1% |
| El Paso, TX | 940 | -0.4% | 40.3% |
| Elgin, IL | 1,359 | -3.3% | 46.1% |
| Fort Lauderdale, FL | 2,949 | -8.5% | 4.7% |
| Fort Worth, TX | 3,350 | -4.9% | 18.6% |
| Frederick, MD | 1,833 | -0.4% | 31.9% |
| Fresno, CA | 784 | -11.3% | 2.2% |
| Grand Rapids, MI | 1,645 | 1.4% | 18.5% |
| Greensboro, NC | 973 | 0.1% | 13.9% |
| Greenville, SC | 1,379 | 2.8% | 20.6% |
| Hartford, CT | 1,815 | -6.8% | 33.1% |
| Honolulu, HI | 825 | 5.6% | 2.7% |
| Houston, TX | 9,179 | -1.5% | 25.1% |
| Indianapolis, IN | 3,612 | -3.3% | 19.4% |
| Jacksonville, FL | 2,755 | -1.1% | 17.4% |
| Kansas City, MO | 3,727 | 0.5% | 23.9% |
| Knoxville, TN | 1,402 | 2.0% | 12.7% |
| Lake County, IL | 1,570 | -3.8% | 47.3% |
| Las Vegas, NV | 3,926 | 11.4% | 14.0% |
| Los Angeles, CA | 6,731 | 7.0% | 16.7% |
| Louisville, KY | 1,423 | -15.2% | 2.2% |
| McAllen, TX | 345 | -7.5% | 18.2% |
| Memphis, TN | 1,103 | -8.5% | -1.8% |
| Miami, FL | 2,593 | -6.4% | 4.7% |
| Milwaukee, WI | 2,278 | -4.5% | 24.6% |
| Minneapolis, MN | 6,714 | -2.7% | 21.4% |
| Montgomery County, PA | 2,853 | -12.6% | 25.9% |
| Nashville, TN | 4,111 | -3.5% | 14.9% |
| Nassau County, NY | 3,021 | 25.9% | 12.2% |
| New Brunswick, NJ | 4,197 | 0.2% | 35.1% |
| New Haven, CT | 1,274 | 2.8% | 41.2% |
| New Orleans, LA | 1,533 | -2.4% | 24.5% |
| New York, NY | 4,874 | 3.8% | 2.4% |
| Newark, NJ | 2,877 | -4.3% | 40.2% |
| North Port, FL | 2,337 | -0.1% | 33.9% |
| Oakland, CA | 2,815 | 1.4% | 30.4% |
| Oklahoma City, OK | 2,344 | -5.7% | 25.8% |
| Omaha, NE | 1,357 | -3.9% | 17.8% |
| Orlando, FL | 4,214 | -2.4% | 9.9% |
| Oxnard, CA | 936 | 0.4% | 27.3% |
| Philadelphia, PA | 2,580 | -1.0% | 23.8% |
| Phoenix, AZ | 9,129 | 5.0% | 17.1% |
| Pittsburgh, PA | 2,778 | -8.3% | 27.1% |
| Portland, OR | 4,199 | 2.5% | 31.0% |
| Providence, RI | 2,145 | 4.6% | 19.8% |
| Raleigh, NC | 2,605 | -4.2% | 24.6% |
| Richmond, VA | 1,812 | -7.7% | 16.1% |
| Riverside, CA | 5,806 | 1.2% | 24.2% |
| Rochester, NY | 1,193 | -2.7% | 0.6% |
| Sacramento, CA | 3,488 | 2.3% | 32.3% |
| Salt Lake City, UT | 1,850 | -2.4% | 14.4% |
| San Antonio, TX | 3,249 | -7.3% | 19.1% |
| San Diego, CA | 3,826 | 4.4% | 26.9% |
| San Francisco, CA | 1,130 | 14.0% | 48.5% |
| San Jose, CA | 1,496 | 9.2% | 35.4% |
| Seattle, WA | 5,250 | 5.6% | 38.7% |
| St. Louis, MO | 4,278 | -3.4% | 26.0% |
| Tacoma, WA | 1,606 | 1.1% | 18.2% |
| Tampa, FL | 5,870 | -5.7% | 13.7% |
| Tucson, AZ | 1,587 | 3.6% | 11.1% |
| Tulsa, OK | 1,499 | -0.4% | 19.3% |
| Virginia Beach, VA | 2,771 | -5.8% | 31.8% |
| Warren, MI | 4,458 | -2.8% | 23.9% |
| Washington, D.C. | 7,477 | -2.3% | 29.1% |
| West Palm Beach, FL | 3,041 | -5.4% | 19.9% |
| Worcester, MA | 1,173 | -11.0% | 6.9% |
| National | 620,100 | 4.1% | 17.6% |
New Listings
| Redfin Metro | New Listings | Month-Over-Month | Year-Over-Year |
| Albany, NY | 1,330 | -2.2% | 15.1% |
| Allentown, PA | 668 | -15.7% | -34.5% |
| Anaheim, CA | 3,506 | 0.5% | 33.4% |
| Atlanta, GA | 10,293 | -5.7% | 0.2% |
| Austin, TX | 3,280 | -9.4% | 5.2% |
| Bakersfield, CA | 1,026 | -2.9% | 21.0% |
| Baltimore, MD | 4,858 | 4.0% | 13.2% |
| Baton Rouge, LA | 610 | -24.5% | -37.8% |
| Birmingham, AL | 1,550 | 2.4% | 0.8% |
| Boston, MA | 6,786 | 20.0% | 5.3% |
| Bridgeport, CT | 1,911 | 6.6% | 23.6% |
| Buffalo, NY | 1,426 | -12.6% | 2.7% |
| Camden, NJ | 2,176 | -2.2% | 11.6% |
| Charlotte, NC | 3,530 | -14.3% | -15.9% |
| Chicago, IL | 12,194 | -6.2% | 18.8% |
| Cincinnati, OH | 3,300 | -5.9% | 7.1% |
| Cleveland, OH | 3,304 | -0.2% | 13.4% |
| Columbus, OH | 3,209 | -3.1% | 7.5% |
| Dallas, TX | 6,632 | -9.1% | -0.6% |
| Dayton, OH | 1,320 | -2.3% | 12.3% |
| Denver, CO | 5,751 | -6.2% | 9.8% |
| Detroit, MI | 2,402 | -5.3% | -1.1% |
| El Paso, TX | 956 | -22.0% | 2.1% |
| Elgin, IL | 1,232 | -7.3% | 19.8% |
| Fort Lauderdale, FL | 3,548 | 0.0% | 2.4% |
| Fort Worth, TX | 3,240 | -11.3% | 1.6% |
| Frederick, MD | 1,984 | 2.3% | 7.6% |
| Fresno, CA | 921 | -3.8% | 1.0% |
| Grand Rapids, MI | 1,568 | -6.4% | -6.8% |
| Greensboro, NC | 715 | 0.8% | -29.2% |
| Greenville, SC | 1,260 | -5.2% | 3.6% |
| Hartford, CT | 2,082 | 4.6% | 25.6% |
| Honolulu, HI | 708 | -17.9% | -24.8% |
| Houston, TX | 9,506 | -5.5% | 14.9% |
| Indianapolis, IN | 3,559 | 5.0% | 12.3% |
| Jacksonville, FL | 2,567 | -7.1% | 6.8% |
| Kansas City, MO | 1,795 | -37.3% | -47.5% |
| Knoxville, TN | 1,184 | -5.2% | -7.6% |
| Lake County, IL | 1,447 | -10.3% | 22.4% |
| Las Vegas, NV | 4,577 | -1.1% | 17.4% |
| Los Angeles, CA | 8,441 | 2.3% | 17.8% |
| Louisville, KY | 1,599 | 0.7% | -1.1% |
| McAllen, TX | 446 | 9.6% | 2.8% |
| Memphis, TN | 1,135 | -13.9% | -9.8% |
| Miami, FL | 3,778 | 0.5% | -0.1% |
| Milwaukee, WI | 2,327 | -9.7% | 12.1% |
| Minneapolis, MN | 7,211 | -1.2% | 18.6% |
| Montgomery County, PA | 2,885 | 0.6% | 8.4% |
| Nashville, TN | 4,096 | -7.0% | 0.3% |
| Nassau County, NY | 4,165 | 0.4% | 21.1% |
| New Brunswick, NJ | 4,865 | 0.0% | 27.9% |
| New Haven, CT | 1,503 | 2.8% | 41.0% |
| New Orleans, LA | 1,446 | -7.8% | -5.4% |
| New York, NY | 11,039 | 5.6% | 41.2% |
| Newark, NJ | 3,381 | 4.6% | 15.9% |
| North Port, FL | 2,356 | -2.5% | 15.7% |
| Oakland, CA | 3,179 | 9.0% | 11.5% |
| Oklahoma City, OK | 2,228 | -6.6% | 12.8% |
| Omaha, NE | 1,322 | 1.2% | 1.8% |
| Orlando, FL | 4,644 | -1.8% | 9.3% |
| Oxnard, CA | 1,223 | 32.1% | 66.8% |
| Philadelphia, PA | 3,332 | 0.9% | 11.7% |
| Phoenix, AZ | 9,544 | -2.7% | 12.6% |
| Pittsburgh, PA | 2,805 | -7.1% | 9.5% |
| Portland, OR | 3,717 | -14.8% | 6.2% |
| Providence, RI | 2,582 | 4.2% | 10.3% |
| Raleigh, NC | 2,556 | -6.6% | 7.0% |
| Richmond, VA | 1,969 | 2.5% | 6.0% |
| Riverside, CA | 6,206 | 0.2% | 14.0% |
| Rochester, NY | 1,366 | -7.7% | 4.8% |
| Sacramento, CA | 3,475 | -1.9% | 17.6% |
| Salt Lake City, UT | 820 | -49.7% | -53.0% |
| San Antonio, TX | 3,259 | -6.1% | 0.7% |
| San Diego, CA | 3,658 | -9.5% | 16.2% |
| San Francisco, CA | 1,907 | 15.4% | 8.0% |
| San Jose, CA | 1,765 | 6.9% | 27.7% |
| Seattle, WA | 5,647 | -5.2% | 27.6% |
| St. Louis, MO | 2,785 | -20.6% | -30.3% |
| Tacoma, WA | 1,518 | -12.6% | 15.3% |
| Tampa, FL | 5,880 | -3.3% | 3.1% |
| Tucson, AZ | 1,812 | 3.5% | 15.9% |
| Tulsa, OK | 1,532 | -2.0% | 25.5% |
| Virginia Beach, VA | 2,770 | -0.8% | 23.3% |
| Warren, MI | 4,417 | -11.4% | 3.2% |
| Washington, D.C. | 8,406 | 5.8% | 19.8% |
| West Palm Beach, FL | 3,706 | 2.1% | 17.0% |
| Worcester, MA | 1,455 | 4.9% | 0.9% |
| National | 661,700 | 1.0% | 5.9% |
All Homes for Sale
| Redfin Metro | All Homes for Sale | Month-Over-Month | Year-Over-Year |
| Albany, NY | 3,274 | -3.1% | -27.4% |
| Allentown, PA | 1,702 | -16.1% | -50.2% |
| Anaheim, CA | 9,833 | -4.3% | -15.1% |
| Atlanta, GA | 27,727 | -9.1% | -26.9% |
| Austin, TX | 8,756 | -1.6% | -17.9% |
| Bakersfield, CA | 2,341 | -3.0% | -18.9% |
| Baltimore, MD | 11,267 | -2.0% | -27.0% |
| Baton Rouge, LA | 2,732 | -15.7% | -44.7% |
| Birmingham, AL | 4,996 | -3.1% | -21.9% |
| Boston, MA | 14,708 | 3.8% | -10.2% |
| Bridgeport, CT | 7,065 | -4.7% | -7.4% |
| Buffalo, NY | 2,865 | -6.2% | -25.2% |
| Camden, NJ | 5,284 | -3.0% | -33.9% |
| Charlotte, NC | 11,872 | -8.2% | -27.8% |
| Chicago, IL | 35,583 | -2.0% | -17.8% |
| Cincinnati, OH | 9,576 | -3.1% | -14.9% |
| Cleveland, OH | 8,408 | -2.3% | -27.9% |
| Columbus, OH | 8,526 | -2.4% | -13.7% |
| Dallas, TX | 19,239 | -10.9% | -27.8% |
| Dayton, OH | 3,097 | -2.6% | -16.0% |
| Denver, CO | 11,193 | -10.3% | -22.8% |
| Detroit, MI | 6,155 | -5.7% | -26.8% |
| El Paso, TX | 2,942 | -8.6% | -20.6% |
| Elgin, IL | 2,940 | -10.5% | -34.8% |
| Fort Lauderdale, FL | 15,251 | -3.0% | -7.6% |
| Fort Worth, TX | 8,878 | -9.9% | -21.6% |
| Frederick, MD | 4,441 | -1.4% | -18.7% |
| Fresno, CA | 1,768 | -3.2% | -35.0% |
| Grand Rapids, MI | 3,131 | -10.0% | -30.3% |
| Greensboro, NC | 2,181 | -11.9% | -38.1% |
| Greenville, SC | 4,616 | -6.3% | -18.0% |
| Hartford, CT | 6,157 | -3.3% | -19.7% |
| Honolulu, HI | 3,626 | -7.0% | -23.8% |
| Houston, TX | 29,731 | -6.7% | -20.5% |
| Indianapolis, IN | 7,015 | 0.6% | -25.2% |
| Jacksonville, FL | 7,705 | -8.5% | -22.3% |
| Kansas City, MO | 5,049 | -26.2% | -52.0% |
| Knoxville, TN | 4,198 | -4.5% | -18.6% |
| Lake County, IL | 4,398 | -8.6% | -29.9% |
| Las Vegas, NV | 13,500 | 0.0% | -14.5% |
| Los Angeles, CA | 24,131 | 0.6% | -8.0% |
| Louisville, KY | 3,688 | -2.1% | -26.8% |
| McAllen, TX | 1,511 | -3.9% | -35.6% |
| Memphis, TN | 3,037 | -6.8% | -28.7% |
| Miami, FL | 18,899 | -2.6% | -9.3% |
| Milwaukee, WI | 7,238 | -2.8% | -3.6% |
| Minneapolis, MN | 15,679 | -3.2% | -12.6% |
| Montgomery County, PA | 7,175 | -4.6% | -19.8% |
| Nashville, TN | 12,102 | -6.2% | -20.3% |
| Nassau County, NY | 12,606 | -2.0% | -16.3% |
| New Brunswick, NJ | 13,151 | -1.0% | -22.0% |
| New Haven, CT | 4,616 | -1.8% | -11.2% |
| New Orleans, LA | 4,496 | -8.6% | -26.3% |
| New York, NY | 46,185 | 5.4% | 20.0% |
| Newark, NJ | 10,172 | 1.9% | -13.9% |
| North Port, FL | 6,857 | -5.6% | -14.9% |
| Oakland, CA | 5,882 | -0.4% | -12.1% |
| Oklahoma City, OK | 5,522 | -7.3% | -22.5% |
| Omaha, NE | 2,502 | -5.8% | -26.0% |
| Orlando, FL | 12,662 | -4.2% | -9.9% |
| Oxnard, CA | 2,934 | 5.8% | -6.4% |
| Philadelphia, PA | 9,698 | 0.8% | -1.5% |
| Phoenix, AZ | 22,270 | -0.9% | -10.5% |
| Pittsburgh, PA | 10,648 | -5.0% | -8.0% |
| Portland, OR | 8,400 | -10.0% | -25.8% |
| Providence, RI | 6,229 | 0.5% | -23.1% |
| Raleigh, NC | 7,592 | -7.6% | -18.4% |
| Richmond, VA | 3,861 | -5.0% | -28.0% |
| Riverside, CA | 15,549 | -4.6% | -29.6% |
| Rochester, NY | 2,646 | -7.6% | -24.3% |
| Sacramento, CA | 6,775 | -5.6% | -27.0% |
| Salt Lake City, UT | 2,478 | -30.1% | -50.0% |
| San Antonio, TX | 9,419 | -9.4% | -28.2% |
| San Diego, CA | 8,155 | -6.9% | -21.9% |
| San Francisco, CA | 4,816 | 11.6% | 51.0% |
| San Jose, CA | 3,915 | 3.8% | -1.4% |
| Seattle, WA | 10,762 | -2.5% | -9.5% |
| St. Louis, MO | 8,693 | -16.4% | -36.4% |
| Tacoma, WA | 2,718 | -12.4% | -23.3% |
| Tampa, FL | 13,625 | -6.6% | -27.2% |
| Tucson, AZ | 4,924 | 2.3% | -9.7% |
| Tulsa, OK | 3,589 | -5.7% | -22.0% |
| Virginia Beach, VA | 6,505 | -7.3% | -29.1% |
| Warren, MI | 10,777 | -7.8% | -24.1% |
| Washington, D.C. | 18,614 | -0.6% | -10.3% |
| West Palm Beach, FL | 15,422 | -2.1% | 0.1% |
| Worcester, MA | 3,066 | -0.7% | -28.7% |
| National | 1,655,900 | -2.1% | -22.8% |
 United States
 Canada