- New listings inched up as some homeowners opted to cash out, fearing that elevated mortgage rates could drive a drop in home prices.
- Pending sales also saw a slight bump as the uptick in listings brought some house hunters off the sidelines.
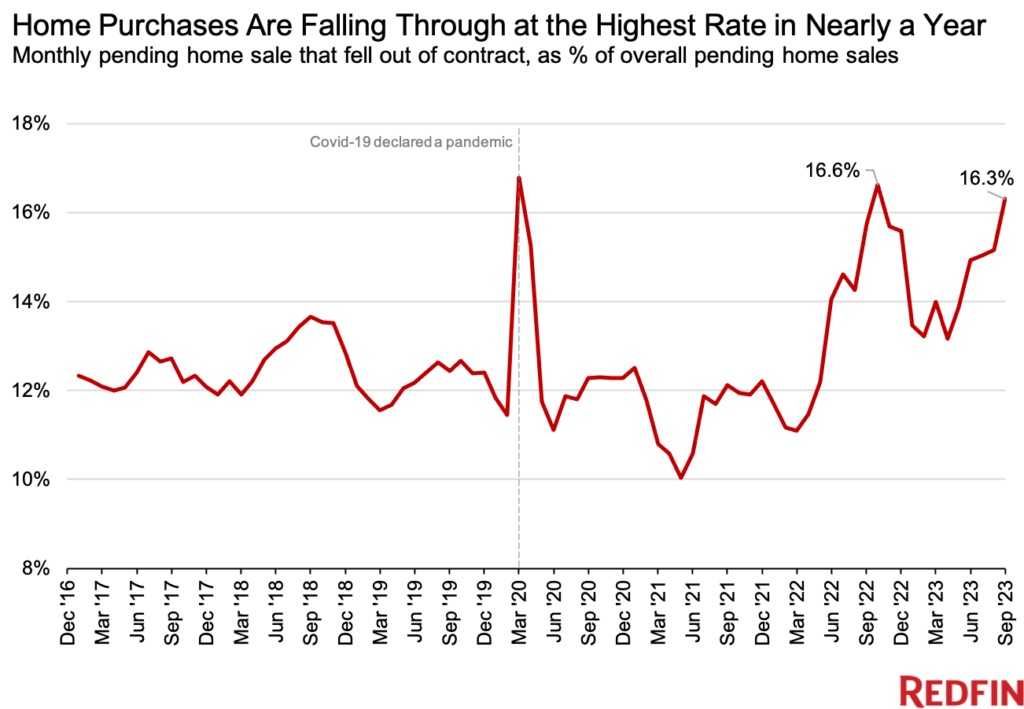
- But home purchases fell through at the highest rate in nearly a year as high rates gave buyers cold feet.
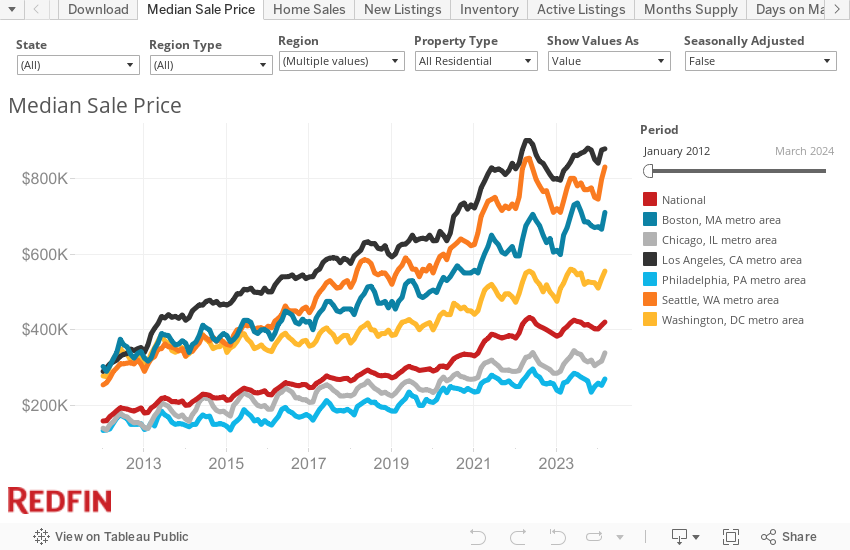
- Prices rose 2% from a year earlier despite sluggish demand because a limited supply of homes for sale created some competition.
New listings climbed 1.4% month over month in September, the largest increase since February 2022 on a seasonally adjusted basis. That’s a glimmer of relief for homebuyers, who for months have been waiting for more homes to hit the market.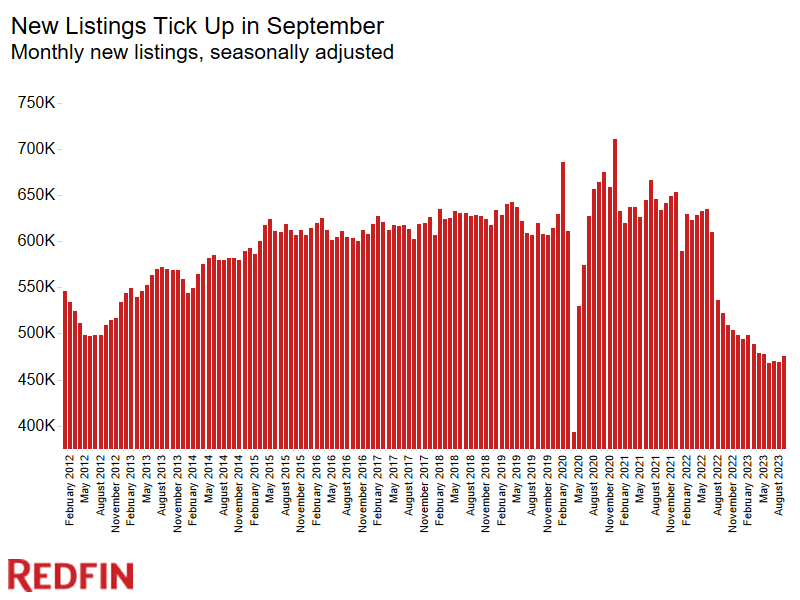
“A lot of Americans are sitting on piles of money in their homes, and some are opting to cash out even if it means giving up their low mortgage rate; they’re worried there’s a possibility home prices will fall if rates remain elevated. We expect rates to remain high for the foreseeable future,” said Redfin Chief Economist Daryl Fairweather. “But we also expect prices to stay high into next year. Housing supply is so strained that even a small uptick in listings lures buyers off the sidelines, bolstering sales.”
Still, new listings dropped 8.9% on a year-over-year basis in September and remained far below pre-pandemic levels. That’s because mortgage rates hit the highest level in more than two decades, with the average weekly 30-year-fixed rate clocking in at 7.2%. It has since moved even higher, last week hitting a weekly average of 7.63%, and 8% on a daily basis.
The overall supply of homes for sale (active listings) rose 1.9% month over month in September on a seasonally adjusted basis, the largest gain since last summer. But active listings fell 16.9% from a year earlier and remained near the lowest level on record as homeowners continued to feel locked in to their low mortgage rates. For many, selling their home and buying a new one would mean taking on a much higher monthly payment.
September 2023 Highlights: United States
| September 2023 | Month-Over-Month Change | Year-Over-Year Change | |
| Median sale price | $412,081 | -2.0% | 1.9% |
| Pending sales, seasonally adjusted | 390,251 | 1.3% | -12.1% |
| Homes sold, seasonally adjusted | 404,229 | -1.5% | -12.8% |
| New listings, seasonally adjusted | 475,280 | 1.4% | -8.9% |
| All homes for sale, seasonally adjusted (active listings) | 1,347,701 | 1.9% | -16.9% |
| Months of supply | 2.5 | 0.4 | 0 |
| Median days on market | 33 | 2 | 1 |
| Share of for-sale homes with a price drop | 18.8% | 1.3 ppts | -1.7 ppts |
| Share of homes sold above final list price | 33.3% | -3.0 ppts | 1.2 ppts |
| Average sale-to-final-list-price ratio | 99.6% | -0.3 ppts | 0.3 ppts |
| Pending sales that fell out of contract, as % of overall pending sales | 16.3% | 1.1 ppts | 0.6 ppts |
| Average 30-year fixed mortgage rate | 7.20% | 0.13 ppts | 1.09 ppts |
Note: Data is subject to revision
Pending Home Sales Tick Up, But Deals Fall Through at the Highest Rate in Almost a Year
Pending home sales rose 1.3% month over month to the highest level in nearly a year on a seasonally adjusted basis as more listings hit the market. They were down 12.1% from a year earlier.
But while pending sales—the number of homes going under contract—improved in September, closed sales fell to the lowest level since the onset of the pandemic. They dropped 1.5% from a month earlier and 12.8% from a year earlier on a seasonally adjusted basis.
Pending sales ticking up and closed sales ticking down can be explained partly by a high portion of buyers backing out of contracts due to rising mortgage rates. Roughly 53,000 U.S. home-purchase agreements were canceled in September, equal to 16.3% of homes that went under contract that month—the highest percentage since October 2022, when mortgage rates surpassed 7% for the first time in two decades. That compares with 15.2% a month earlier and 15.8% a year earlier.
“Buyers are extra cautious right now. They want to make sure they’re getting a good deal given how much mortgage payments have gone up, and when they don’t feel like they’re getting a good deal, they’re backing out,” said Heather Kruayai, a Redfin Premier Agent in Jacksonville, FL, which saw the second highest rate of deal cancellations among the major metros Redfin analyzed. “Transactions are also falling apart due to skyrocketing insurance premiums and disagreements between buyers and sellers over necessary repairs. Overall, buyers hold a lot of the cards right now, and sellers are having to give out more concessions to close the deal.”
Scroll to the bottom of this report to find the deal cancellation rate for the 50 most populous U.S. metropolitan areas, along with other local insights.
Prices Continue to Climb as Lack of Supply Creates Competition
The median U.S. home sale price rose 1.9% year over year to $412,081 in September, and fell 2% from a month earlier—typical for this time of year.
Activity in the housing market is sluggish due to high mortgage rates, but prices remain near their record high because the buyers who are out there are competing for a limited number of homes.
Nearly two of every five homes (37.4%) that went under contract in September did so within two weeks, up from 32.6% a year earlier—a sign of homebuyer competition. Starter homes are particularly competitive right now, Redfin agents say, because housing affordability has fallen so dramatically.
The combination of still-high home prices and rising mortgage rates means homebuyers now must earn $114,627 to afford the median-priced U.S. home, up 15% ($15,285) from a year ago and up more than 50% since the start of the pandemic, a separate Redfin analysis found.
Metro-Level Highlights: September 2023
Data in the bullets below came from a list of the 91 U.S. metro areas with populations of at least 750,000. Select metros may be excluded from time to time to ensure data accuracy. A full metro-level data table can be found in the “download” tab of the dashboard embedded below or in the monthly section of the Redfin Data Center. Refer to our metrics definition page for explanations of metrics used in this report. Metro-level data is not seasonally adjusted.
Note: Sales and listings posted large year-over-year gains in coastal Florida metros including North Port and Cape Coral in part because Hurricane Ian slowed housing market activity in September 2022.
- Pending sales: In Honolulu, pending sales fell 34.5% year over year, more than any other metro Redfin analyzed. Next came Birmingham, AL (-34.1%) and Colorado Springs, CO (-33.9%). Only three metros saw increases: North Port, FL (5.4%), Detroit (3.3%) and Tampa, FL (2.3%).
- Closed sales: In Tacoma, WA, closed home sales dropped 40.2% year over year, more than any other metro Redfin analyzed. Next came Oxnard, CA (-28.6%) and Fresno, CA (-28.5%). Closed sales rose most in North Port (42.8%), Cape Coral, FL (17.6%) and Tampa (15%).
- Prices: Median sale prices rose most from a year earlier in Rochester, NY (14.6%), Anaheim, CA (13%) and Buffalo, NY (10.9%). They fell in 17 metros, with the steepest declines in Austin, TX (-5.2%), North Port (-3.7%) and San Francisco (-2.5%).
- Listings: New listings fell most from a year earlier in Tacoma (-31.5%), Atlanta (-30.8%) and Houston (-29.9%). They rose most in North Port (33.6%), Cape Coral (30.6%) and Tampa (17.8%).
- Supply: Active listings fell most from a year earlier in Las Vegas (-41.7%), Stockton, CA (-38.2%) and Tacoma (-35.2%). They climbed most in Cape Coral (27.1%), New Orleans (26.5%) and North Port (26.4%).
- Competition: In Rochester, 72.8% of homes sold above their final list price, the highest share among the metros Redfin analyzed. Next came San Jose, CA (68.6%) and Worcester, MA (66.6%). The shares were lowest in North Port (8.9%), Cape Coral (10.3%) and Austin (12.2%).
- Speed: In Rochester, 71.8% of homes that went under contract did so within two weeks—the highest share among the metros Redfin analyzed. Next came Grand Rapids, MI (64.3%) and Buffalo (62.6%). The lowest shares were in Honolulu (5%), Lake County, IL (11.8%) and Chicago (11.8%).
Home-Purchase Cancellations
Data below came from a list of the 50 most populous metro areas. Please note that homes that fell out of contract during a given month didn’t necessarily go under contract the same month. For example, a home that fell out of contract in September could have gone under contract in August.
| Metro Area | September 2023: Pending Sales That Fell Out of Contract, as % of Overall Pending Sales | August 2023: Pending Sales That Fell Out of Contract, as % of Overall Pending Sales | September 2022: Pending Sales That Fell Out of Contract, as % of Overall Pending Sales |
|---|---|---|---|
| Anaheim, CA | 14.8% | 14.2% | 17.1% |
| Atlanta, GA | 24.4% | 23.6% | 27.1% |
| Austin, TX | 14.8% | 16.3% | 20.6% |
| Baltimore, MD | 14.3% | 13.8% | 14.4% |
| Boston, MA | 11.0% | 9.7% | 11.8% |
| Charlotte, NC | 12.6% | 11.0% | 15.4% |
| Chicago, IL | 18.3% | 16.5% | 17.2% |
| Cincinnati, OH | 13.0% | 7.6% | 14.2% |
| Cleveland, OH | 19.6% | 17.6% | 19.6% |
| Columbus, OH | 16.2% | 16.3% | 19.1% |
| Dallas, TX | 20.2% | 19.1% | 21.7% |
| Denver, CO | 19.3% | 18.9% | 20.0% |
| Detroit, MI | 18.2% | 16.6% | 16.9% |
| Fort Lauderdale, FL | 22.0% | 22.6% | 21.2% |
| Fort Worth, TX | 21.0% | 21.4% | 20.7% |
| Houston, TX | 15.0% | 17.6% | 20.3% |
| Indianapolis, IN | 17.8% | 16.6% | 19.2% |
| Jacksonville, FL | 24.0% | 25.7% | 28.8% |
| Kansas City, MO | 15.2% | 15.2% | 15.4% |
| Las Vegas, NV | 21.1% | 22.7% | 20.6% |
| Los Angeles, CA | 17.4% | 15.7% | 17.6% |
| Miami, FL | 20.5% | 19.3% | 17.8% |
| Milwaukee, WI | 10.6% | 9.3% | 9.9% |
| Minneapolis, MN | 11.1% | 10.0% | 11.3% |
| Montgomery County, PA | 7.1% | 8.5% | 9.5% |
| Nashville, TN | 15.7% | 15.1% | 19.3% |
| Nassau County, NY | 5.3% | 6.8% | 4.9% |
| New Brunswick, NJ | 9.9% | 10.0% | 10.0% |
| New York, NY | 10.3% | 9.3% | 6.0% |
| Newark, NJ | 10.5% | 11.2% | 3.7% |
| Oakland, CA | 9.2% | 9.3% | 11.4% |
| Orlando, FL | 23.6% | 22.7% | 24.2% |
| Philadelphia, PA | 13.8% | 12.8% | 13.7% |
| Phoenix, AZ | 19.3% | 18.5% | 23.1% |
| Pittsburgh, PA | 16.5% | 16.0% | 17.7% |
| Portland, OR | 16.7% | 16.0% | 17.3% |
| Providence, RI | 13.7% | 10.2% | 12.9% |
| Riverside, CA | 20.3% | 20.7% | 20.0% |
| Sacramento, CA | 14.9% | 15.2% | 17.5% |
| San Antonio, TX | 21.2% | 22.1% | 24.6% |
| San Diego, CA | 16.2% | 15.5% | 16.8% |
| San Francisco, CA | 4.6% | 6.3% | 5.1% |
| San Jose, CA | 6.2% | 6.2% | 7.7% |
| Seattle, WA | 10.1% | 10.0% | 11.9% |
| St. Louis, MO | 14.5% | 13.6% | 14.2% |
| Tampa, FL | 22.7% | 22.0% | 23.8% |
| Virginia Beach, VA | 16.8% | 13.4% | 14.0% |
| Warren, MI | 13.9% | 13.3% | 14.0% |
| Washington, D.C. | 12.0% | 12.8% | 12.3% |
| West Palm Beach, FL | 19.8% | 19.1% | 20.4% |
| National—U.S.A. | 16.3% | 15.2% | 15.8% |