The average home spent just 20 days on the market before selling, a record low, and new listings of homes for sale were down 12% from 2019.
Key housing market takeaways for 400+ U.S. metro areas:
Unless otherwise noted, this data covers the four-week period ending April 25.
Note: At this time last year, pandemic stay-at-home orders halted homebuying and selling, which makes year-over-year comparisons unreliable for select housing metrics. As such, we have broken this report into two sections: metrics that are OK to compare to the same period in 2020, and metrics for which it makes more sense to compare to the same period in 2019.
Metrics to compare to 2020:
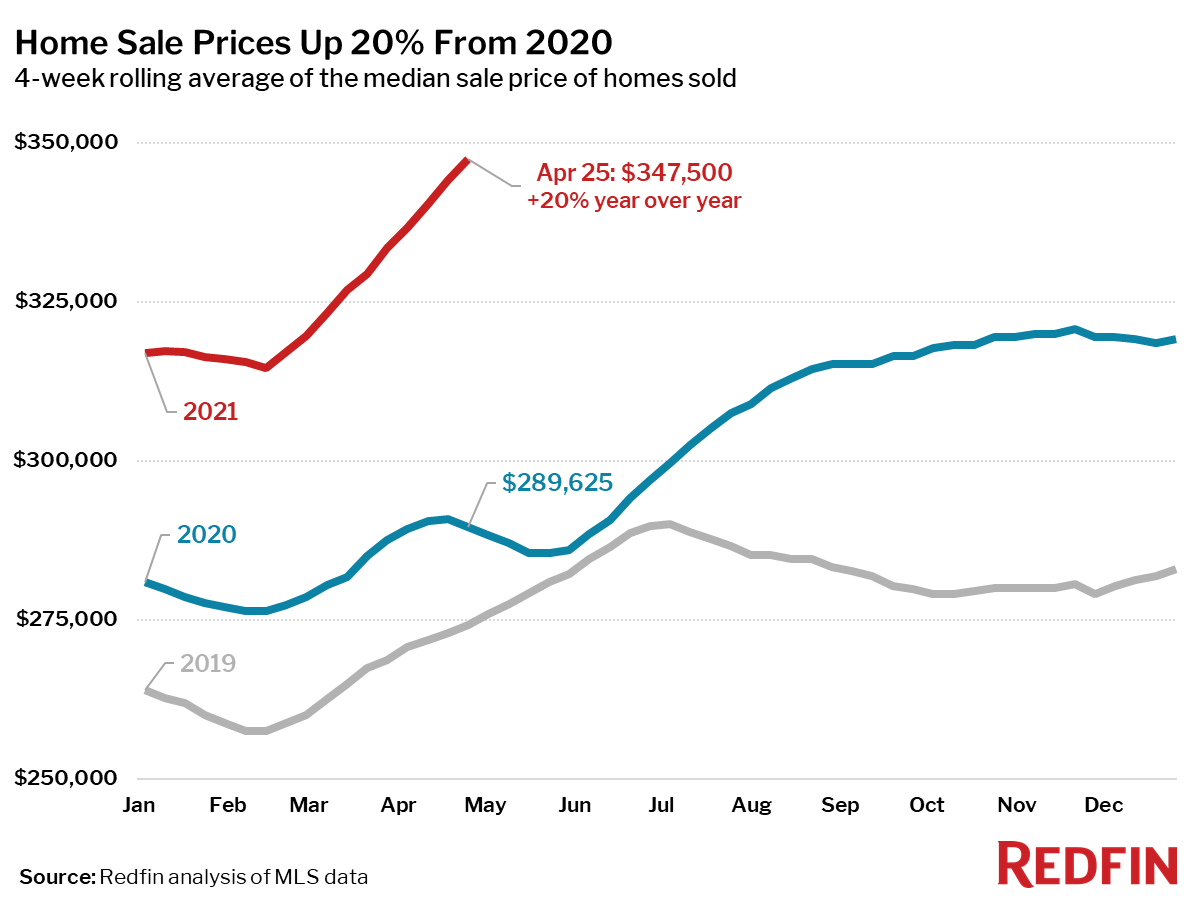
- The median home-sale price increased 20% year over year to $347,500, an all-time high. Note that this number is somewhat inflated due to a slight dip in median sale prices around this time in 2020, and due to fewer high-end homes being sold at this time a year ago, and more high-end homes being sold now. Asking prices reached an all-time high of $357,200.
- Homes that sold during the period were on the market for a median of 20 days, down 16 days from the same period in 2020 and the shortest time on market since at least 2012.
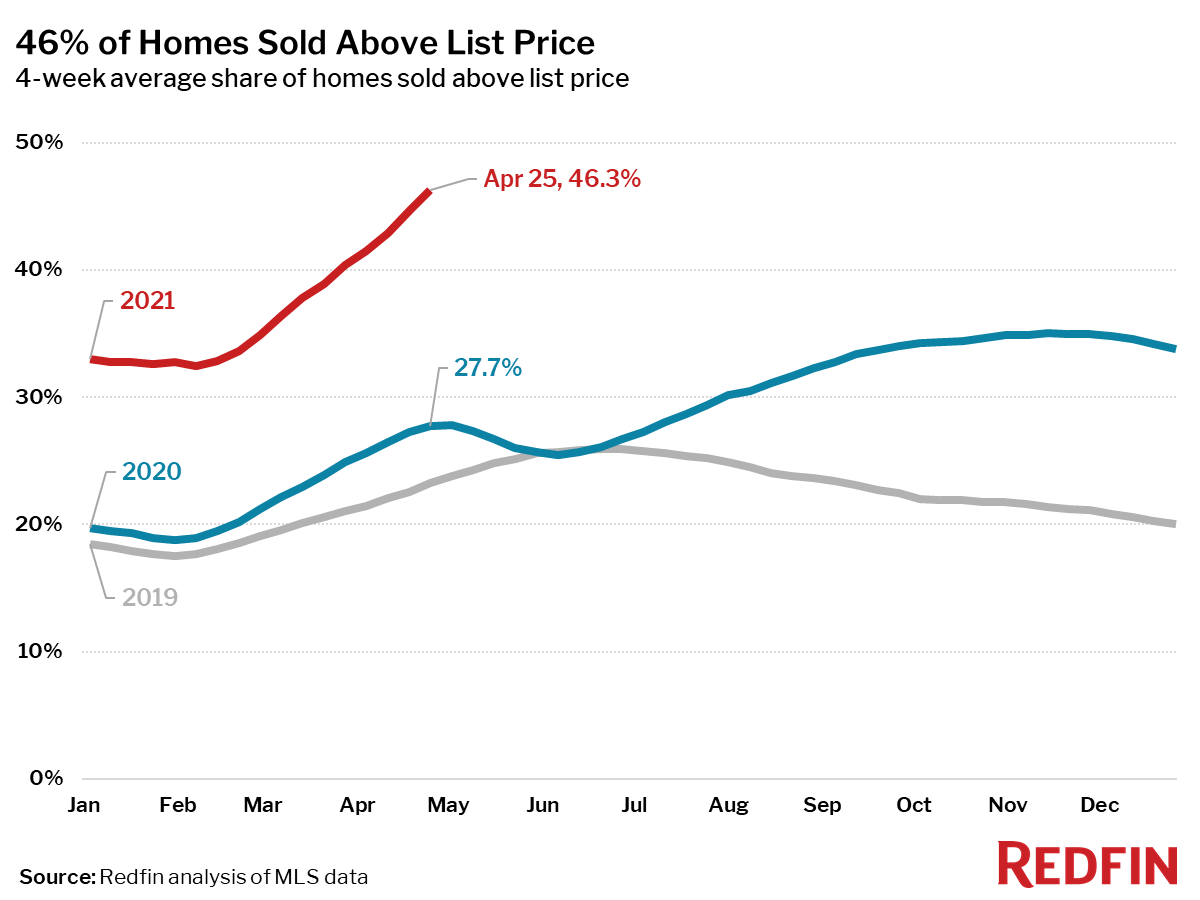
- An all-time high 46% of homes sold for more than their list price, up 19 percentage points from the same period a year earlier.
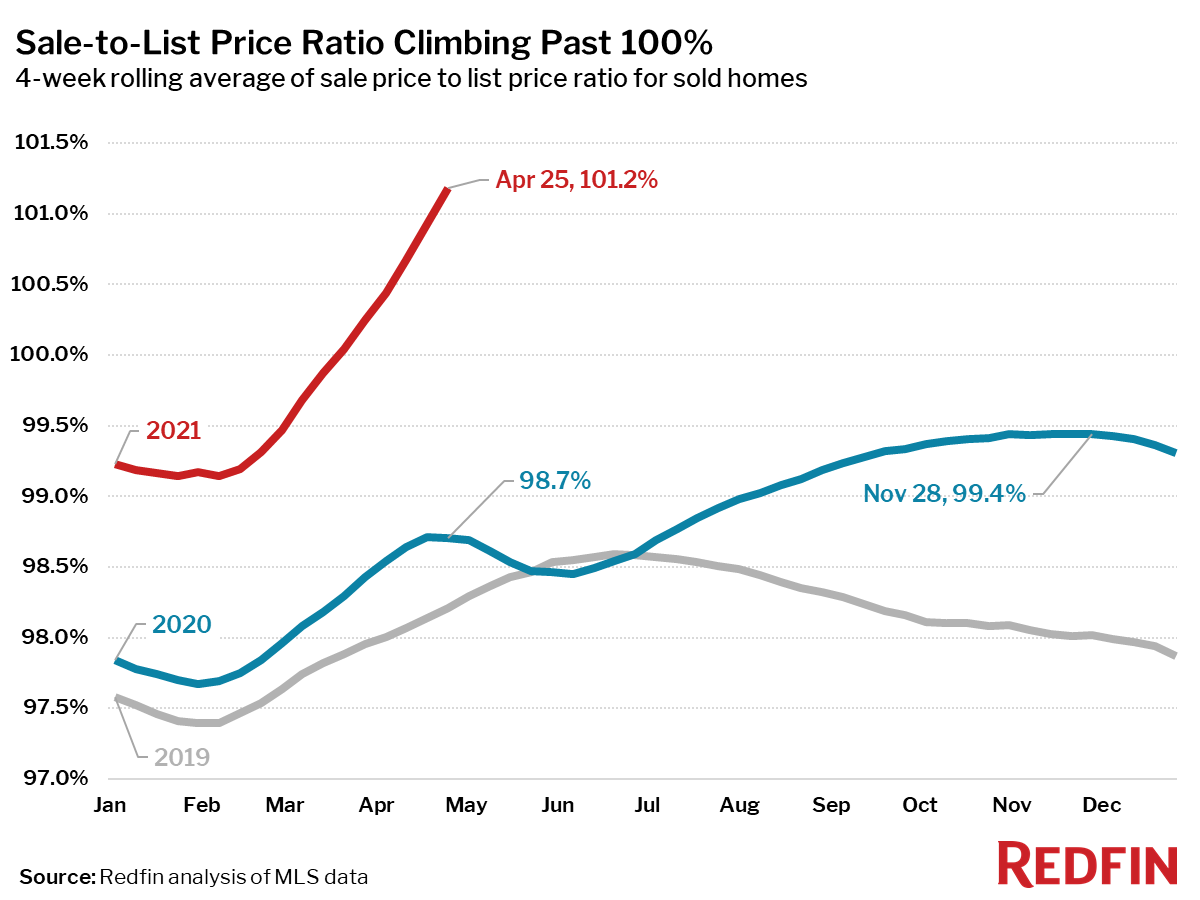
- The average sale-to-list price ratio, which measures how close homes are selling to their asking prices, increased 2.5 percentage points year over year to an all-time high of 101.2%, meaning the average home sold for 1.2% more than its asking price.
- 58% of homes that went under contract had an accepted offer within the first two weeks on the market. This was a new all-time high since at least 2012.
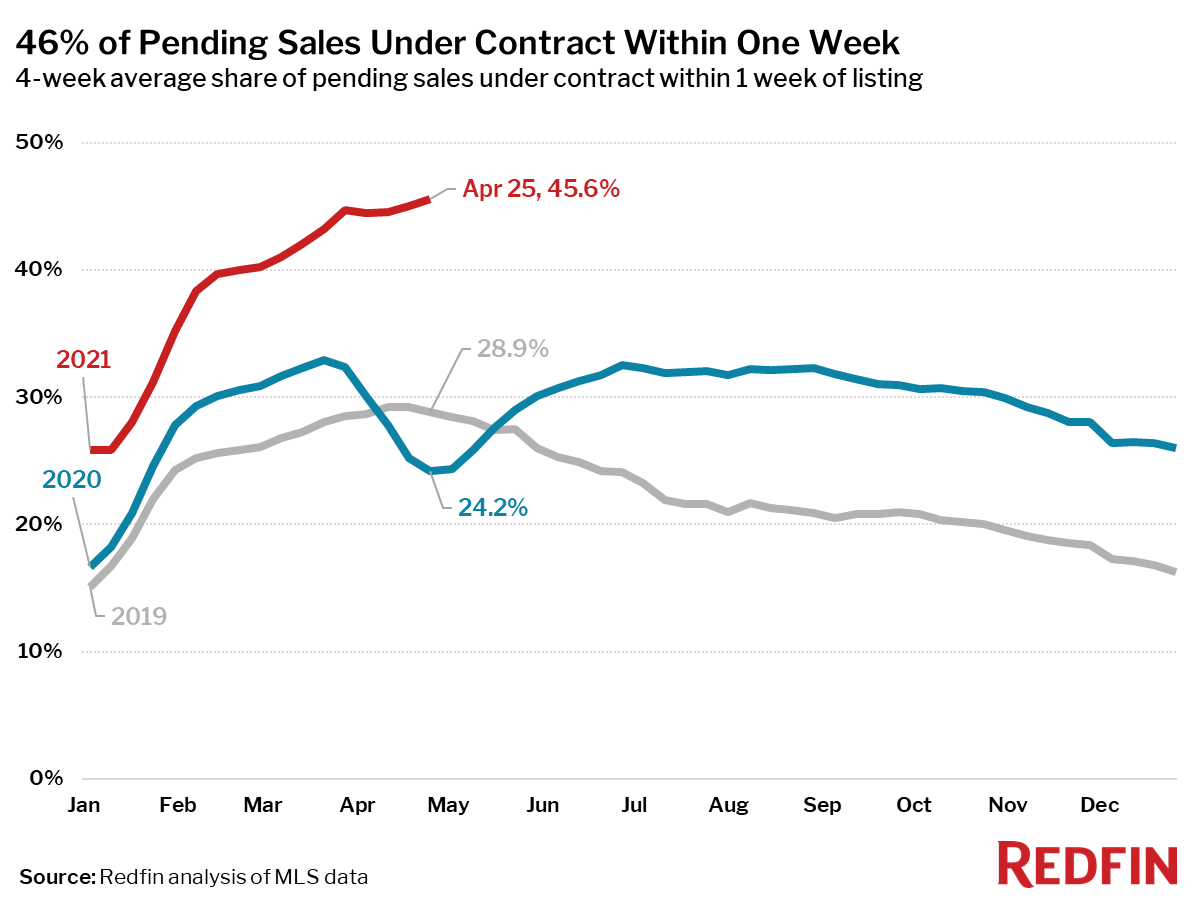
- 46% of homes that went under contract had an accepted offer within one week of hitting the market, an all-time high.
Metrics to compare to 2019:
- Pending home sales were up 23% from the same period in 2019.
- New listings of homes for sale were down 12% from the same period in 2019. New listings were up 2% from the four-week period ending March 28. The small boost in the number of new listings fell far short of the 12% increase during the same period in 2019.
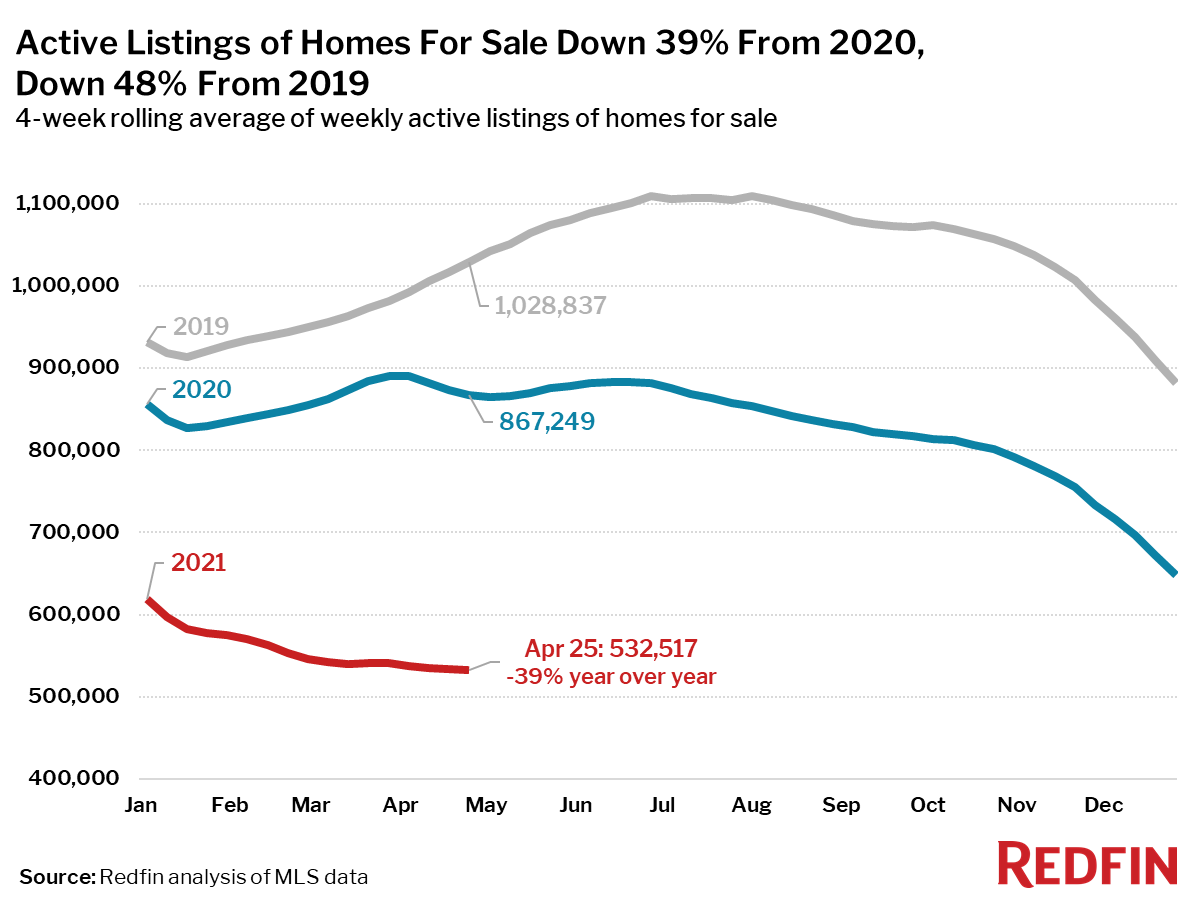
- Active listings (the number of homes listed for sale at any point during the period) fell 48% from the same period in 2019 to a new all-time low.
Mortgage purchase applications decreased 5% week over week (seasonally adjusted). For the week ending April 29, 30-year mortgage rates increased slightly to 2.98%.
“I am concerned about how we as a society are going to reckon with just how expensive housing has become,” said Redfin Chief Economist Daryl Fairweather. “But I’m not worried about a housing crash because these sky-high prices are supported by the new reality of well-funded buyers who are often benefiting from newfound mobility via remote work. As the economy recovers, we have the opportunity to reimagine our country’s role in supporting a healthy housing market. For instance, we can subsidize construction of affordable homes or support first-time homebuyers in underserved communities. We have our work cut out for us when it comes to ensuring homeownership is attainable for middle-class Americans with good jobs and money saved up, not just for the wealthiest among us.”
Refer to our metrics definition page for explanations of all the metrics used in this report.