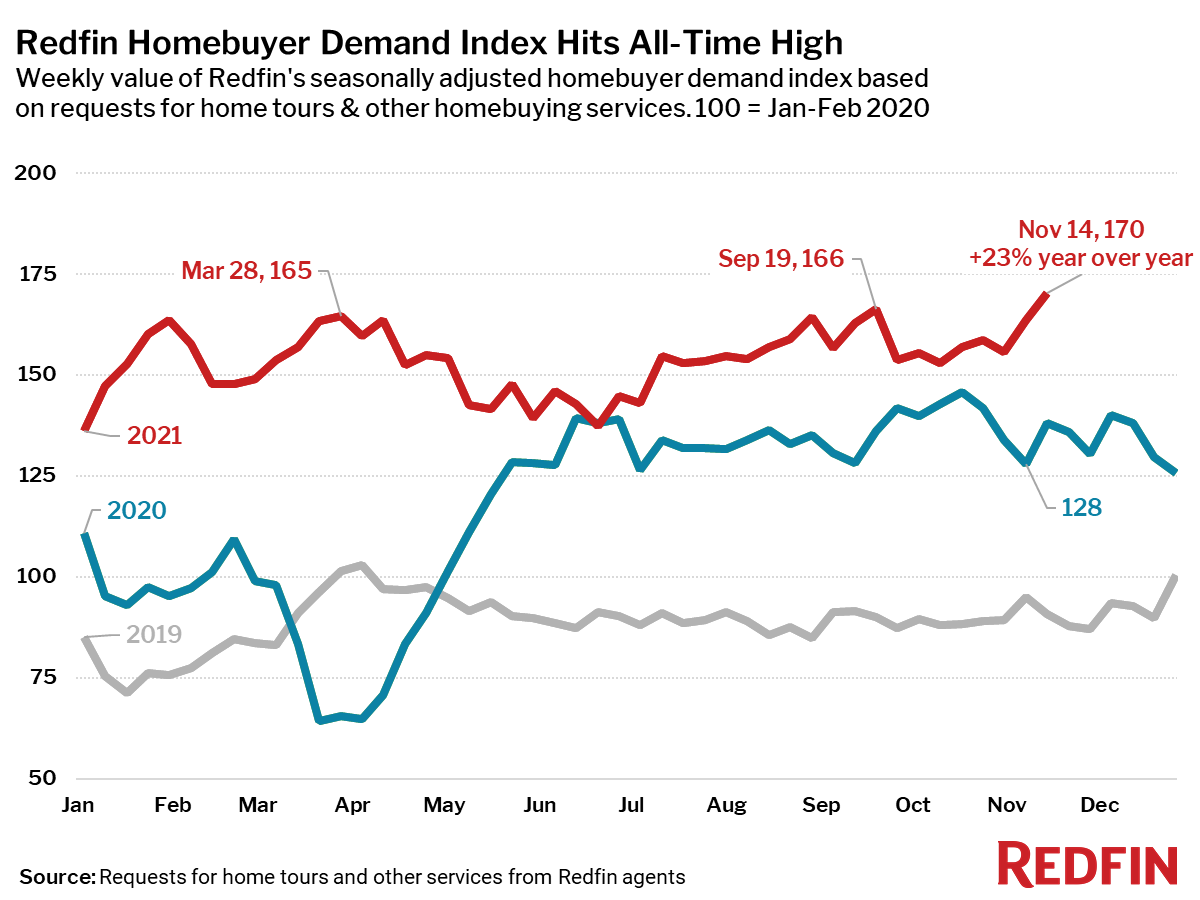
The seasonally-adjusted Redfin Homebuyer Demand Index hit a new high amid relative strength in the number of homes being listed.
Redfin’s Homebuyer Demand Index hit a new all-time high since at least 2017, suggesting strong ongoing housing demand during a time of year when the market typically slows. The Redfin Homebuyer Demand Index is a seasonally adjusted measure of requests for home tours and other home-buying services from Redfin agents and Redfin partner agents to whom the company refers business. The market also continues to speed up, with an increasing share of homes selling within two weeks. Demand is accelerating as the number of homes listed for sale is decreasing at a slightly slower rate than in 2019 and 2020. New listings are down 12% since six weeks earlier, but this is a smaller drop than the 18% decrease over the same period in 2019.
“The economy is recovering strongly and mortgage rates are still near all-time lows. Those two forces combined have caused homebuying demand to hit a record high,” said Redfin Chief Economist Daryl Fairweather. “People who tried to buy a home in the spring are coming back for round two, only to find the market is still quite difficult because of a lack of homes for sale. A lot of homebuyers wish they had bought last year, now that it’s not just homes that are more expensive, but also gas, groceries and dining out. Many buyers today are limited to move-in ready homes because it is so difficult and expensive to purchase new appliances or find contractors to make improvements.”
Key housing market takeaways for 400+ U.S. metro areas:
Unless otherwise noted, the data in this report covers the four-week period ending November 14. Redfin’s housing market data goes back through 2012. Comparing today’s market with the pre-pandemic fall market of 2019 highlights how hot the market remains, even as most measures are settling into typical seasonal patterns.
Data based on homes listed and/or sold during the period:
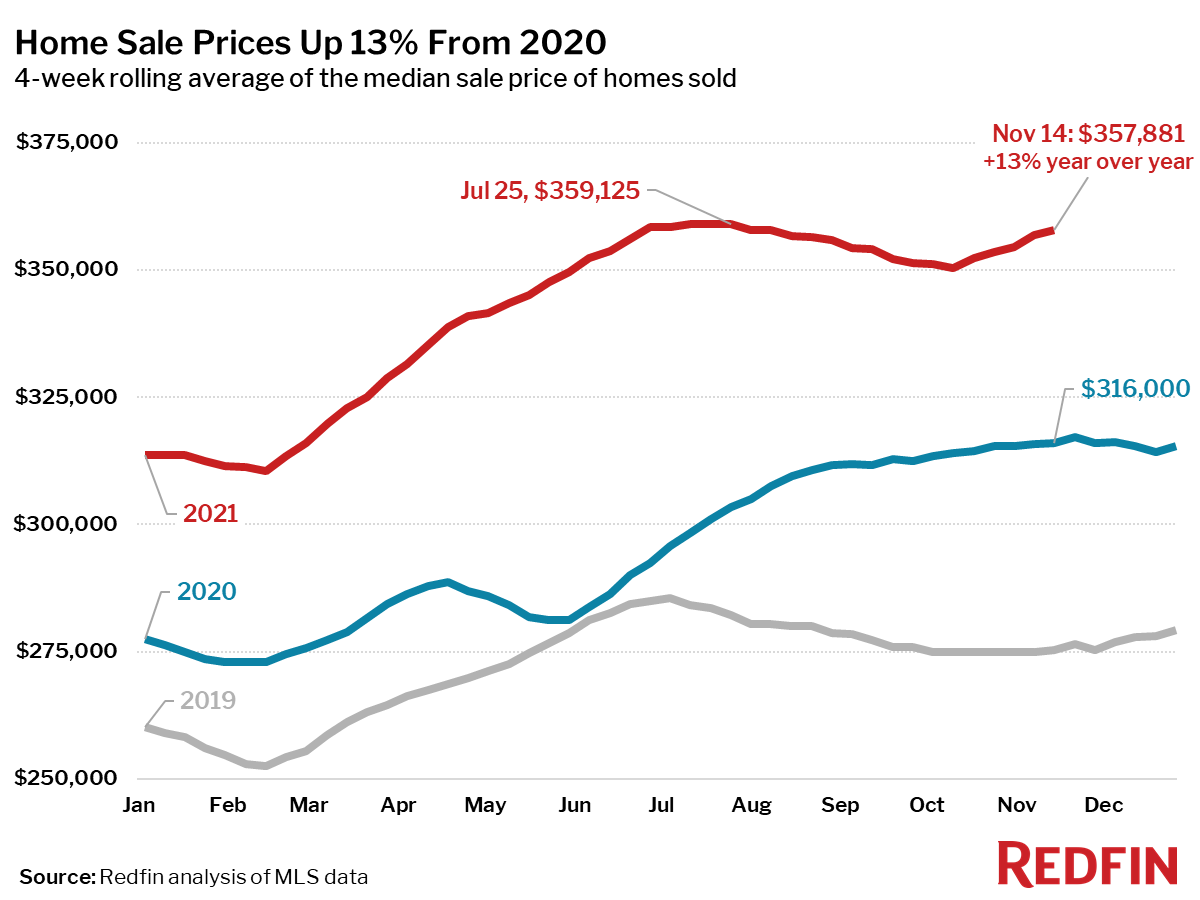
- The median home-sale price increased 13% year over year to $357,881. This was up 30% from the same period in 2019 and up 2.1% from a month earlier. Over the same period in 2019 prices were down 0.1%, and in 2020 home prices rose 0.6%.
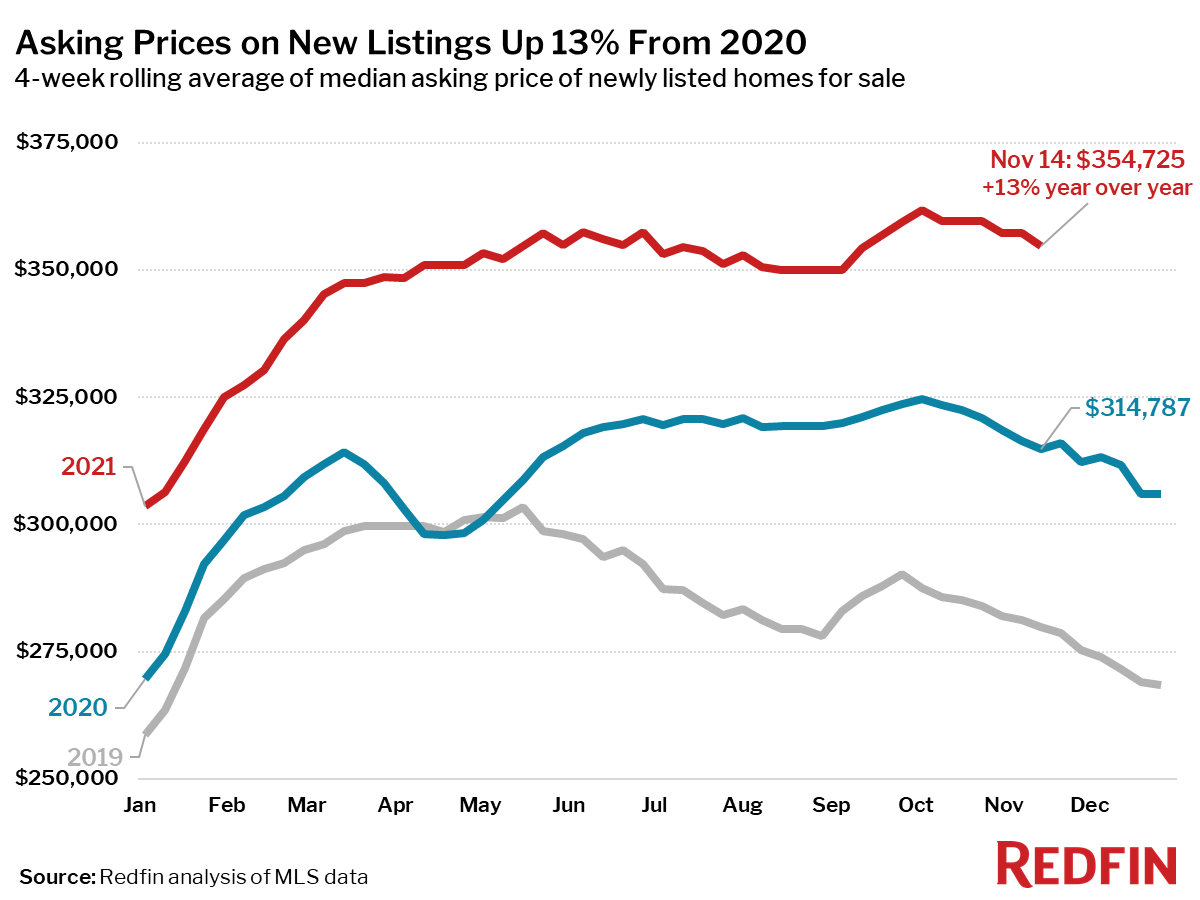
- Asking prices of newly listed homes were up 13% from the same time a year ago and up 27% from 2019 to a median of $354,725.
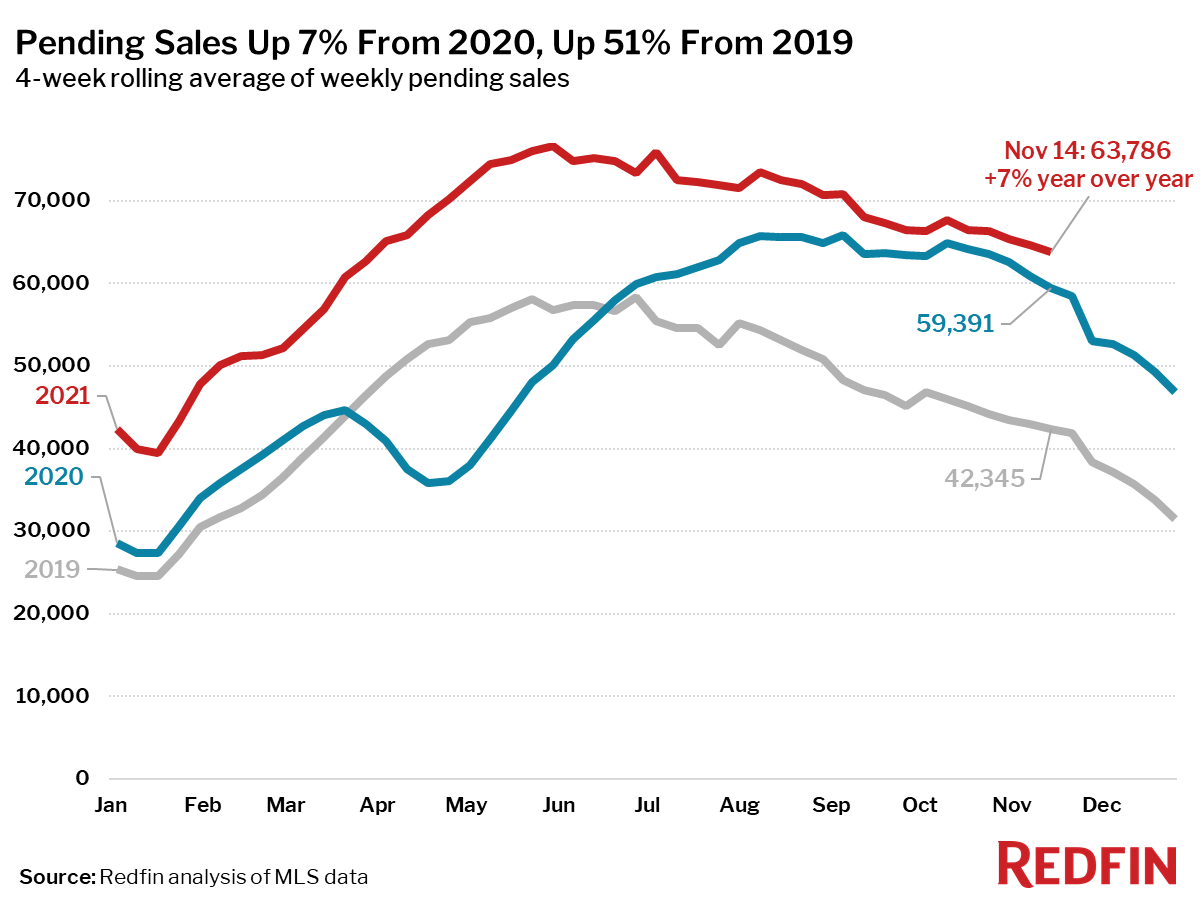
- Pending home sales were up 7% year over year, and up 51% compared to the same period in 2019.
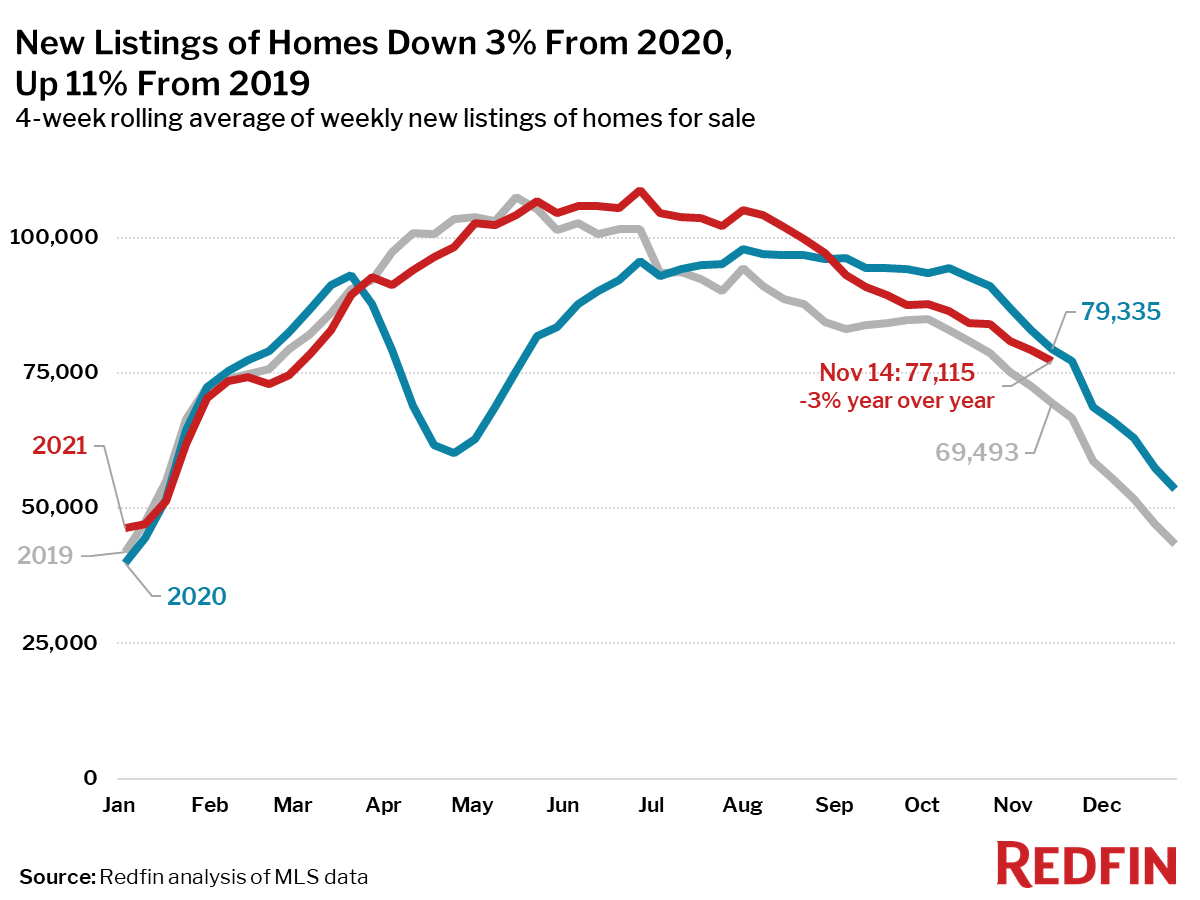
- New listings of homes for sale were down 3% from a year earlier, but up 11% from 2019. Since the four-week period ending October 3, new listings are down 12%, a smaller decline than over the same period in 2019 (-18%) and in 2020 (-15%).
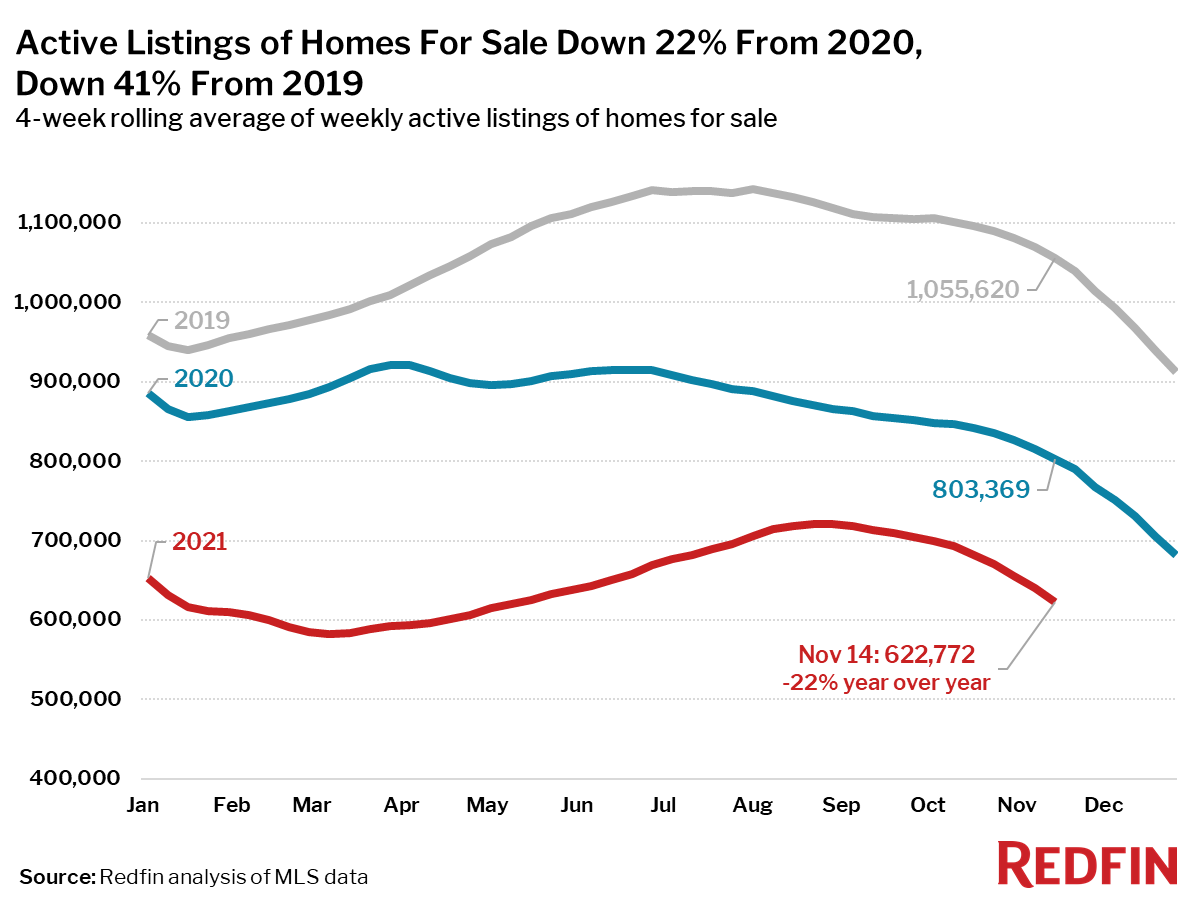
- Active listings (the number of homes listed for sale at any point during the period) fell 22% from 2020 and 41% from 2019.
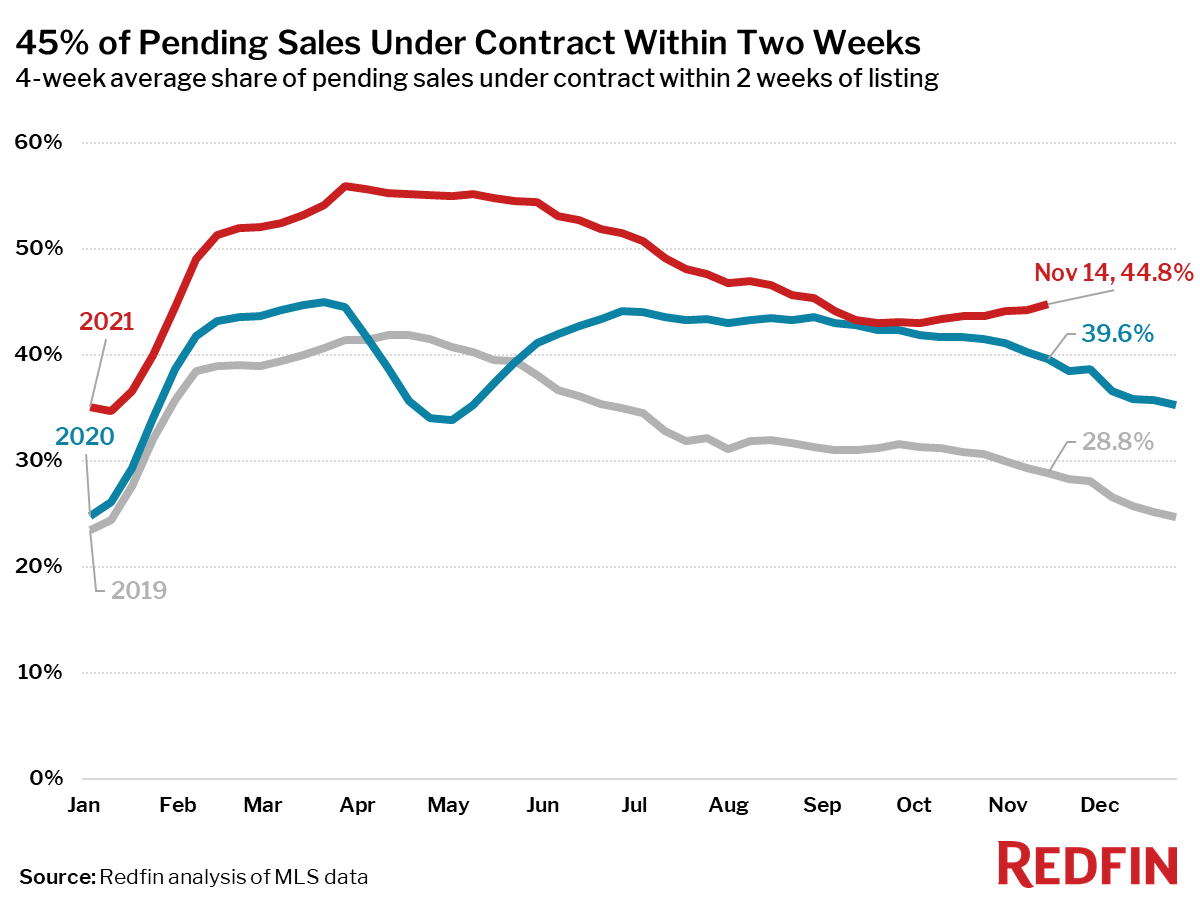
- 45% of homes that went under contract had an accepted offer within the first two weeks on the market, above the 40% rate of a year earlier and the 29% rate in 2019. Since the four-week period ending September 19, the share of homes under contract within two weeks is up 1.8 percentage points. During the same time in 2019, the share fell 2.4 points.
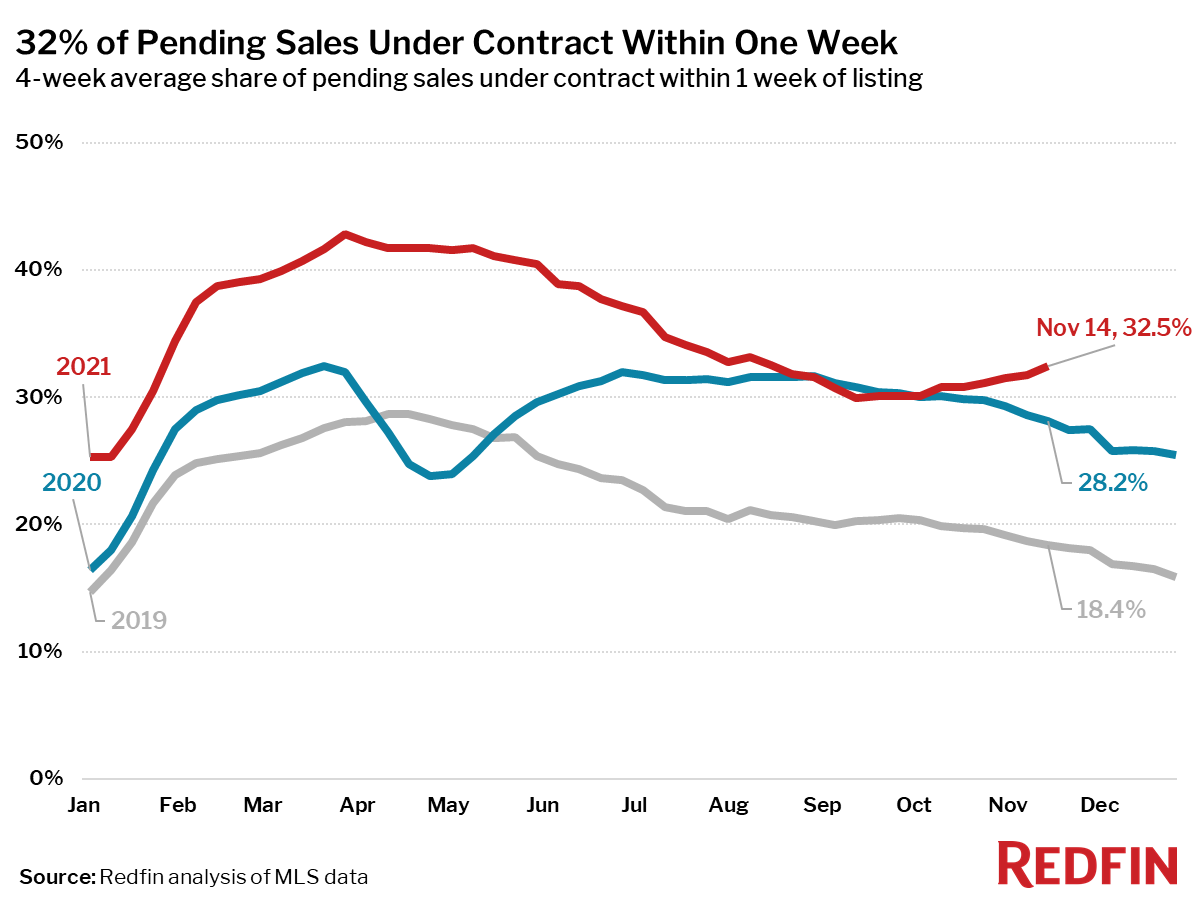
- 32% of homes that went under contract had an accepted offer within one week of hitting the market, up from 28% during the same period a year earlier and 18% in 2019. Since the four-week period ending September 12, the share of homes under contract within a week is up 2.6 percentage points. During the same time in 2019, the share fell 1.9 points.
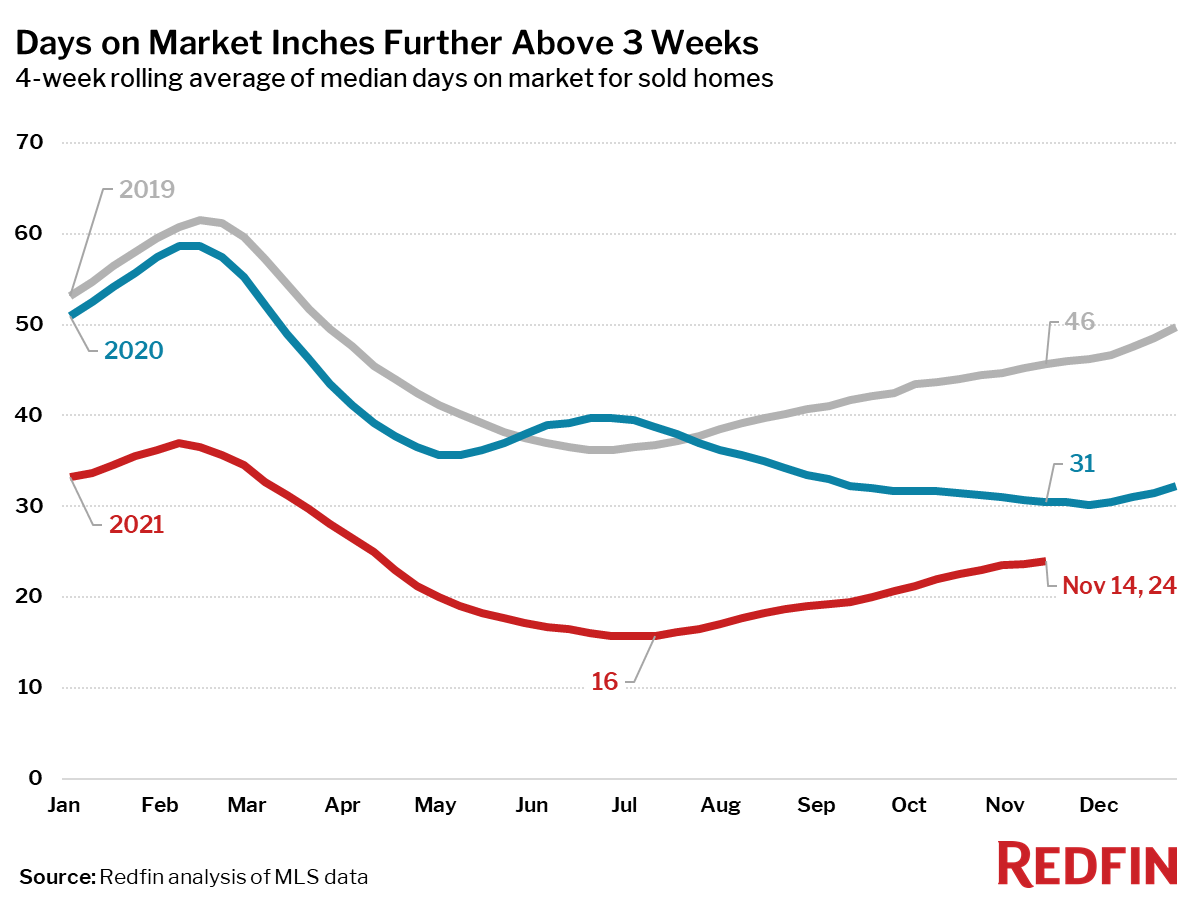
- Homes that sold were on the market for a median of 24 days, more than a week longer than the all-time low of 16 days seen in late June and July, down from 31 days a year earlier and 46 days in 2019.
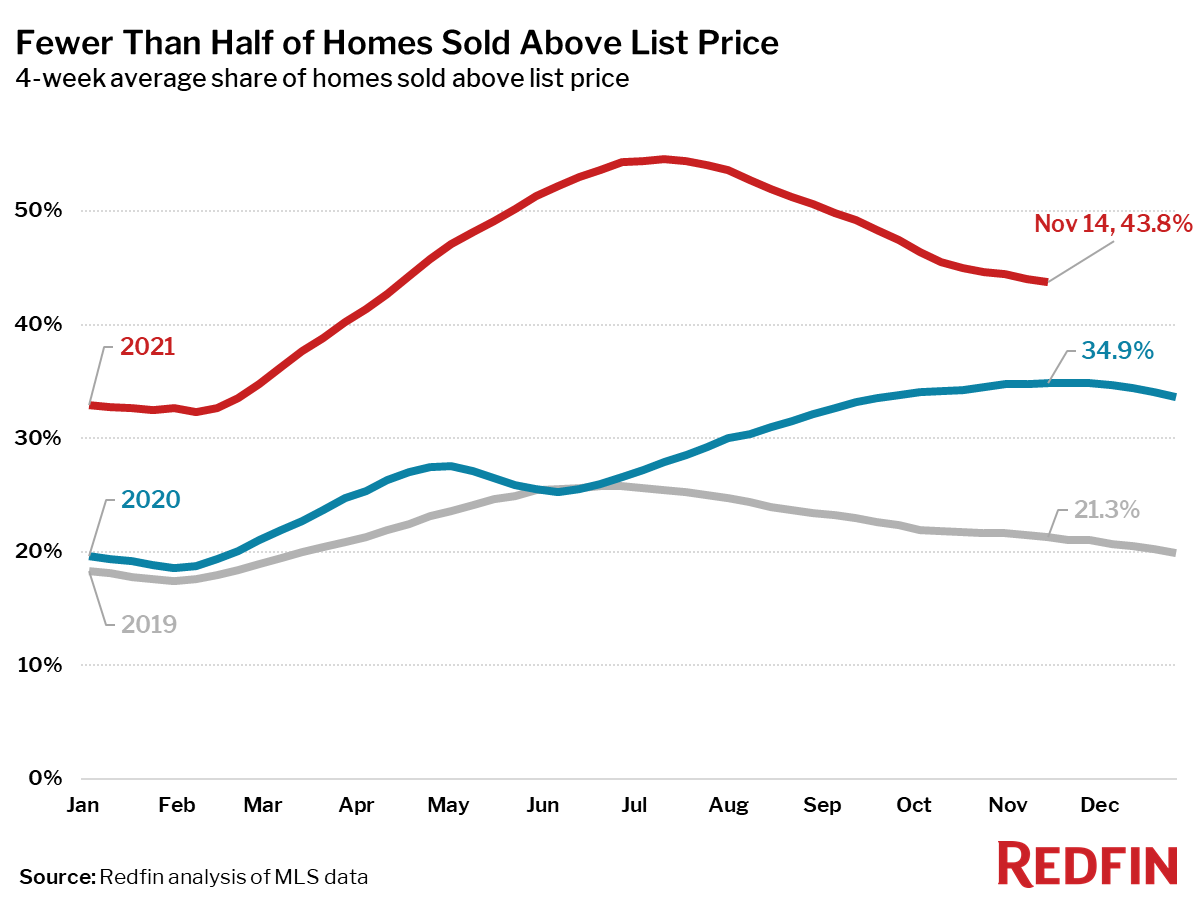
- 44% of homes sold above list price, up from 35% a year earlier and 21% in 2019.
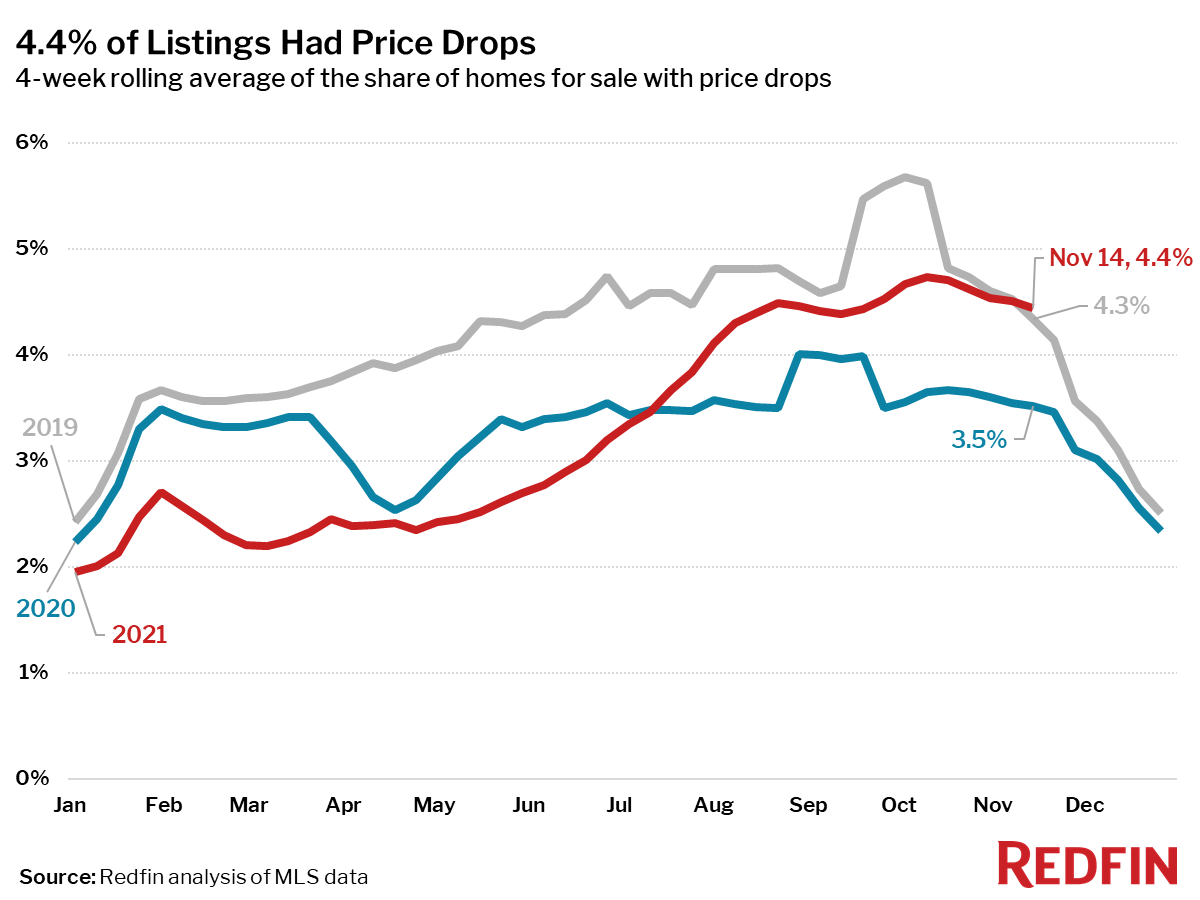
- On average, 4.4% of homes for sale each week had a price drop, up 0.9 percentage points from the same time in 2020 and up 0.1 points from this time in 2019.
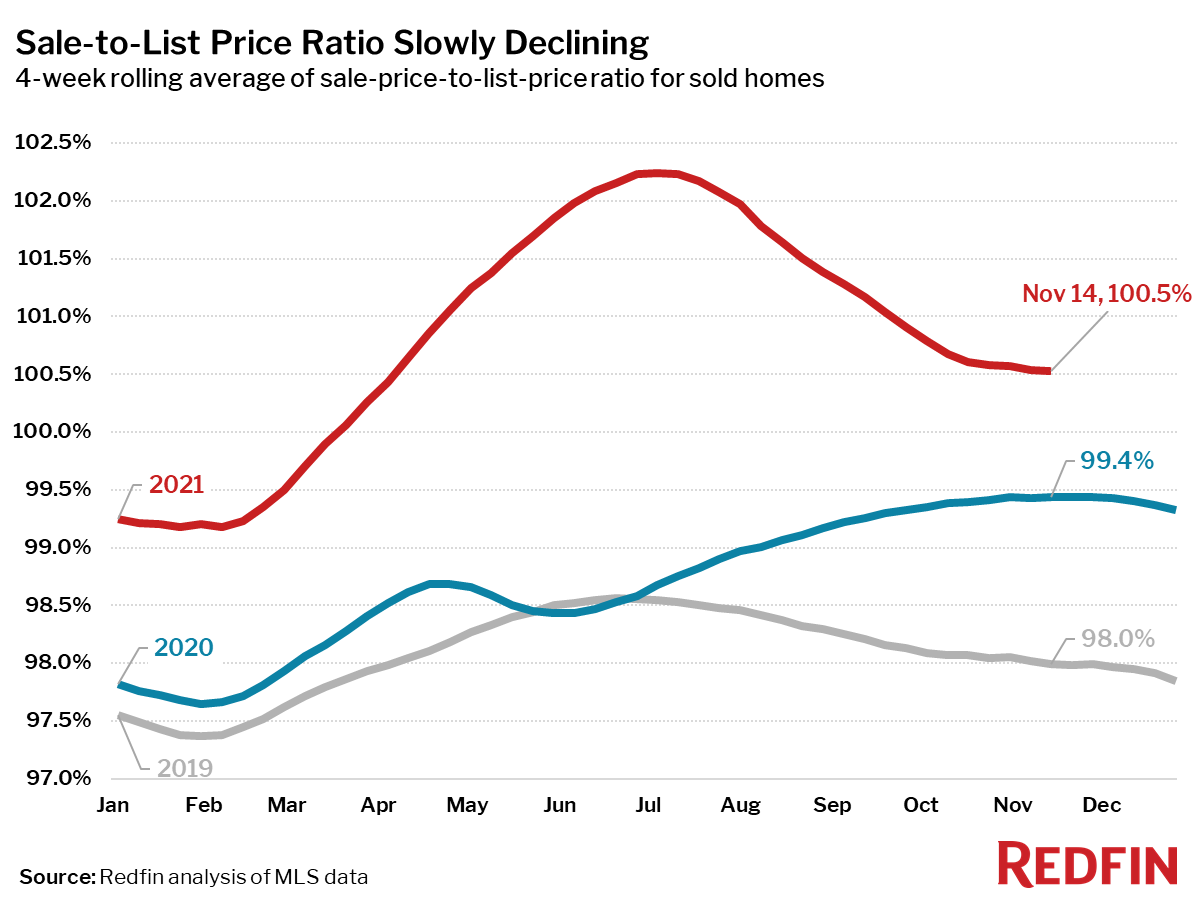
- The average sale-to-list price ratio, which measures how close homes are selling to their asking prices, has declined just 0.1 points from 100.6% to 100.5% over the past month. In other words, the average home sold for 0.5% above its asking price.
Other leading indicators of homebuying activity:
- Mortgage purchase applications increased 2% week over week (seasonally adjusted) during the week ending November 12. For the week ending November 10, 30-year mortgage rates fell to 2.98%.
- Touring activity is outpacing 2019 by at least 5% through November 14 relative to the first week of January according to home tour technology company ShowingTime.
- The Redfin Homebuyer Demand Index rose 6.7 points during the week ending November 14 to its highest level on record since the data began in 2017, and was up 23% from a year earlier. The seasonally adjusted Redfin Homebuyer Demand Index is a measure of requests for home tours and other home-buying services from Redfin agents.
Refer to our metrics definition page for explanations of all the metrics used in this report.