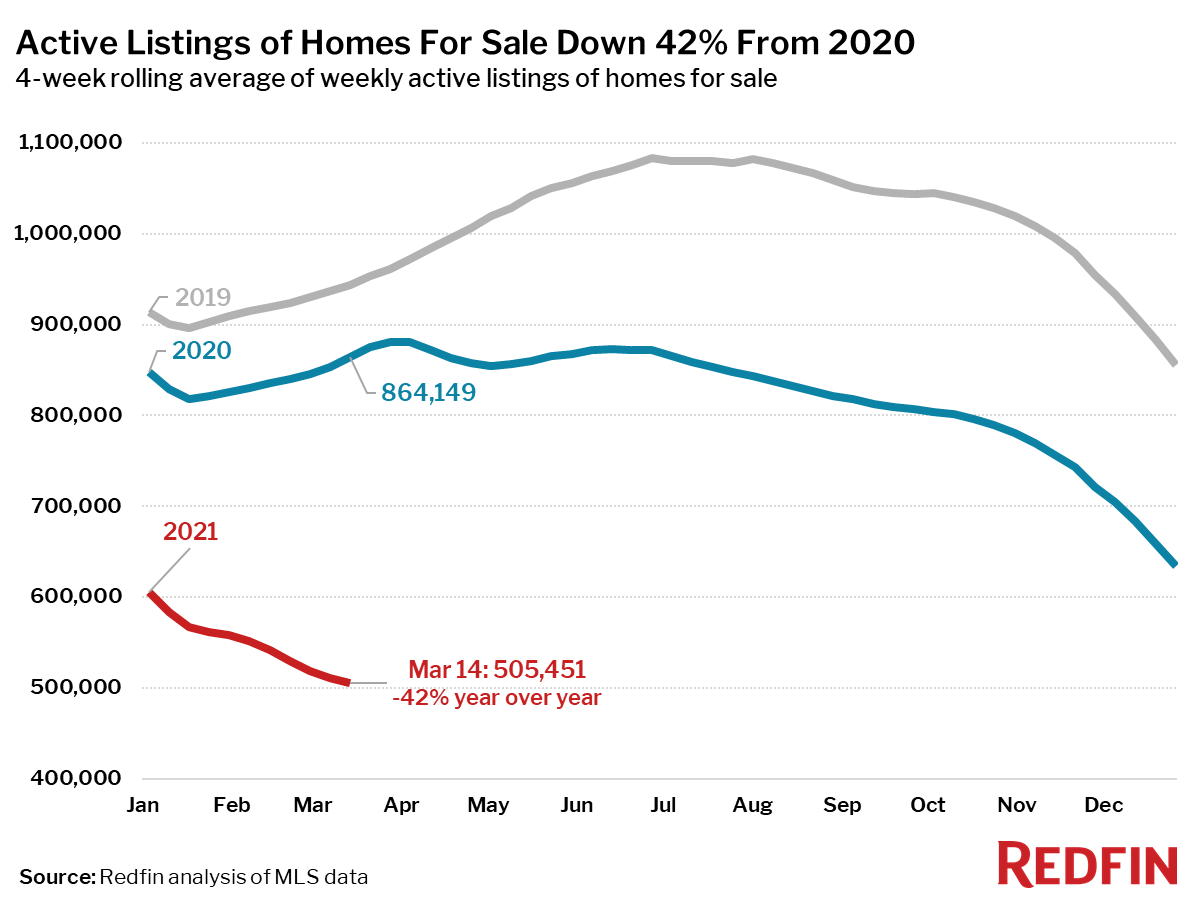
The number of homes for sale fell 42% compared with the last four weeks before the 2020 coronavirus shutdowns began.
Key housing market takeaways for 400+ U.S. metro areas during the 4-week period ending March 14:
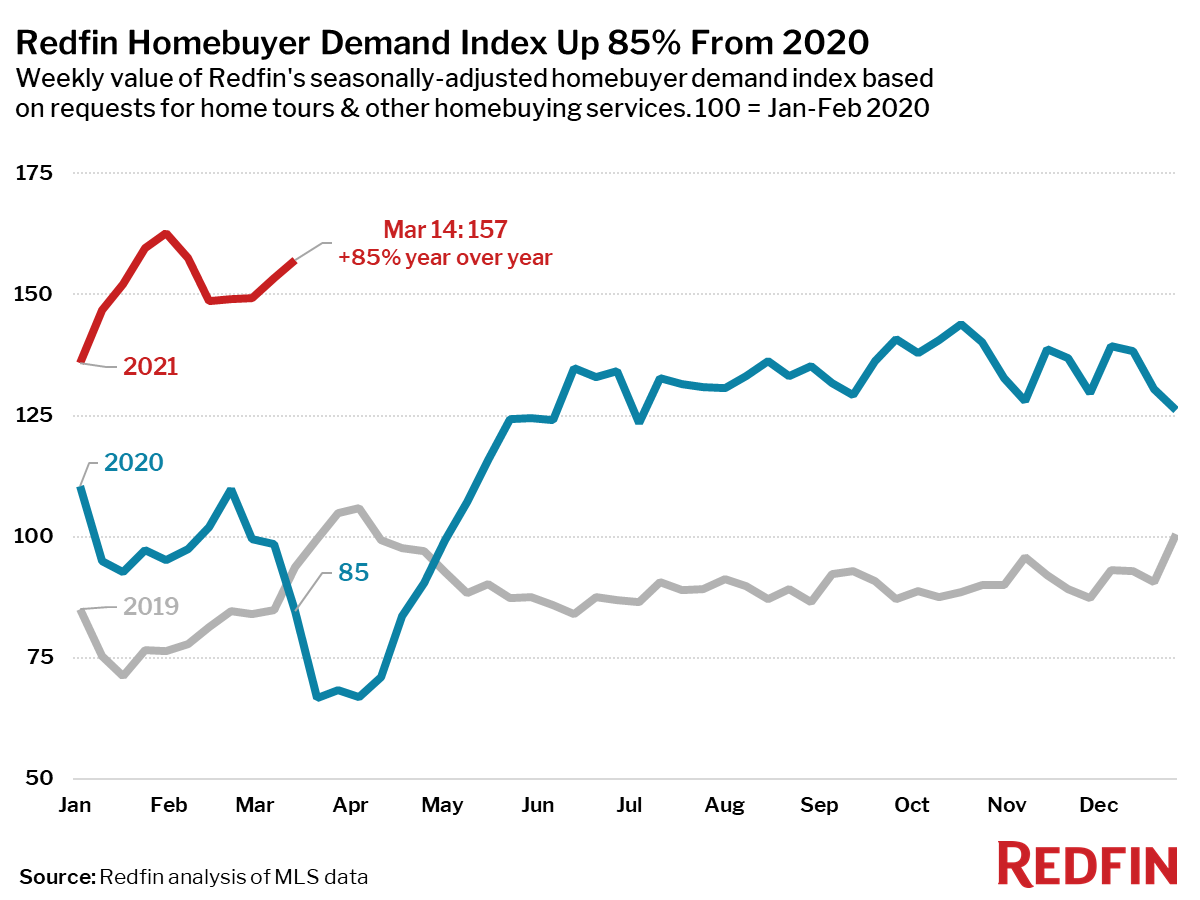
Note: We are now entering the period where our comparisons to a year ago are during the steep decline in homebuying demand at the start of the pandemic, so many housing demand measures will begin to show very large year-over-year increases in the coming weeks.
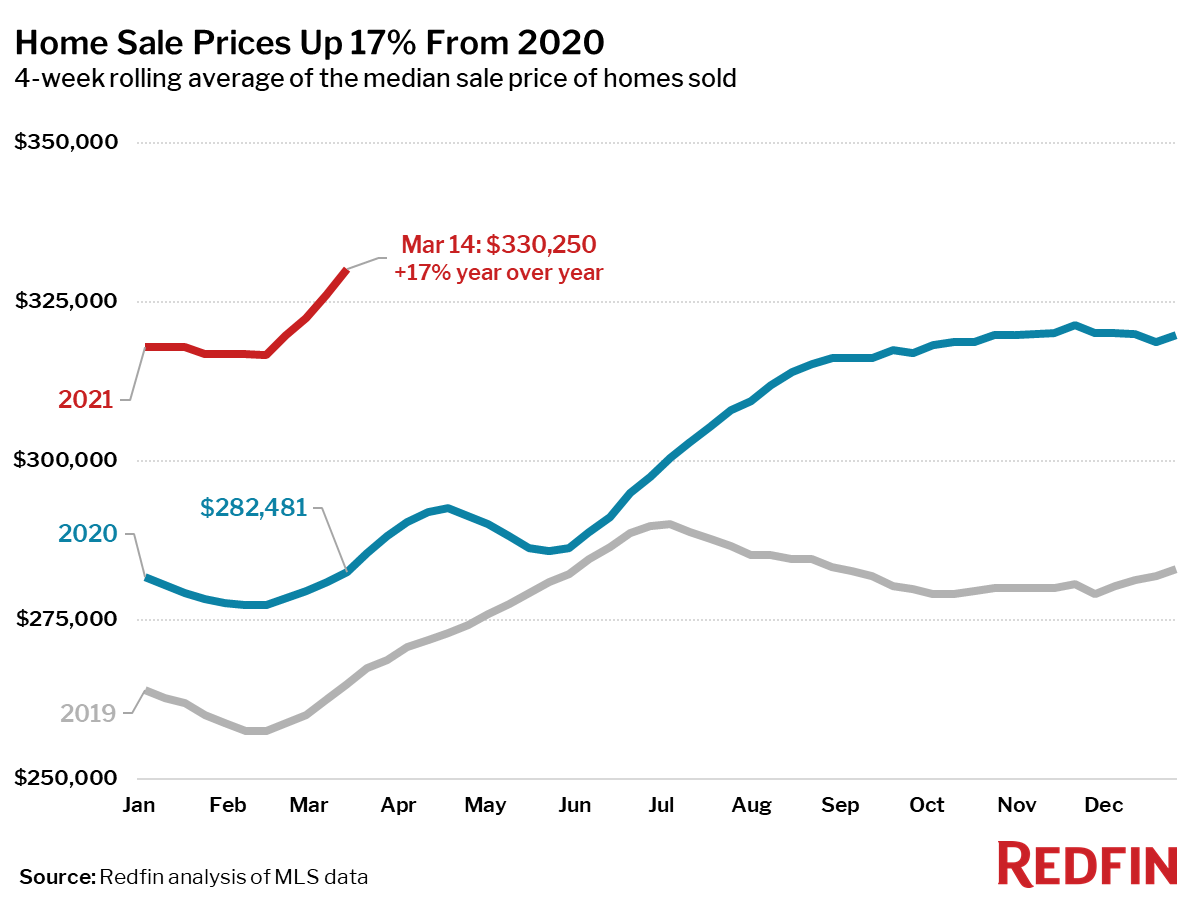
- The median home-sale price increased 17% year over year to $330,250, an all-time high. This is the largest increase on record in this data set, which goes back through 2016.
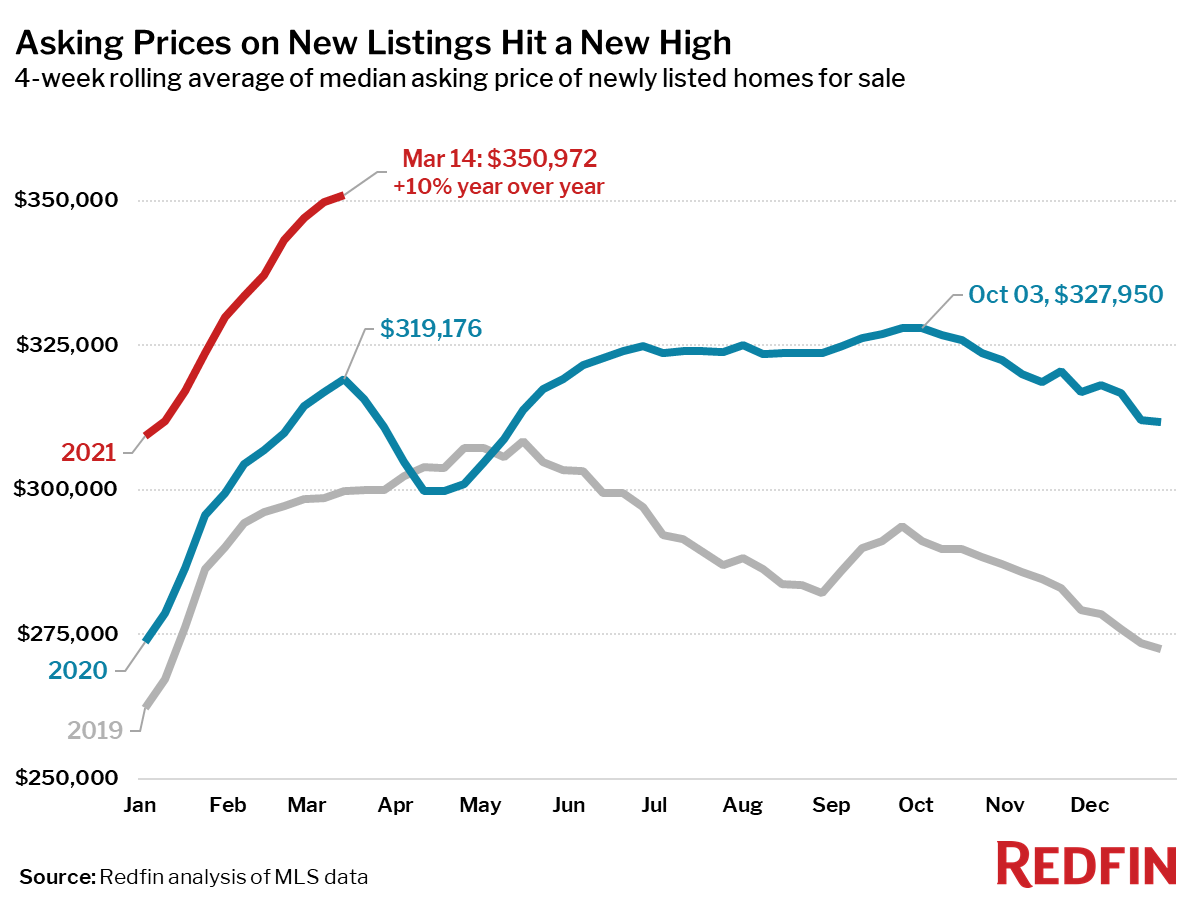
- Asking prices of newly listed homes hit a new all-time high of $350,972, up 10% from the same time a year ago.
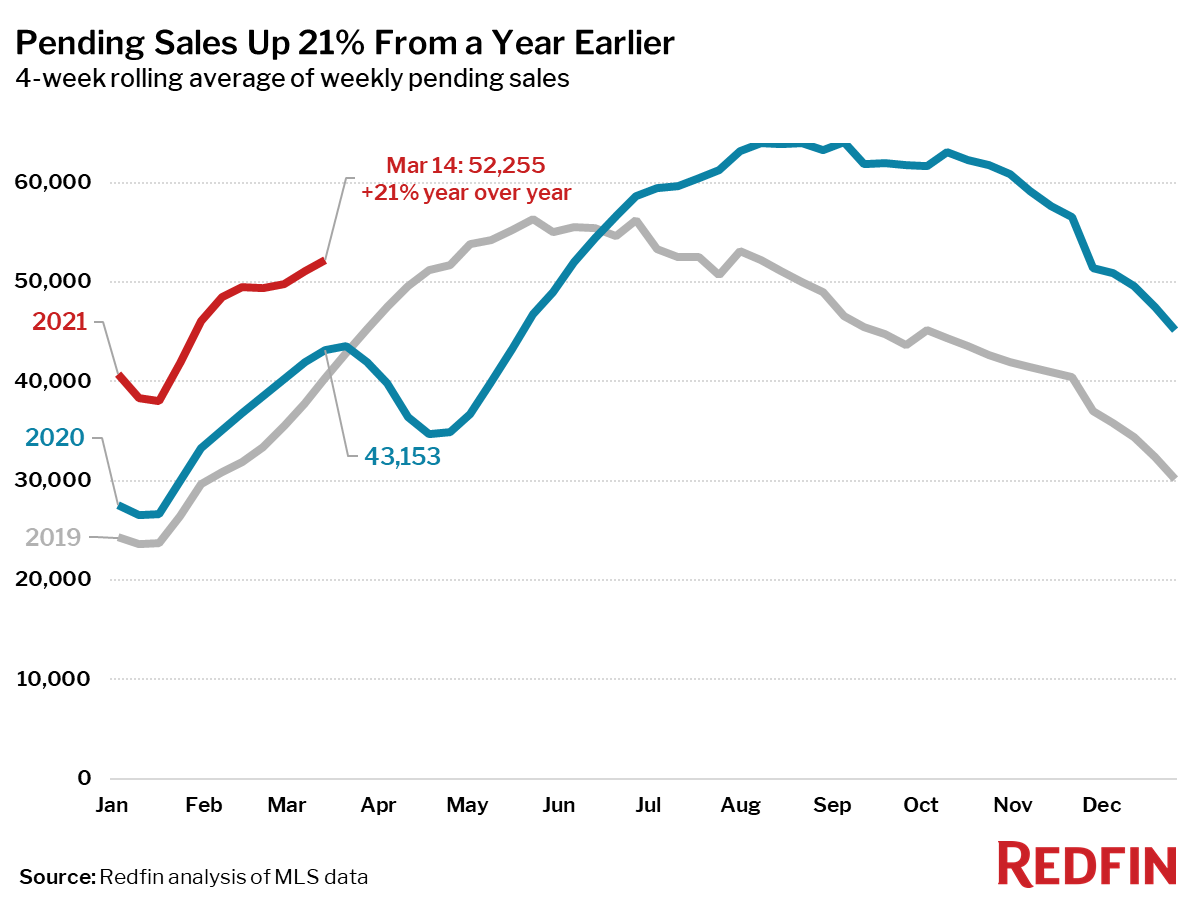
- Pending home sales were up 21% year over year, the smallest increase since August.
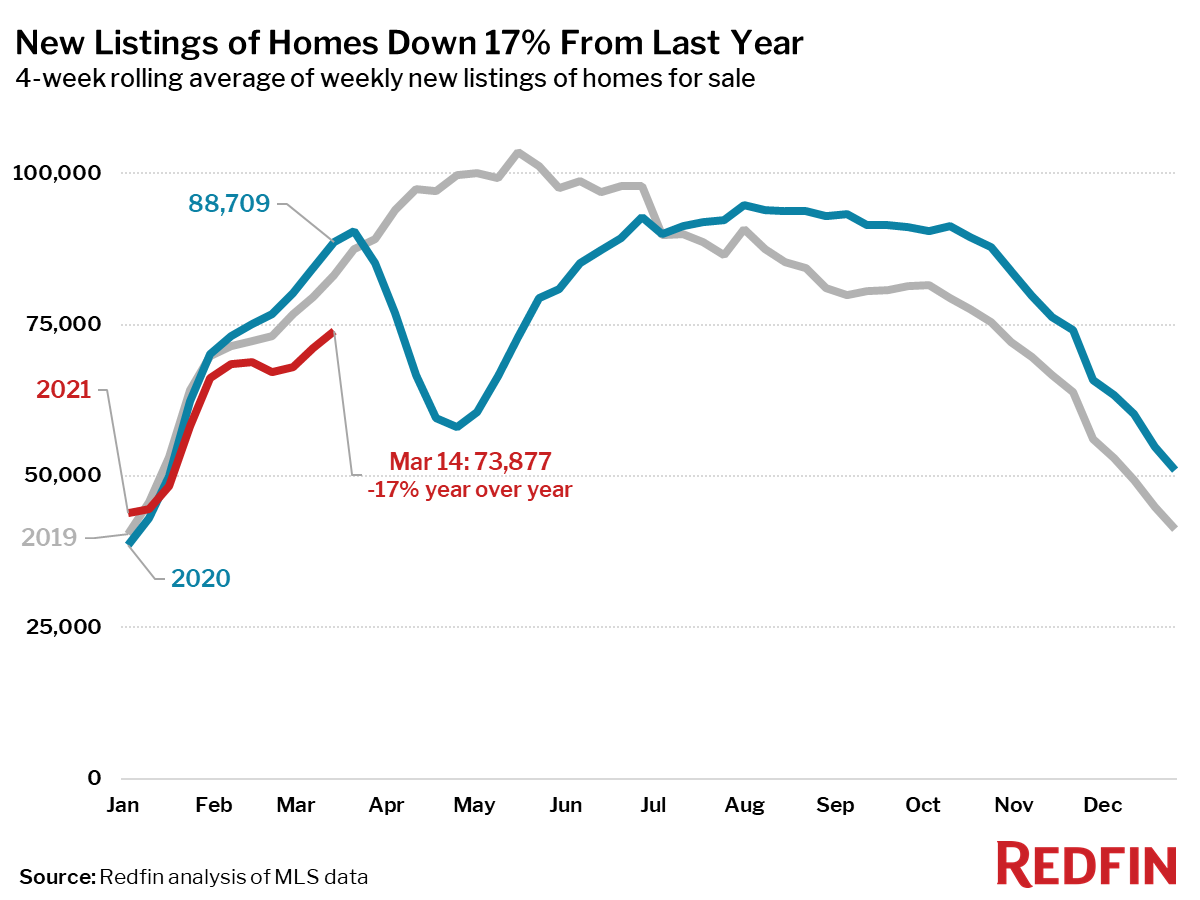
- New listings of homes for sale were down 17% from a year earlier.
- Active listings (the number of homes listed for sale at any point during the period) fell 42% from 2020 to a new all-time low. This is the largest decrease on record in this data, which goes back through 2016.
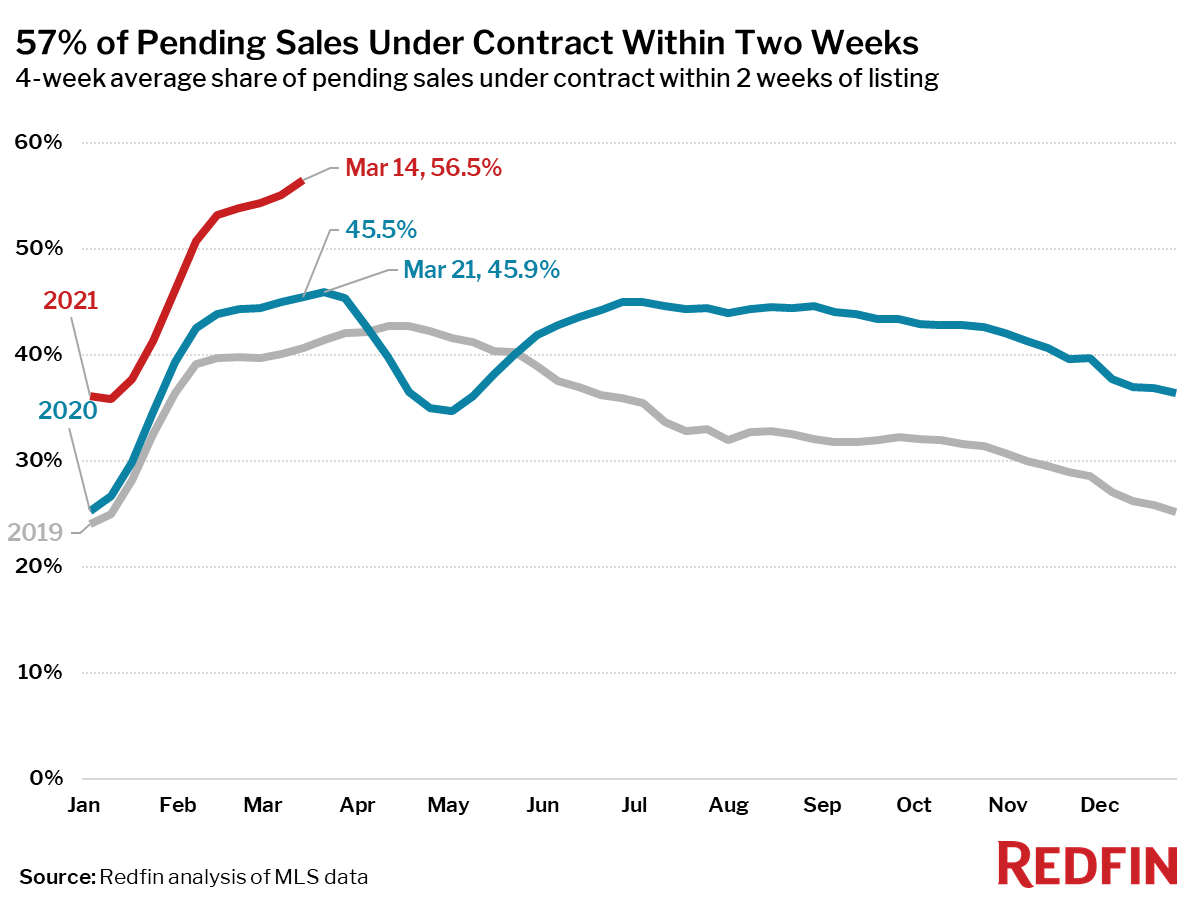
- 57% of homes that went under contract had an accepted offer within the first two weeks on the market, well above the 46% rate during the same period a year ago. This is another new all-time high for this measure since at least 2012 (as far back as Redfin’s data for this measure goes). During the 7-day period ending March 14, 61% of homes sold in two weeks or less.
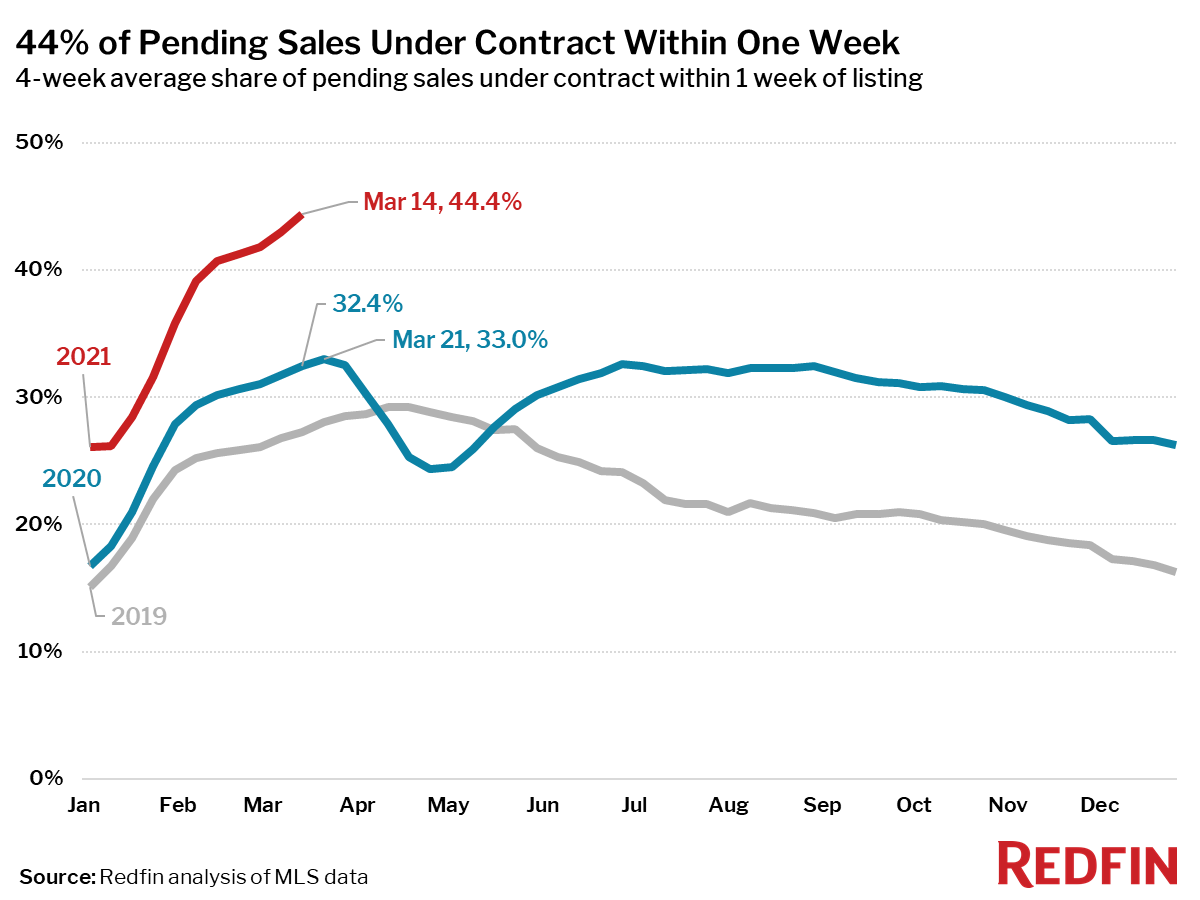
- 44% of homes that went under contract had an accepted offer within one week of hitting the market, up from 32% during the same period a year earlier. This is also an all-time high for this measure. During the 7-day period ending March 14, 48% sold in one week or less.
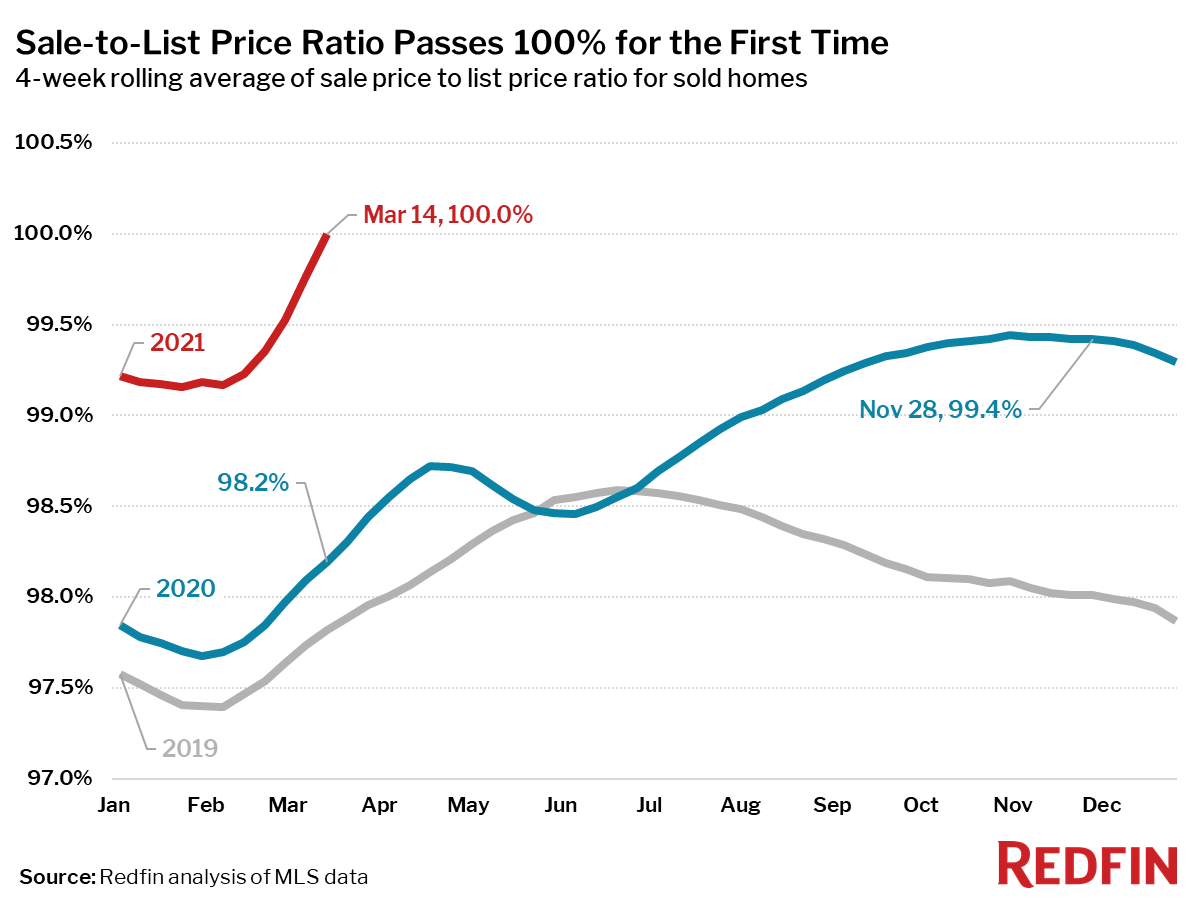
- The average sale-to-list price ratio, which measures how close homes are selling to their asking prices, increased to 100.0%—1.8 percentage points higher than a year earlier, an all-time high and the first time since this data series began in 2016 that the four-week average has exceeded 100% nationwide.
- For the 7-day period ending March 14, the seasonally adjusted Redfin Homebuyer Demand Index—a measure of requests for home tours and other services from Redfin agents—was up 85% from the same period a year ago, when the housing market was dramatically slowing down at the start of the pandemic.
- Mortgage purchase applications increased 2% week over week (seasonally adjusted) and were up 5% from a year earlier (unadjusted) during the week ending March 12. For the week ending March 18, 30-year mortgage rates increased to 3.09%, the highest level since June.
“This time last year, the housing market was shutting down as many cities implemented strict shelter in place orders. A year later the pandemic is still with us, but the housing market is red-hot. It’s so hot some buyers are acting irrationally,” said Redfin Chief Economist Daryl Fairweather. “Some people are willing to do whatever it takes to win a bidding war to the point they may be overpaying. Still, I wouldn’t call this a housing bubble because the demand for homes is truly there and the buyers can afford these high prices. Bubbles burst; I don’t see that happening. The best hope buyers have is that home prices start to grow at a slower pace, but I don’t expect prices to fall.”
Refer to our metrics definition page for explanations of all the metrics used in this report.