New listings climbed sharply and the share of listings with price drops reached a 2.5-year high as early-stage homebuyer demand declined.
Homebuyers may finally start to notice signs that the market is shifting toward their favor. More sellers came to the market during the four weeks ending May 15. New listings climbed nearly twice as fast as they did at this time last year, and the share of listings with a price drop rose to its highest level in two and a half years. Homebuyers continue to pull back in the wake of record-high purchasing costs. Mortgage purchase applications fell to their lowest level since May 2020, and the number of homebuyers touring and offering on homes, as measured by the Redfin Homebuyer Demand Index, posted its largest annual decline since April 2020. Still, desirable homes are getting scooped up at a record pace, a median 15 days on market.
“Rising mortgage rates have caused the housing market to shift, and now home sellers are in a hurry to find a buyer before demand weakens further,” said Redfin Chief Economist Daryl Fairweather. “Not only are more homes hitting the market each week, but sellers are dropping their price at rates not seen since before the pandemic. This sudden pressure on sellers is good news for those homebuyers who can still afford to buy at today’s higher mortgage rates. These trends point to an even cooler market this summer.”
Leading indicators of homebuying activity:
- Fewer people searched for “homes for sale” on Google—searches during the week ending May 14 were down 11% from a year earlier.
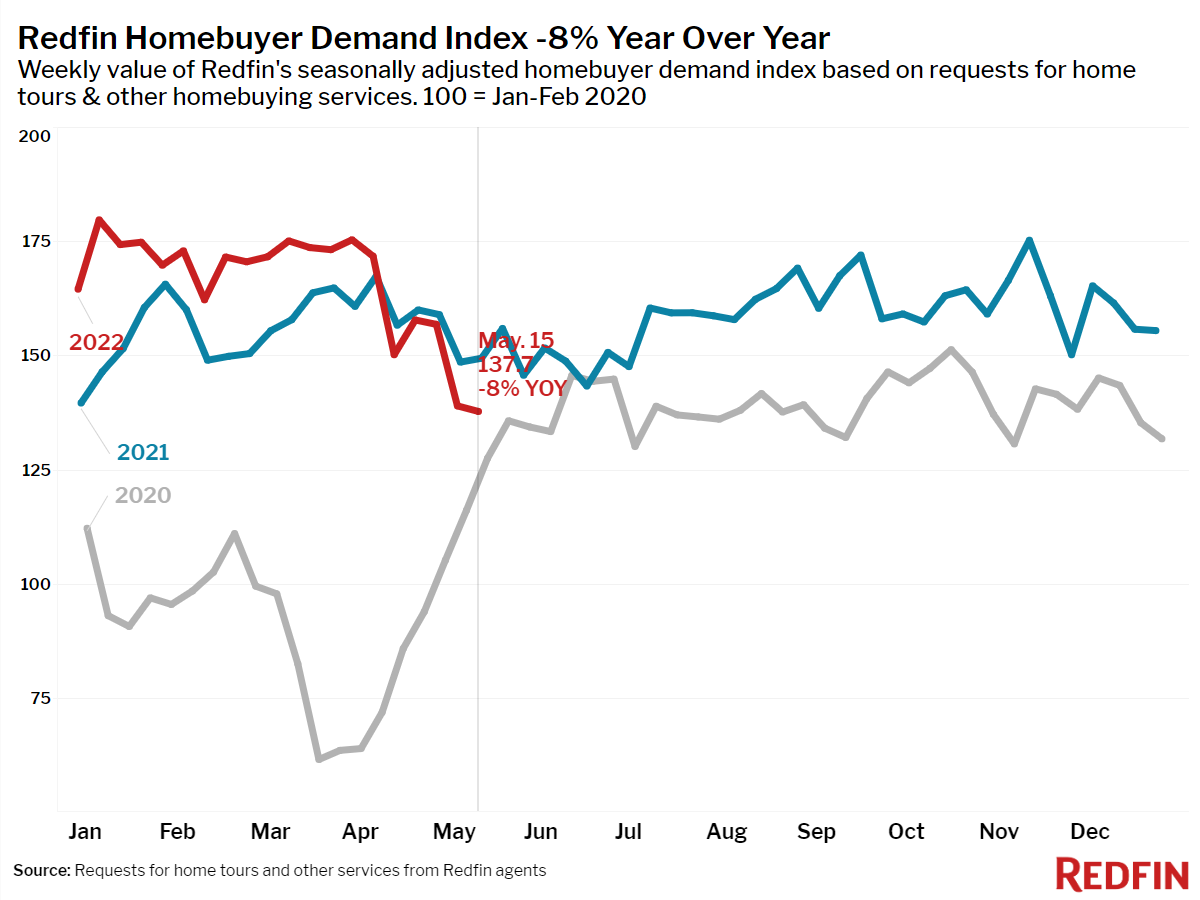
- The seasonally-adjusted Redfin Homebuyer Demand Index—a measure of requests for home tours and other home-buying services from Redfin agents—was down 8% year over year during the week ending May 15. This was the largest decline since April 2020 when the pandemic paused most homebuying activity.
- Touring activity from the first week of January through May 15 was 25 percentage points behind the same period in 2021, according to home tour technology company ShowingTime.
- Mortgage purchase applications were down 15% from a year earlier, while the seasonally-adjusted index decreased 12% week over week during the week ending May 13.
- For the week ending May 19, 30-year mortgage rates decreased slightly to 5.25%.
Key housing market takeaways for 400+ U.S. metro areas:
Unless otherwise noted, the data in this report covers the four-week period ending May 15. Redfin’s housing market data goes back through 2012.
Data based on homes listed and/or sold during the period:
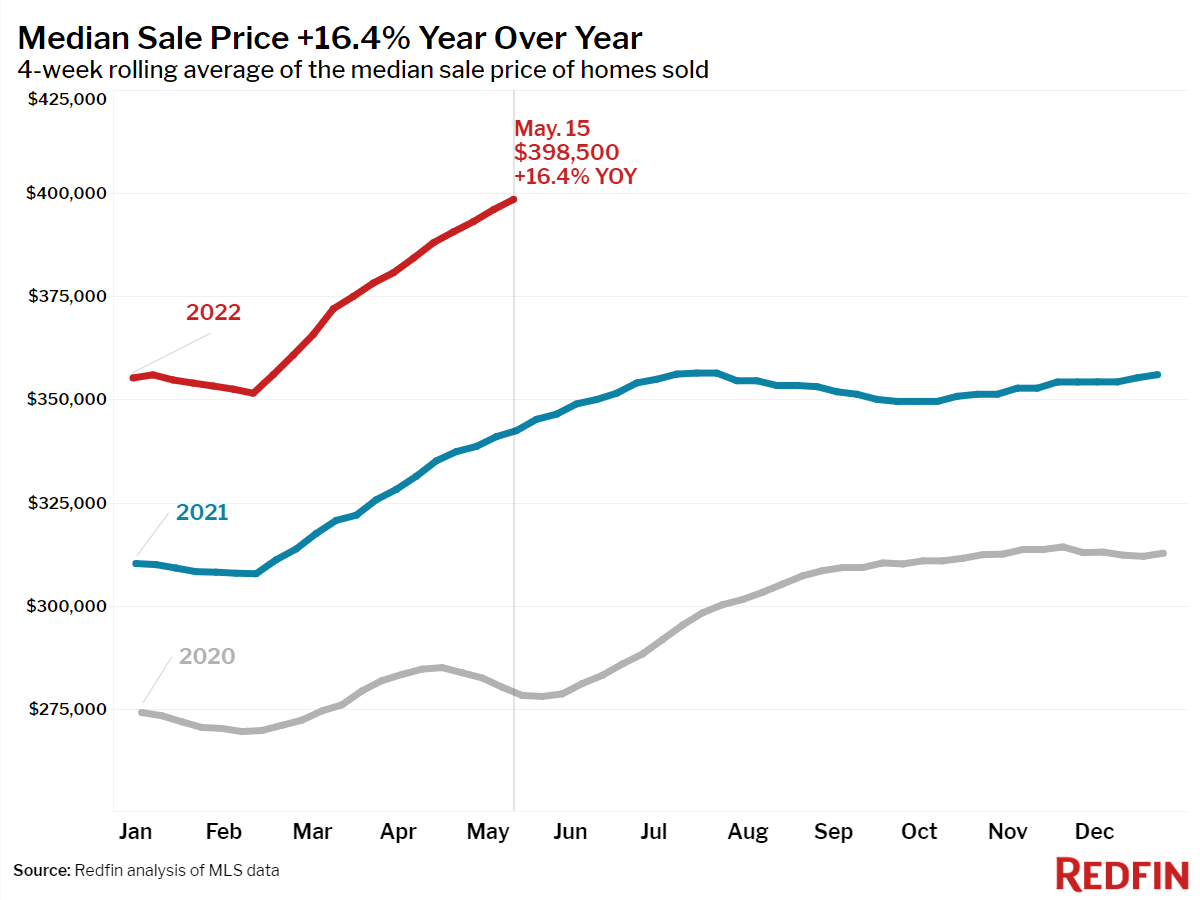
- The median home sale price was up 16% year over year to a record $398,500.
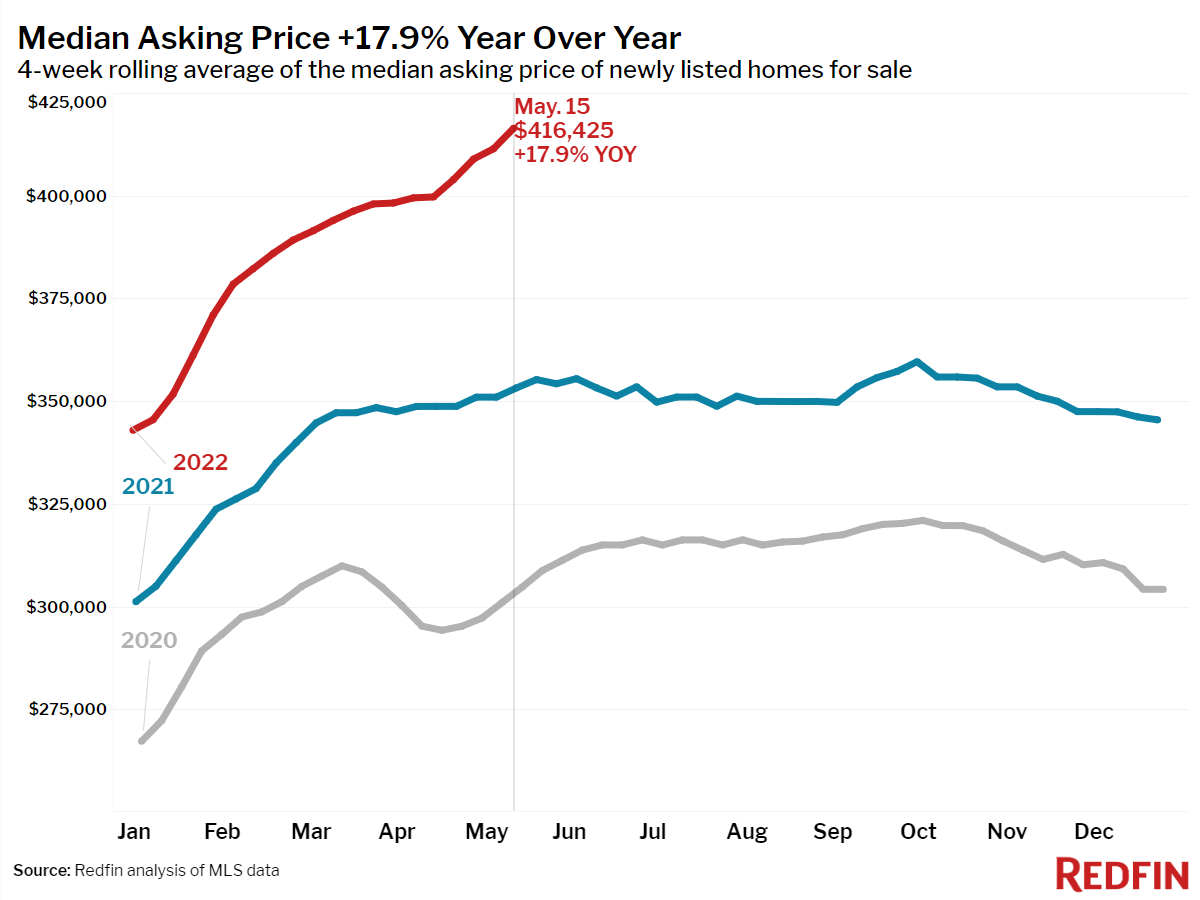
- The median asking price of newly listed homes increased 18% year over year to $416,425, a new all-time high.
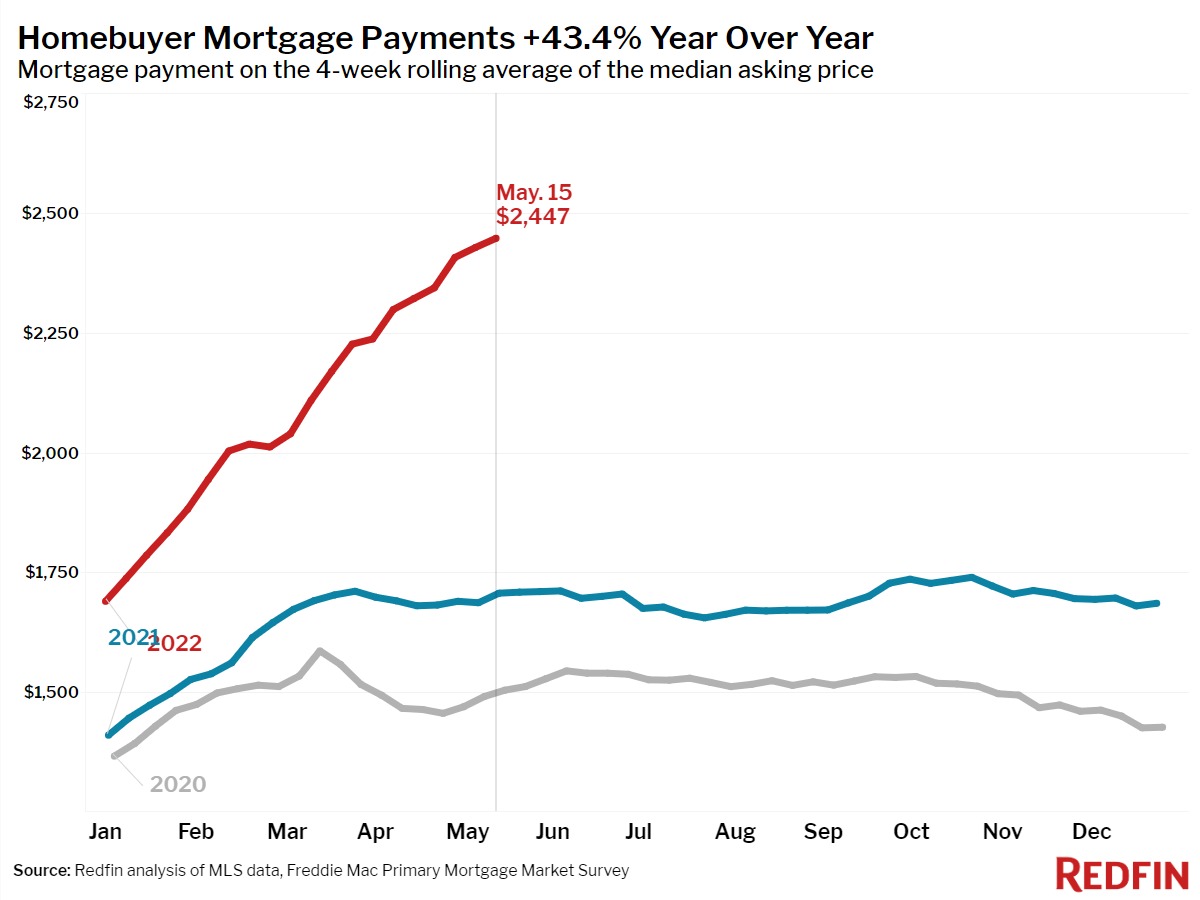
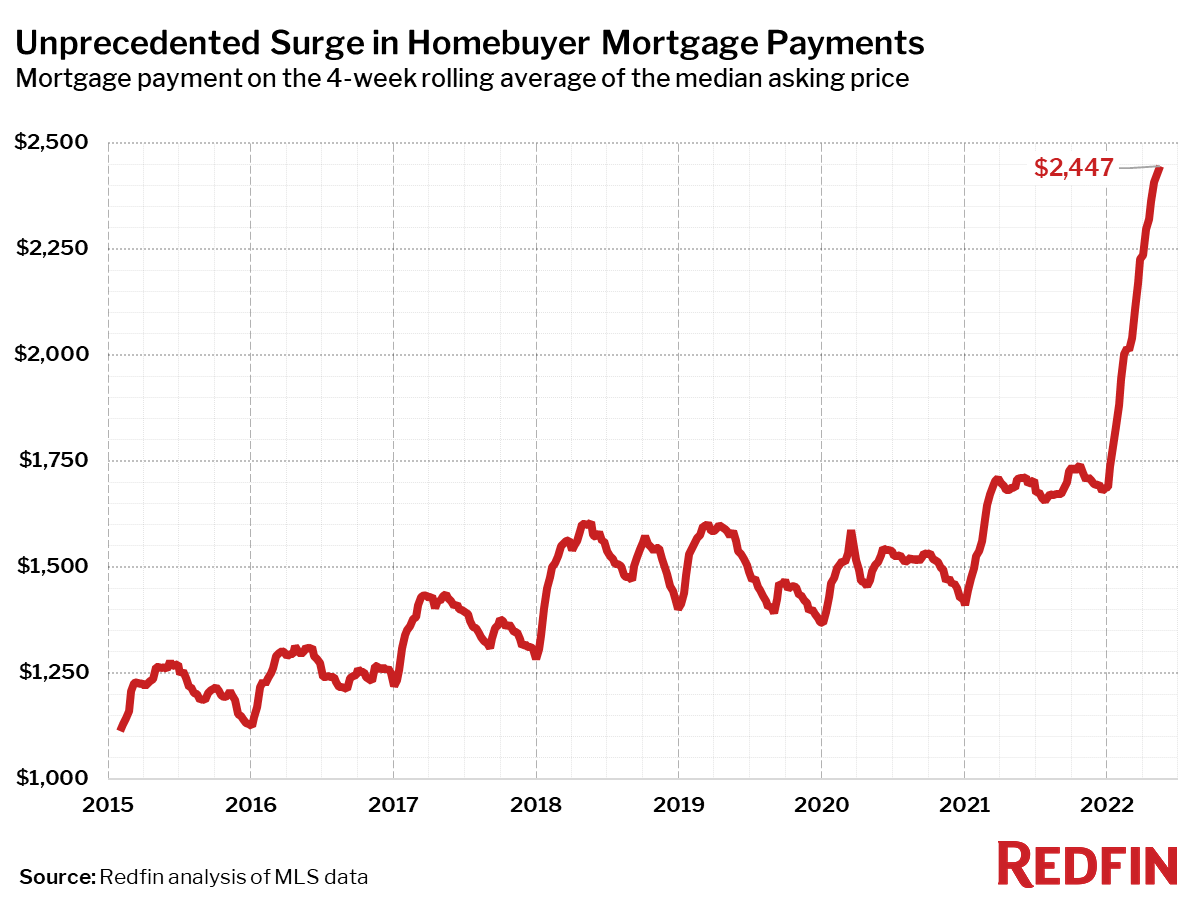
- The monthly mortgage payment on the median asking price home rose to a record high of $2,447 at the current 5.25% mortgage rate. This was up 43%—from $1,706 a year earlier, when mortgage rates were 3%.
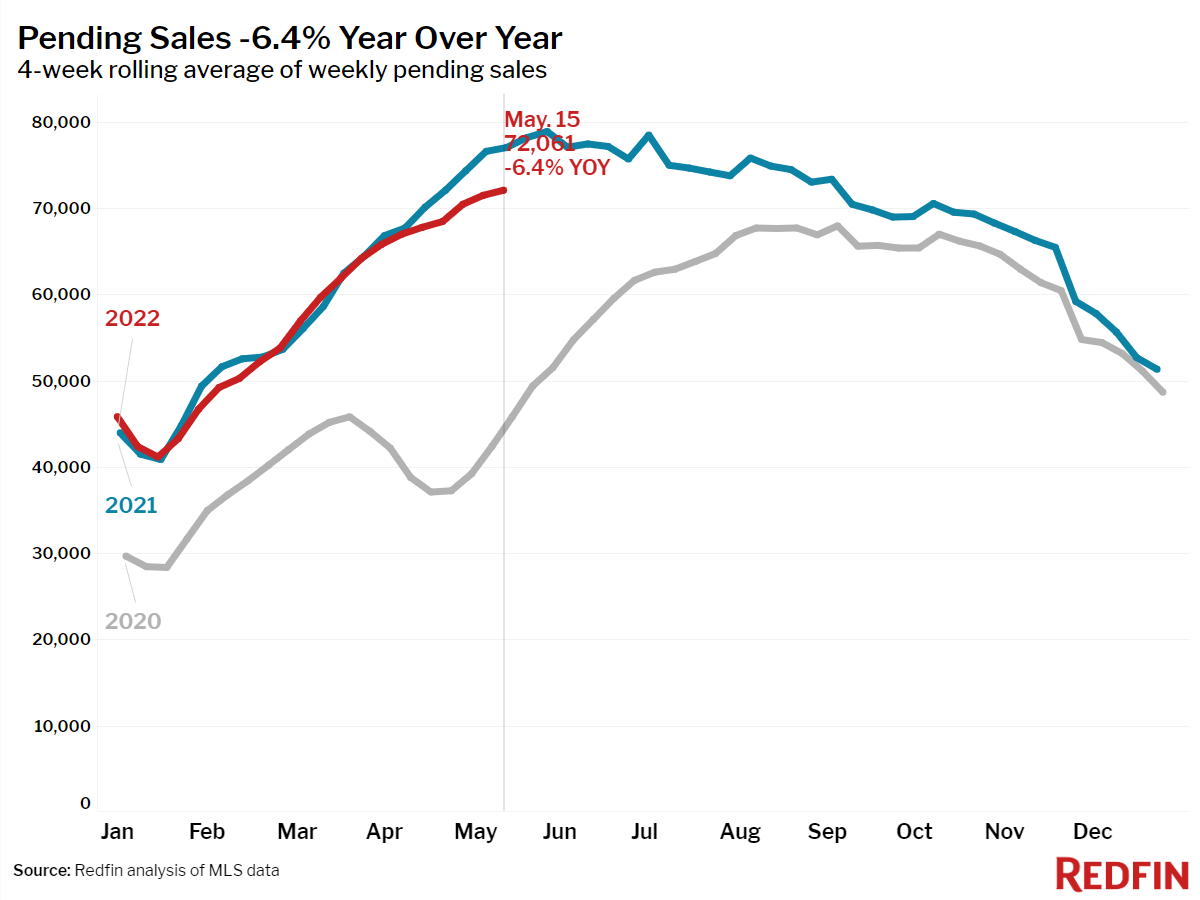
- Pending home sales were down 6% year over year.
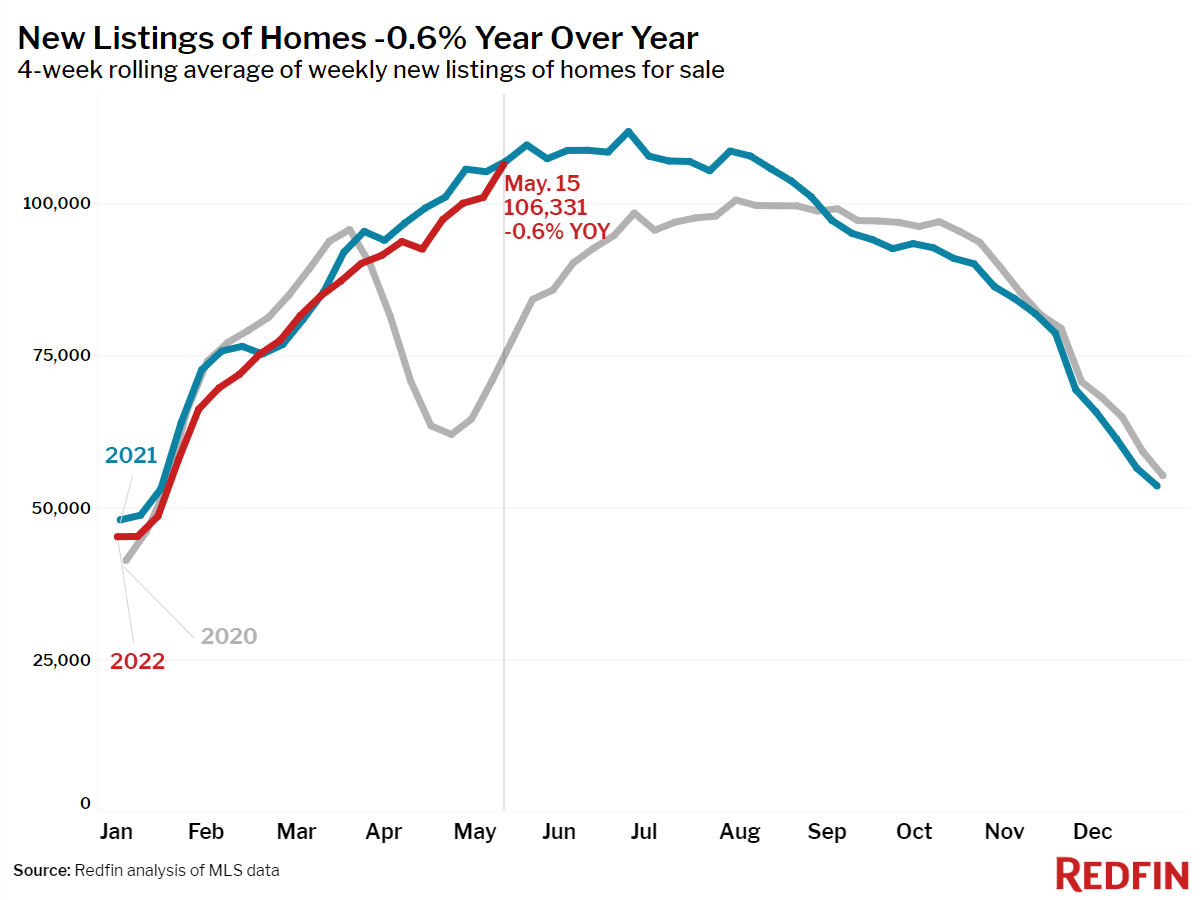
- New listings of homes for sale were down 0.6% from a year earlier, the smallest annual decline since March. New listings climbed 15% from a month earlier, compared to a 7.8% increase over the same period in 2021.
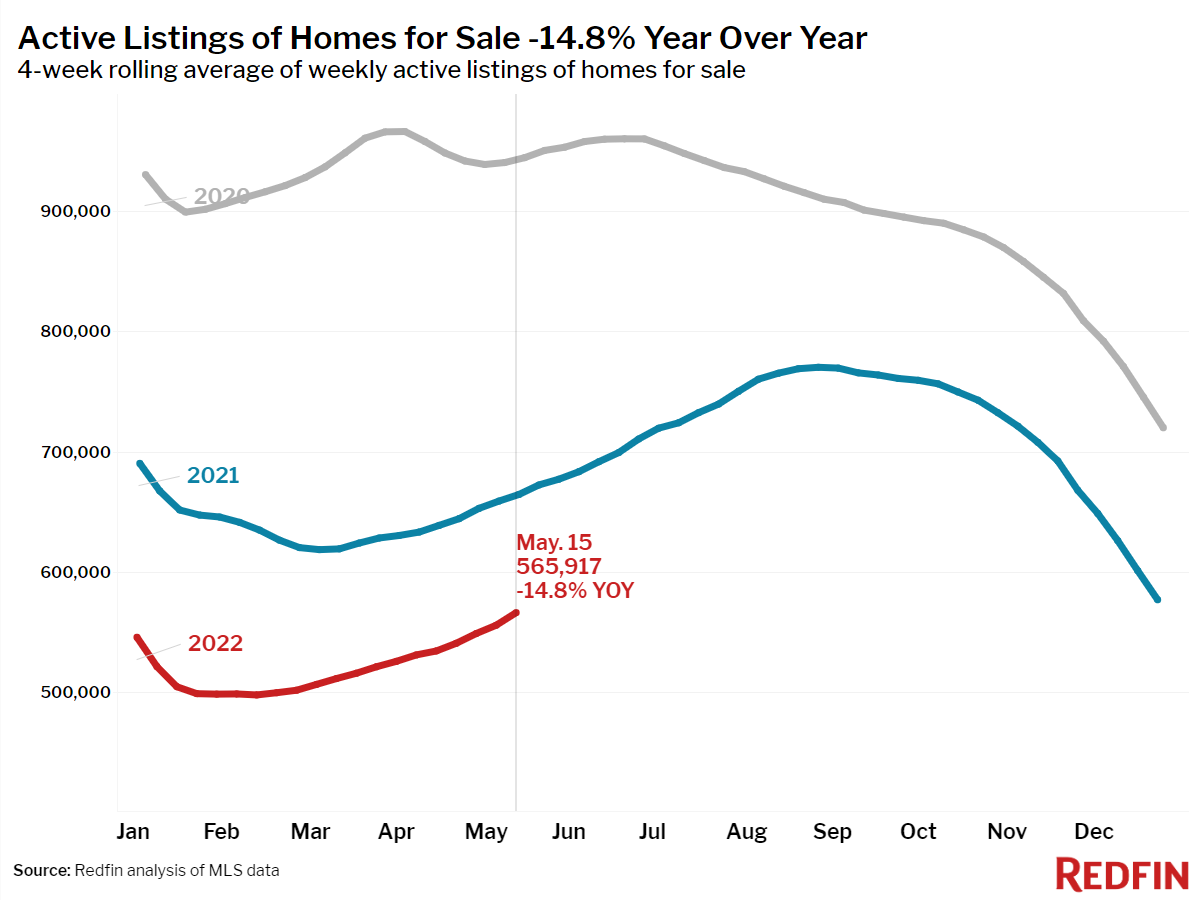
- Active listings (the number of homes listed for sale at any point during the period) fell 15% year over year.
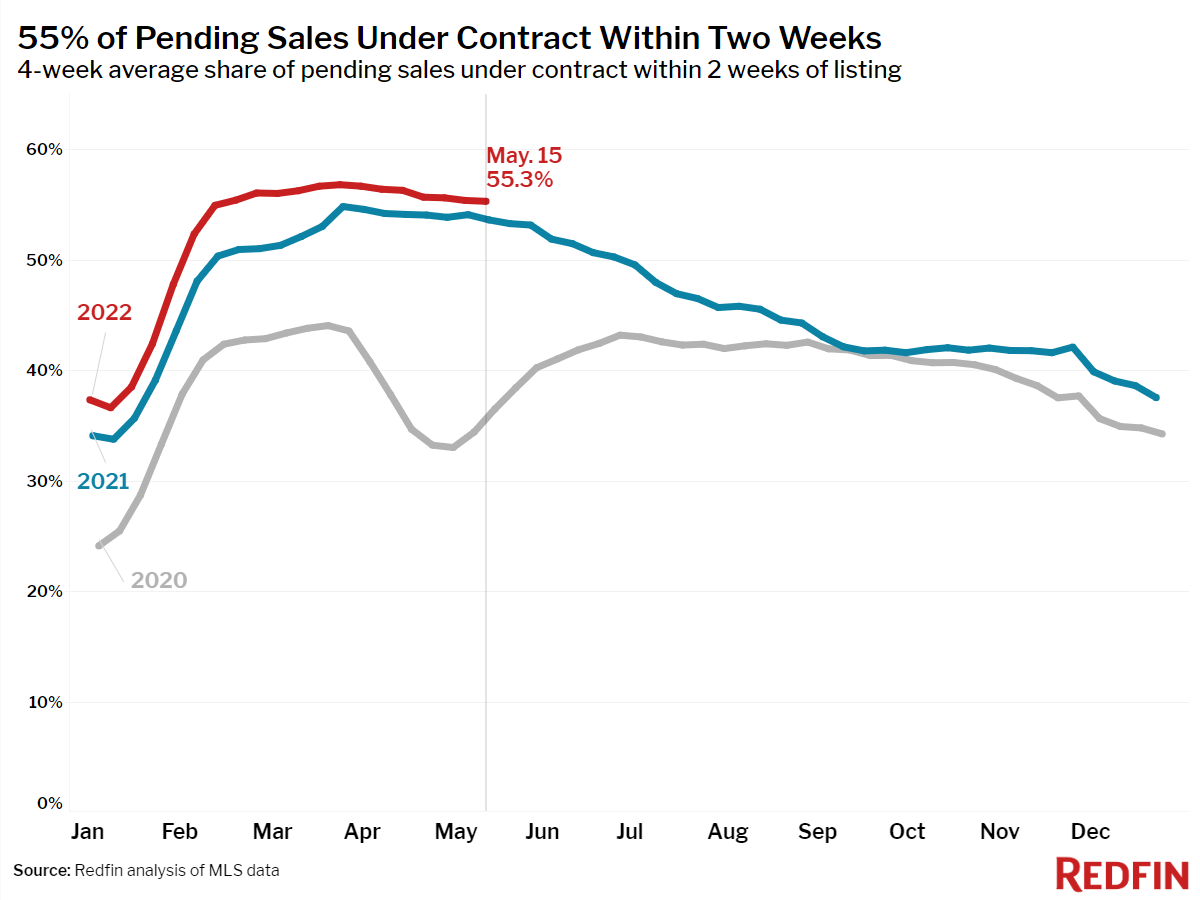
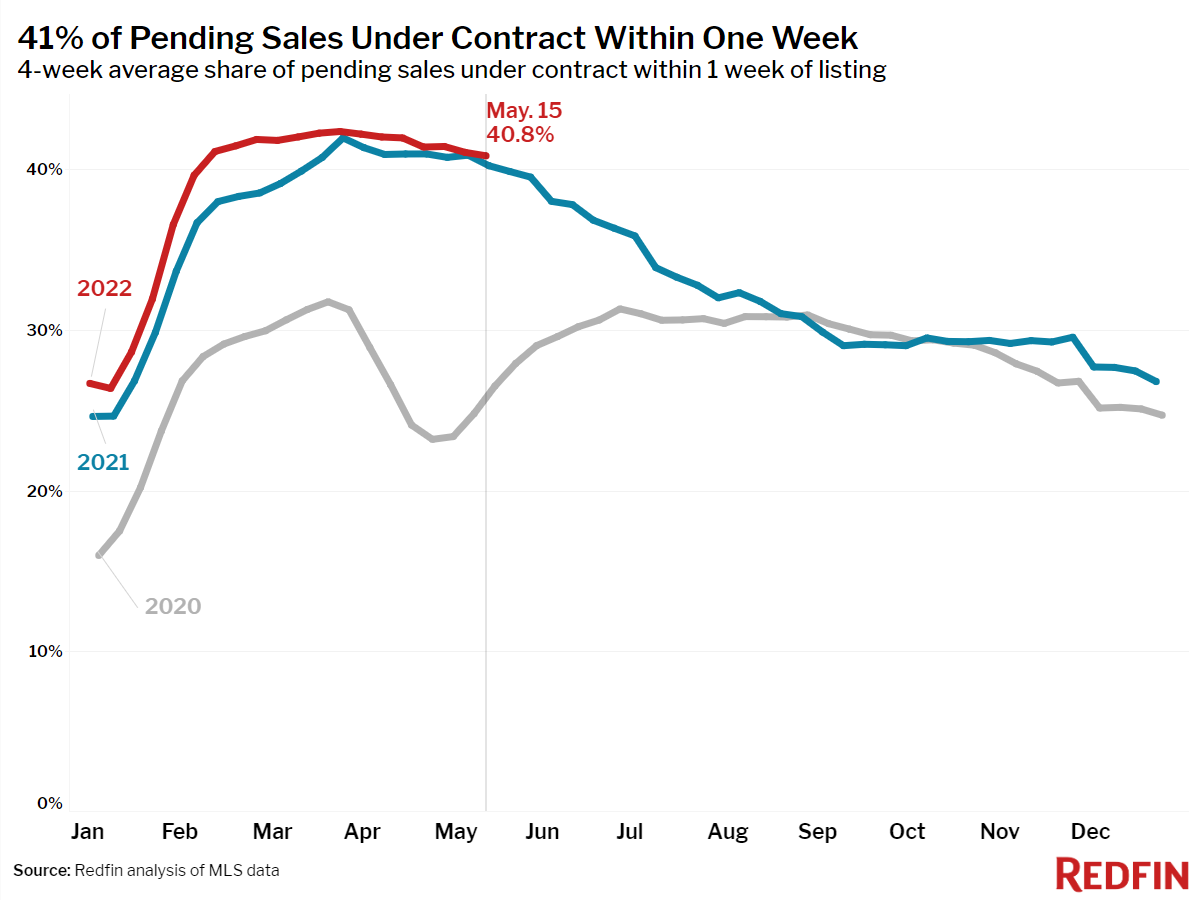
- 55% of homes that went under contract had an accepted offer within the first two weeks on the market, up from 54% a year earlier, down 1.5 percentage points from the record high during the four-week period ending March 27.
- 41% of homes that went under contract had an accepted offer within one week of hitting the market, up from 40% a year earlier, down 1.5 percentage points from the record high during the four-week period ending March 27.
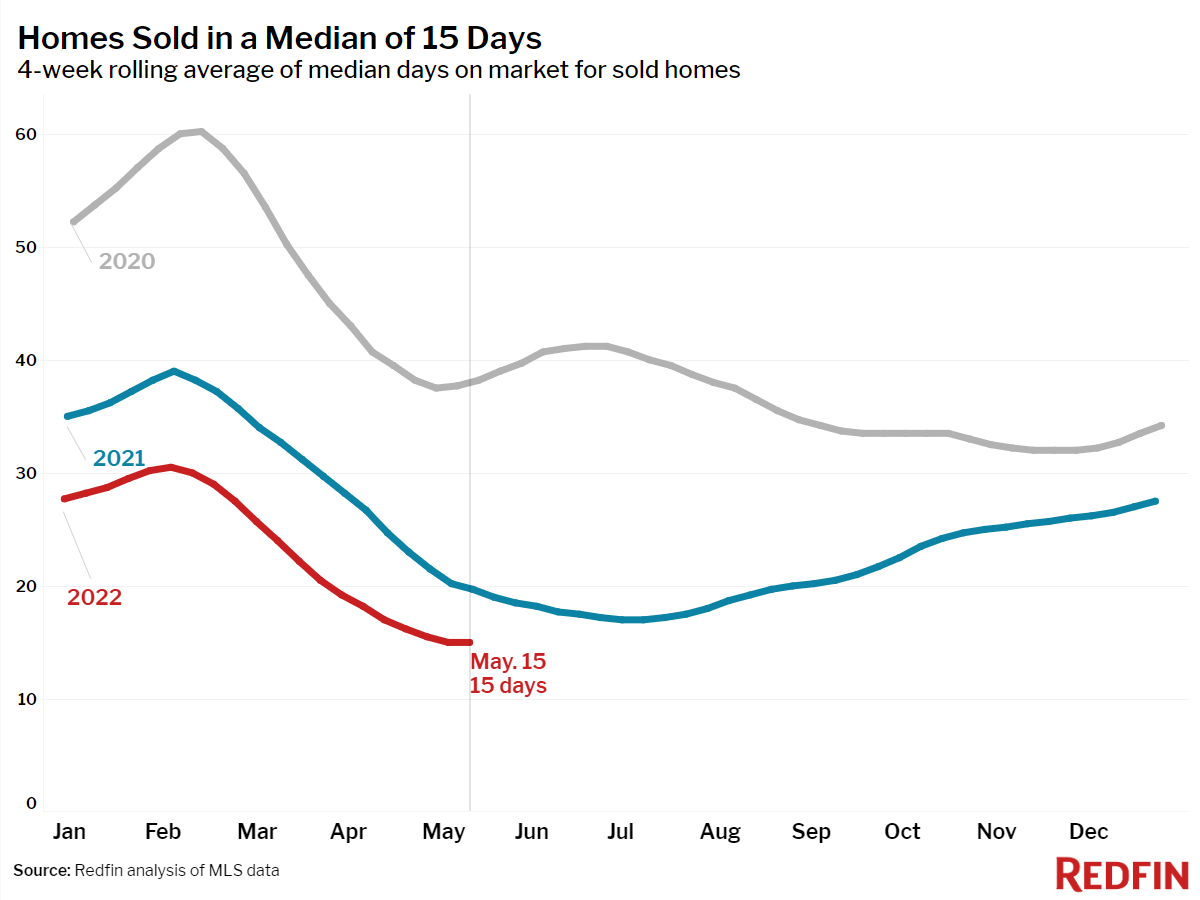
- Homes that sold were on the market for a record-low median of 15 days, down from 19.7 days a year earlier.
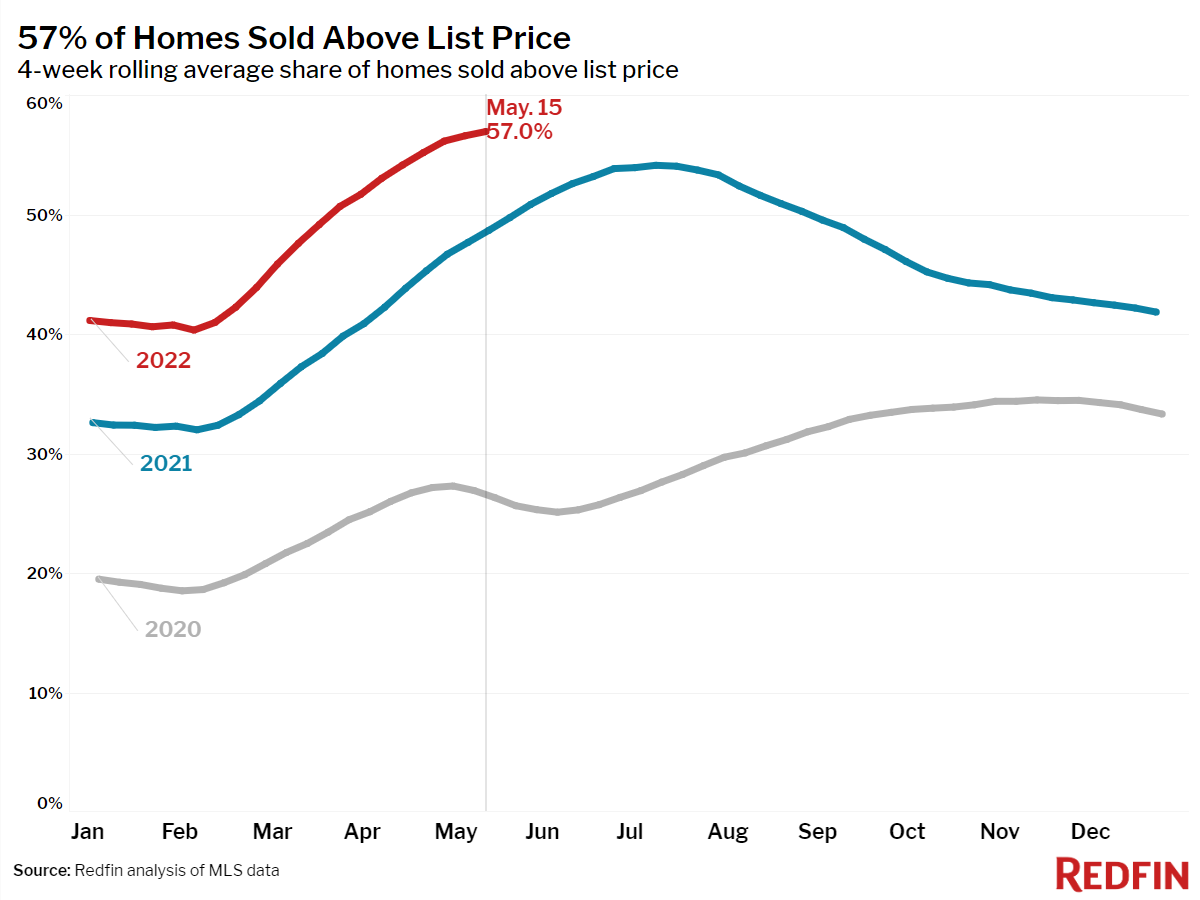
- A record 57% of homes sold above list price, up from 49% a year earlier.
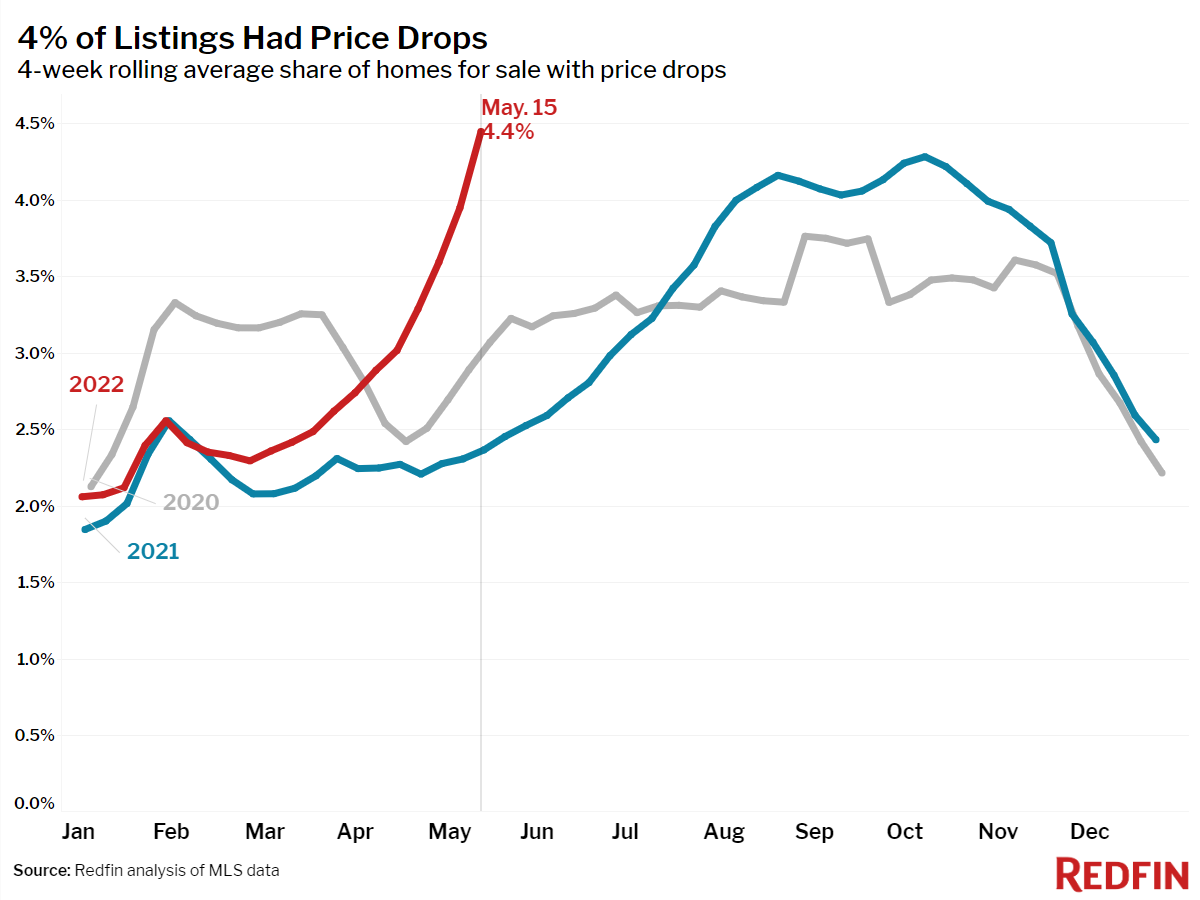
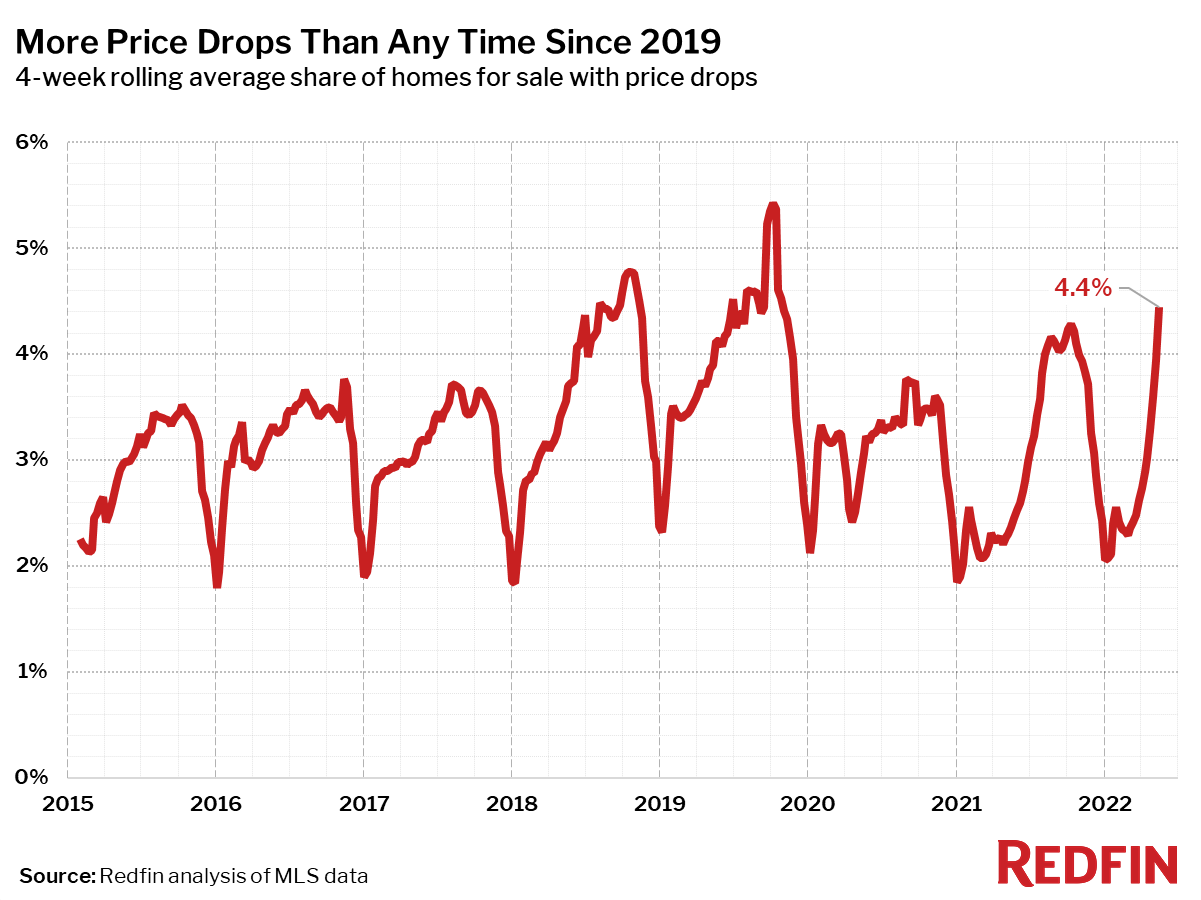
- On average, 4.4% of homes for sale each week had a price drop. Overall, 17.8% dropped their price in the past four weeks, up from 12.1% a month earlier and 9.5% a year ago. This was the highest share since October 2019.
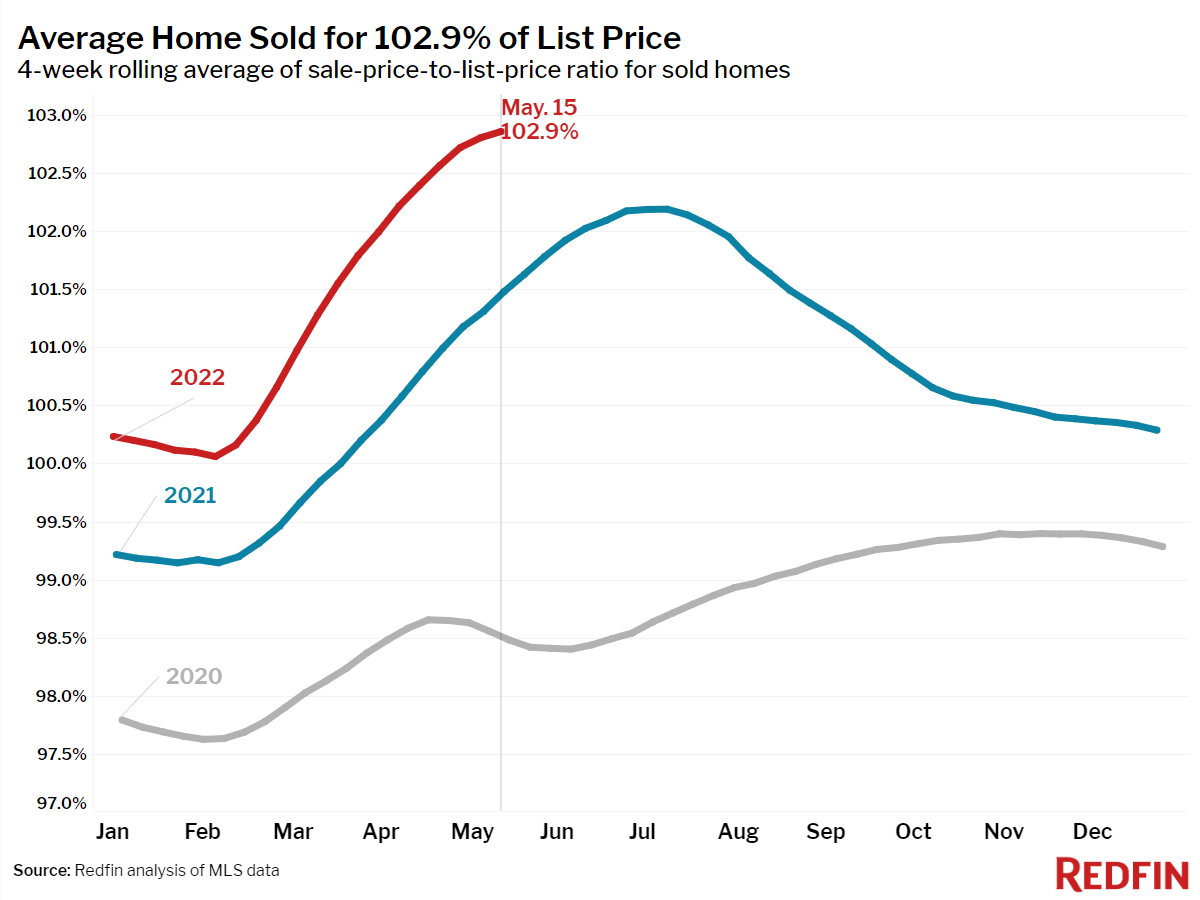
- The average sale-to-list price ratio, which measures how close homes are selling to their asking prices, rose to an all-time high of 102.9%. In other words, the average home sold for 2.9% above its asking price. This was up from 101.5% a year earlier.
Refer to our metrics definition page for explanations of all the metrics used in this report.
 United States
 Canada