
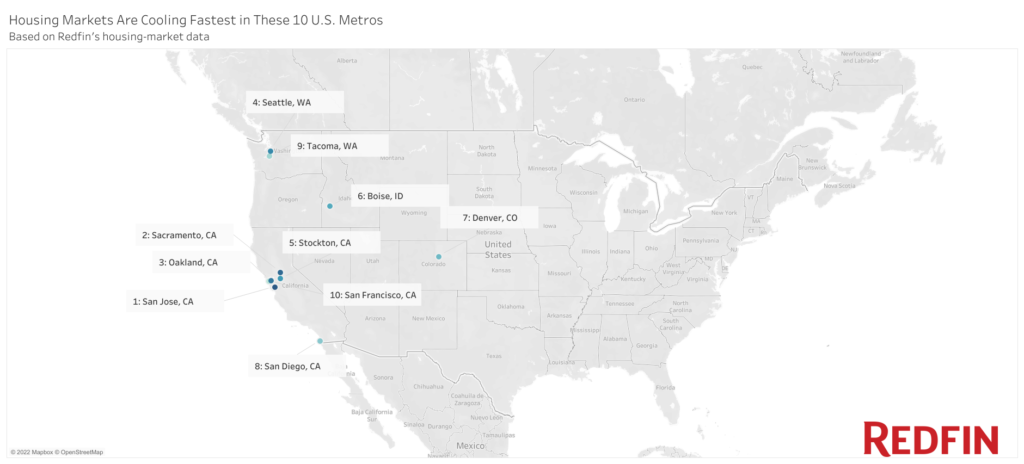
San Jose, Oakland and San Francisco are among the fastest-cooling housing markets in the U.S. as mortgage rates remain above 5% and the stock market falters, pricing many would-be buyers out of the market. The 10 markets cooling most are all in the western U.S.
Housing markets in northern California are cooling faster than anywhere else in the U.S. amid high mortgage rates and a faltering stock market.
Five of the 10 U.S. housing markets that have cooled fastest this year are in northern California–San Jose, Oakland, San Francisco, Sacramento and Stockton–and three of those five are in the Bay Area. All 10 of the housing markets cooling fastest are in the American West. The cooldown is largely because mortgage rates nearly doubled in the first half of the year, reaching nearly 6% in June. That caused the monthly mortgage payment for a typical homebuyer to surge 45% year over year to $2,459 in June and priced many buyers out of the market.
The cooldown comes after the housing market soared to new heights during the pandemic, largely fueled by record-low mortgage rates and remote work.
“The housing market has changed drastically in the last month because higher rates make homes even more expensive than they used to be. At the same time, fewer people can afford pricey homes because of the volatile stock market,” said San Francisco Redfin agent Joanna Rose. “In the early spring, every home was selling over its asking price with multiple bids. Then the number of people attending open houses dropped from 20 to two, and now some homes are sitting on the market for over a month and selling for under asking price. Supply is starting to pile up.”
This is according to a Redfin analysis of housing-market data from February 2022 to May 2022 in the 100 most populous U.S. metropolitan areas. Rankings are based on changes over that time period in year-over-year growth in prices, price drops, supply, pending sales, sale-to-list ratio and speed of home sales.
Northern California’s housing market is cooling faster than anywhere else in the country
San Jose is cooling at the fastest clip, with measures of homebuyer demand and competition dropping off quicker than any other major metro this year. The supply of homes for sale in San Jose was up 10% year over year in May–but just three months earlier in February, supply was down 43%, indicating that buyers are now gobbling up fewer homes. And the share of homes that went off the market in two weeks was down 5% year over year in May, a big swing from the 22% year-over-year increase in February–that’s an indicator that homes are selling slower.
After San Jose, Sacramento is cooling fastest, followed by Oakland. Stockton, CA, located about 50 miles south of Sacramento, comes in at number five, and San Francisco is number 10.
The Bay Area is cooling quickly due to high mortgage rates, which hit pocketbooks harder in pricey areas, and the slumping stock market, a factor that’s particularly impactful in tech hubs where a lot of residents are compensated with equity. Sky-high home prices are another factor pricing many would-be buyers out of the market. San Jose, Oakland and San Francisco are the most expensive metros in the U.S., with the typical home selling for over $1 million and many selling for well over $1.5 million.
In dollar terms, mortgage rates reaching nearly 6% in the spring had a particularly big impact in pricey areas like Northern California. The typical monthly mortgage payment on a million-dollar home is roughly $5,750 with a 6% interest rate, $1,400 higher than it would be with a 3% interest rate (assuming a 20% down payment). The increase is half as big with a home priced close to the national median: The typical monthly payment on a $450,000 home is about $2,600 with a 6% rate, about $700 higher than with a 3% rate.
“Would-be buyers are shying away because they simply have less money, both for down payments and monthly payments,” Rose said. “More than half the buyers I see in San Francisco are tech workers, and many of them have seen their employers’ stock prices tumble over the past few months–in a lot of cases, that has cost people six figures. Then there’s inflation: People are paying way more for things like groceries and gas, so they don’t have as much in their monthly budget. On top of that, monthly payments are a lot higher than they used to be, even if prices are slightly down, because of increased rates.”
“But there is good news for some buyers. People who can afford to buy right now could get something for $100,000 or $200,000 less than a few months ago, largely because homes are often no longer selling above asking price,” Rose continued. “They’ll have a higher monthly payment for now due to the rise in mortgage rates, but can refinance later if rates come down.”
Pricey coastal markets including San Francisco were the first to see signs of a slowdown when mortgage rates started rising. There were fewer people in San Francisco starting online home searches, contacting real estate agents and applying for mortgages in early spring than a year earlier.
Even if the Bay Area slowdown leads to declining home prices, it’s likely to remain among the most expensive parts of the country, partly because it’s significantly more expensive than almost anywhere else in the U.S. and partly because other metros are cooling, too. Plus, higher mortgage rates means buyers are still paying top dollar.
Sacramento, located about 90 miles away from San Francisco, is also one of the fastest-cooling markets. That marks a reversal from the height of the pandemic, when it attracted scores of remote workers moving in from the Bay Area and other expensive parts of the country. But partly because of its popularity, home prices soared 44% throughout the pandemic, reaching a median of $610,000 in May 2022 and pricing many buyers out of the market.
Pandemic boomtowns like Boise and Austin are also cooling quickly
Seattle (#4), Boise, ID (#6), Denver (#7), San Diego (#8) and Tacoma, WA (#9) round out the list of the 10 housing markets that have cooled fastest this year. Cape Coral, FL, Las Vegas, Austin, Phoenix and North Port, FL–all popular migration destinations during the pandemic–are among the top 20 markets cooling fastest.
Sacramento, Boise, Tacoma, Austin and Phoenix were all pandemic boomtowns. They attracted scores of remote workers moving in from coastal California, Seattle and other pricey job centers in search of affordability, spacious homes and a slower-paced lifestyle.
The influx of out-of-towners, along with a limited supply of homes for sale, caused home prices in those places to rise rapidly, sending them from affordable to not-so-affordable. Boise home prices increased 53% from May 2020 to May 2022, reaching a median of $550,000, and Tacoma prices increased 47% to $575,000. Higher home prices, the pandemic tapering off and some workers returning to the office are causing their popularity to wane.
U.S. Housing Markets Cooling Fastest, May 2022
Housing-market data in the table below is from May 2022
The rankings in this report are based on changes in these housing-market stats from February 2022 to May 2022
| Rank | U.S. Metro Area | Median sale price | Change in PPSF, YoY | Change in inventory, YoY | Change in Price Drops, YoY | Change in Pending Sales, YoY | Change in sale-to-list ratio, YoY | Change in share of homes off market in two weeks, YoY |
|---|---|---|---|---|---|---|---|---|
| 1 | San Jose, CA | $1,560,000 | 17.8% | 10.3% | 9.2% | -21.4% | 3.1% | -4.8% |
| 2 | Sacramento, CA | $610,000 | 15.0% | 38.9% | 23.8% | -15.4% | -1.3% | -10.6% |
| 3 | Oakland, CA | $1,070,000 | 11.1% | 42.9% | 11.8% | -16.0% | -0.3% | -13.9% |
| 4 | Seattle, WA | $850,000 | 19.6% | 40.9% | 14.0% | -13.7% | -0.6% | -4.7% |
| 5 | Stockton, CA | $576,000 | 15.3% | 57.8% | 19.4% | -3.9% | -2.0% | -17.3% |
| 6 | Boise, ID | $550,000 | 15.5% | -15.9% | 41.0% | -39.2% | -1.7% | -18.0% |
| 7 | Denver, CO | $612,000 | 16.8% | 47.0% | 20.0% | -3.5% | 0.0% | -5.7% |
| 8 | San Diego, CA | $875,000 | 22.5% | -3.7% | 16.7% | -16.1% | 0.8% | -7.4% |
| 9 | Tacoma, WA | $575,000 | 14.0% | 51.5% | 16.4% | -8.3% | -1.5% | -7.2% |
| 10 | San Francisco, CA | $1,620,000 | 6.5% | -5.0% | 8.2% | -13.7% | 2.5% | -5.3% |
| 11 | Cape Coral, FL | $418,000 | 37.3% | 30.4% | 18.1% | -16.9% | 0.9% | -7.7% |
| 12 | Las Vegas, NV | $450,000 | 28.0% | 15.7% | 13.3% | -12.0% | 0.4% | -7.3% |
| 13 | Knoxville, TN | $340,000 | 25.8% | -14.5% | 9.1% | -10.0% | 1.1% | -9.7% |
| 14 | Portland, OR | $571,000 | 16.1% | 16.4% | 15.0% | -13.2% | 0.2% | -3.6% |
| 15 | Riverside, CA | $575,000 | 21.6% | 9.6% | 17.3% | -4.5% | -0.1% | -5.6% |
| 16 | Austin, TX | $556,000 | 21.5% | 31.8% | 15.7% | -6.6% | -3.7% | -3.9% |
| 17 | Phoenix, AZ | $485,600 | 25.0% | 26.5% | 17.0% | -7.6% | -0.5% | -4.1% |
| 18 | North Port, FL | $475,000 | 36.2% | 46.9% | 12.9% | -3.7% | 1.6% | -5.6% |
| 19 | Honolulu, HI | $705,000 | 14.7% | -10.8% | 5.5% | -15.5% | 1.0% | -16.1% |
| 20 | Anaheim, CA | $1,060,000 | 24.9% | -19.3% | 15.3% | -11.2% | 1.8% | 2.3% |
Affordable Northeast and Midwest metros are cooling slowest
Albany, NY has cooled slower than any other metro this year, with measures of homebuyer demand and competition just slightly weaker in May than in February. The supply of homes for sale in Albany was down 19% year over year in May, compared with a 23% dip in February. And the share of homes that went off the market in two weeks was up about 2% year over year in May, compared with a 3% year-over-year uptick in February.
It’s followed by El Paso, TX, Bridgeport, CT, Lake County, IL and Rochester, NY. New Brunswick, NJ, Cincinnati, OH, Akron, OH, New Haven, CT and Virginia Beach, VA round out the top 10 markets that are cooling slowest. No market is heating up.
The 10 metros cooling the slowest are almost all located in the Northeast or the Midwest and they’re all relatively affordable. Eight of them have a median sale price below the national level of $431,000. The two exceptions–Bridgeport and New Brunswick–both have median sale prices below $575,000.
With high home prices and mortgage rates pushing many buyers out of the housing market, affordable areas aren’t softening as quickly as expensive places. Homebuyers can get more for their money in affordable parts of their country, and higher mortgage rates have a smaller dollar impact where home prices are substantially lower. Additionally, many of the metros cooling slowest don’t have as much room to fall because they weren’t pandemic hotspots.
U.S. Metros Cooling Slowest, May 2022
Housing-market data in the table below is from May 2022
The rankings in this report are based on changes in these housing-market stats from February 2022 to May 2022
| Rank | U.S. Metro Area | Median sale price | Change in PPSF, YoY | Change in inventory, YoY | Change in Price Drops, YoY | Change in Pending Sales, YoY | Change in sale-to-list ratio, YoY | Change in share of homes off market in two weeks, YoY |
|---|---|---|---|---|---|---|---|---|
| 1 | Albany, NY | $289,000 | 23.3% | -19.2% | 5.4% | -1.1% | 2.5% | 1.9% |
| 2 | El Paso, TX | $238,000 | 19.9% | -24.4% | 4.1% | 5.0% | 1.3% | 3.9% |
| 3 | Bridgeport, CT | $570,000 | 8.9% | -35.4% | 1.9% | -16.3% | 3.1% | 14.2% |
| 4 | Lake County, IL | $324,400 | 14.7% | 32.1% | -5.7% | -26.0% | 1.5% | -46.3% |
| 5 | Rochester, NY | $212,100 | 13.5% | -8.6% | 4.9% | 4.5% | 4.2% | 1.9% |
| 6 | New Brunswick, NJ | $465,000 | 15.0% | 11.8% | 1.8% | -5.7% | 2.2% | -7.1% |
| 7 | Cincinnati, OH | $265,000 | 13.8% | -13.5% | 3.8% | 1.4% | 1.6% | -2.3% |
| 8 | Akron, OH | $200,000 | 13.8% | -23.5% | 6.9% | 12.1% | 1.1% | 8.2% |
| 9 | New Haven, CT | $310,000 | 12.3% | -31.7% | 3.9% | -3.3% | 1.5% | 13.0% |
| 10 | Virginia Beach, VA | $325,000 | 14.0% | -30.3% | 12.3% | 7.3% | 1.0% | 8.6% |
Methodology
The rankings in this report are from a Redfin analysis of the U.S. metros with housing markets that cooled down fastest from February 2022 to May 2022. The ranking is based on year-over-year changes in prices, price drops, supply, pending sales, sale-to-list ratio and the share of homes that went off market in two weeks from February to May. The analysis compares May to February because in many U.S. metros, that’s when the housing market reached a peak in terms of demand and competition while the number of homes for sale was at a low. To be included in this report, a metro must have been among the 100 most populous in the U.S. and had data available for all six variables included in the analysis.


