
Still, homes sold at their fastest pace and for their highest prices on record.
Note: Pandemic lockdowns significantly slowed homebuying and selling, and slightly depressed sale prices in June 2020, which means the year-over-year trends for home prices, pending sales, closed sales and new listings are exaggerated. For more context, we have added extra charts that better highlight recent changes.
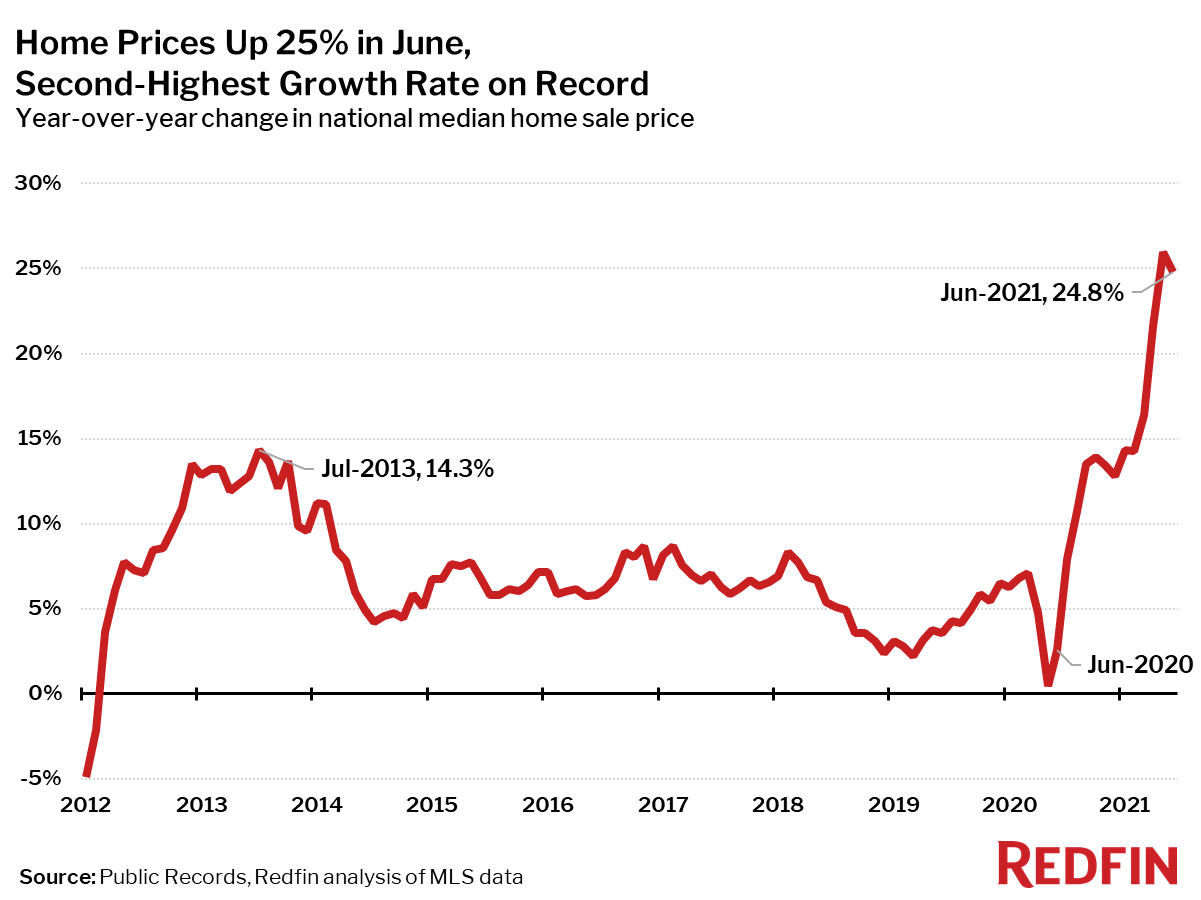
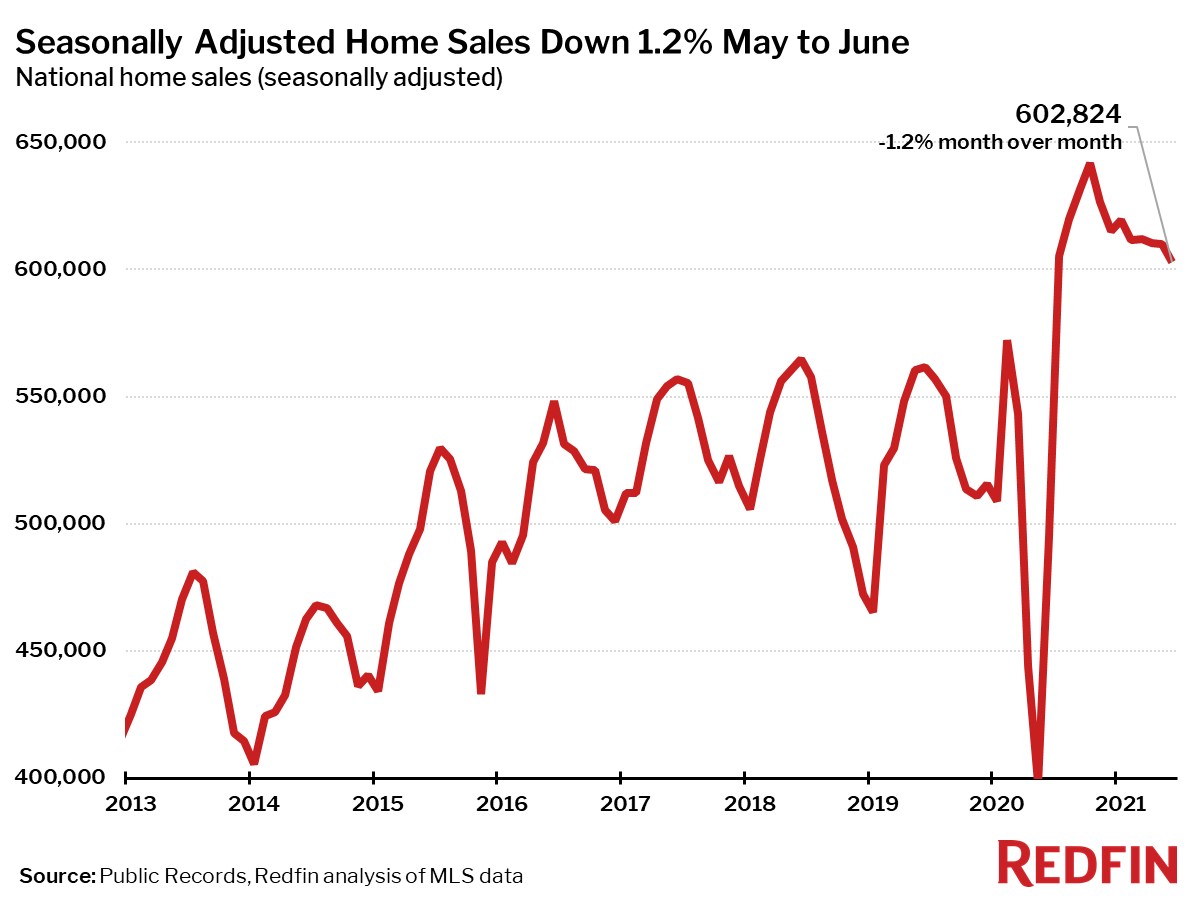
Seasonally-adjusted home sales fell 1.2% from May to June, the largest drop at this time of year on record through at least 2012, suggesting that the housing market frenzy may have peaked for the year. Homes sold for their highest prices and at their fastest pace on record, but measures for market speed and competition seem to be at or near peak levels for this year.
The following measures all hit new records in June according to Redfin’s data, which goes back through 2012:
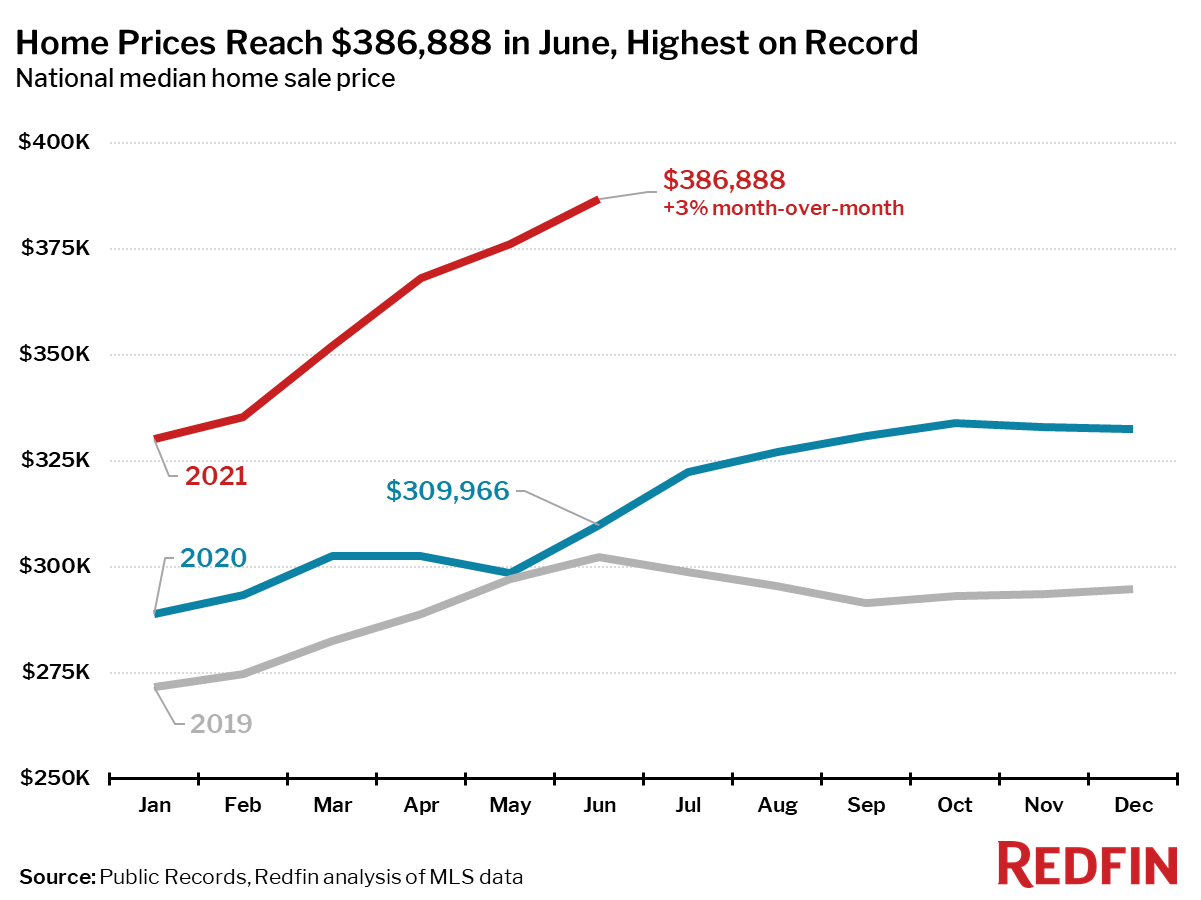
- The national median home-sale price hit a record high of $386,888, up 25% year over year (down from the record of 26% in May).
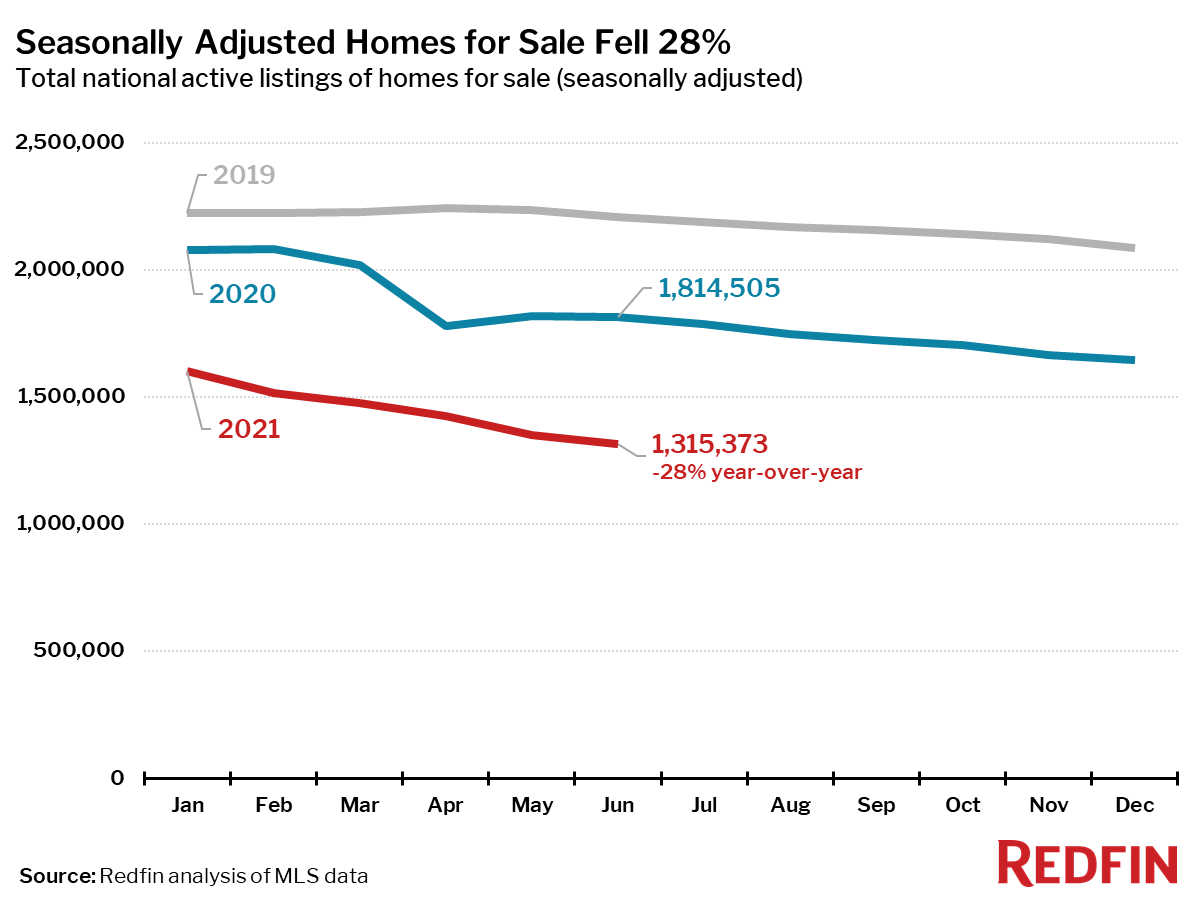
- The number of homes for sale fell to a record low, down 28% from 2020.
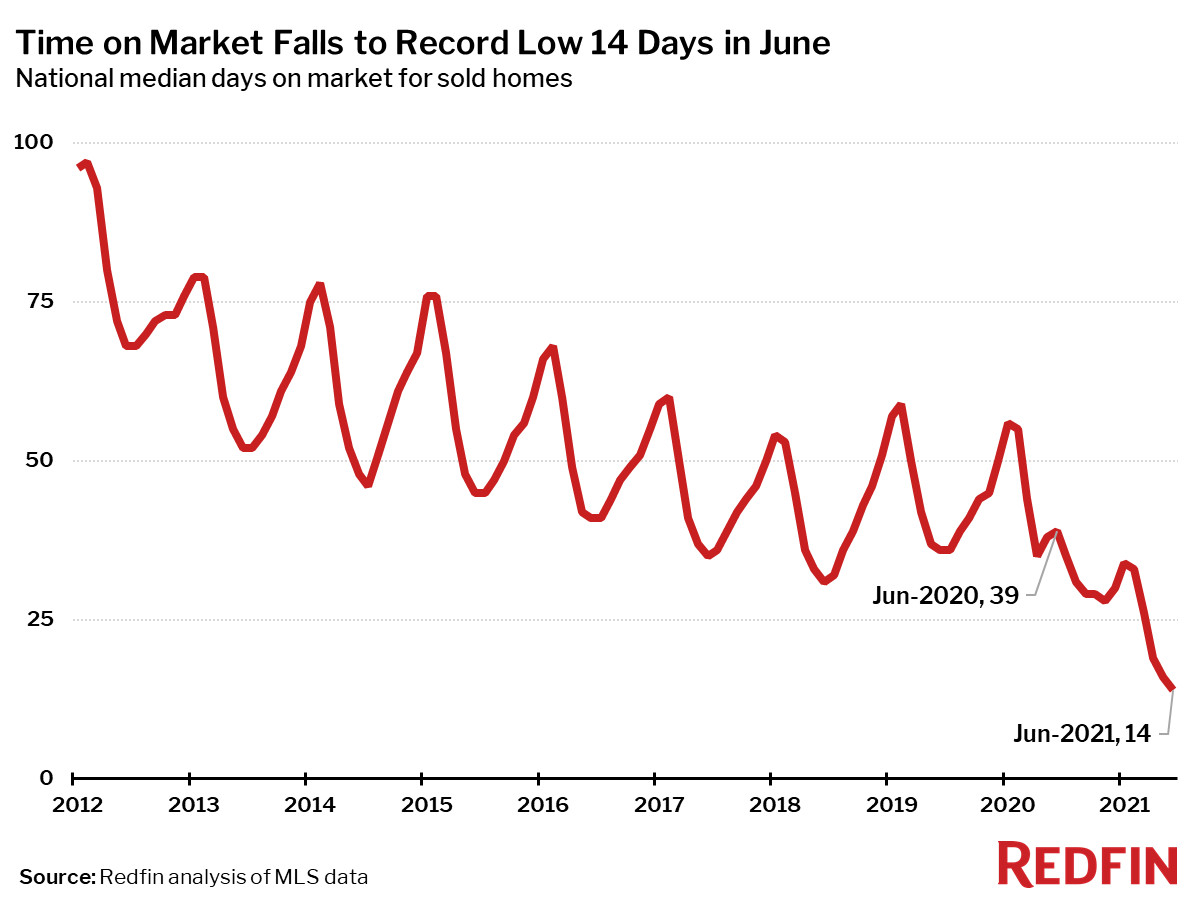
- The typical home sold in just 14 days, a record low and down from 39 days in June 2020.
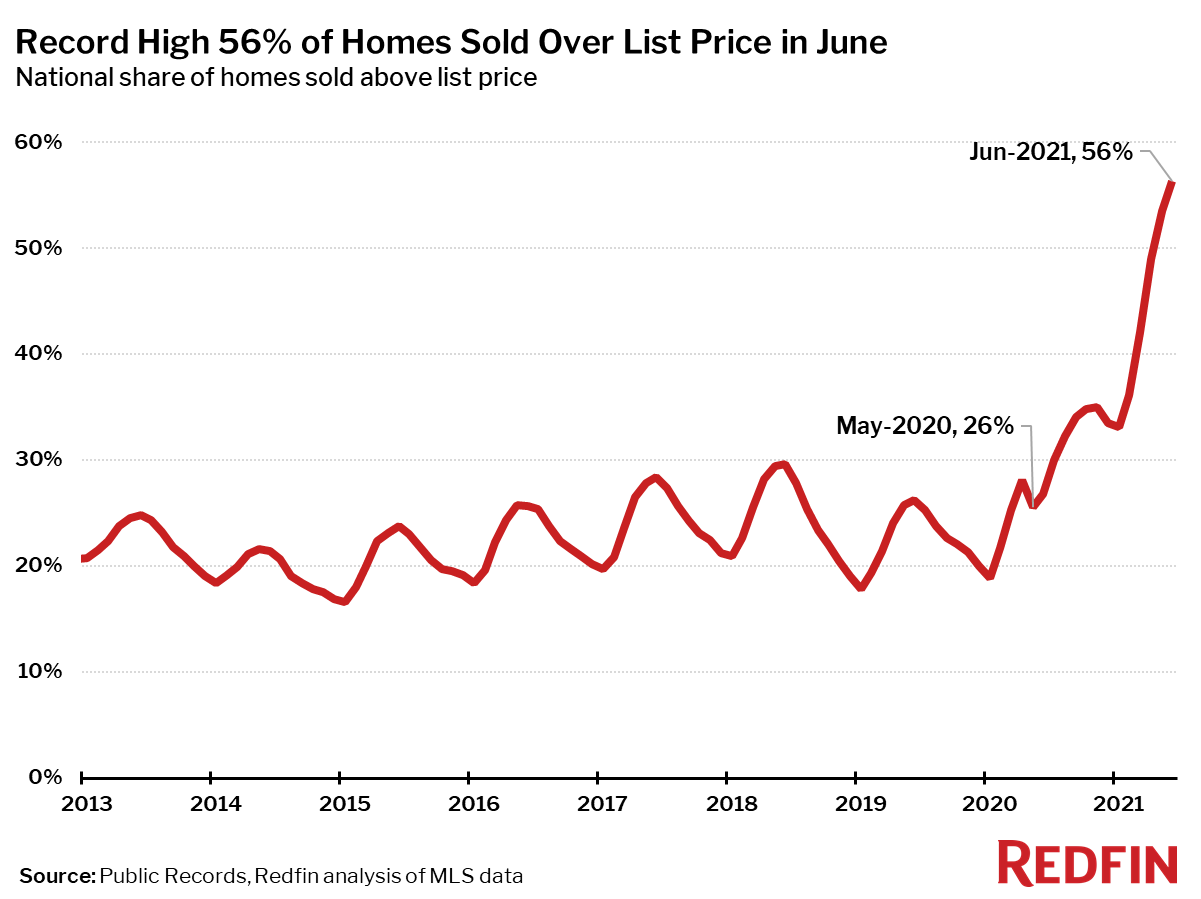
- 56% of homes sold above their list price, a record high, up from 27% a year ago.
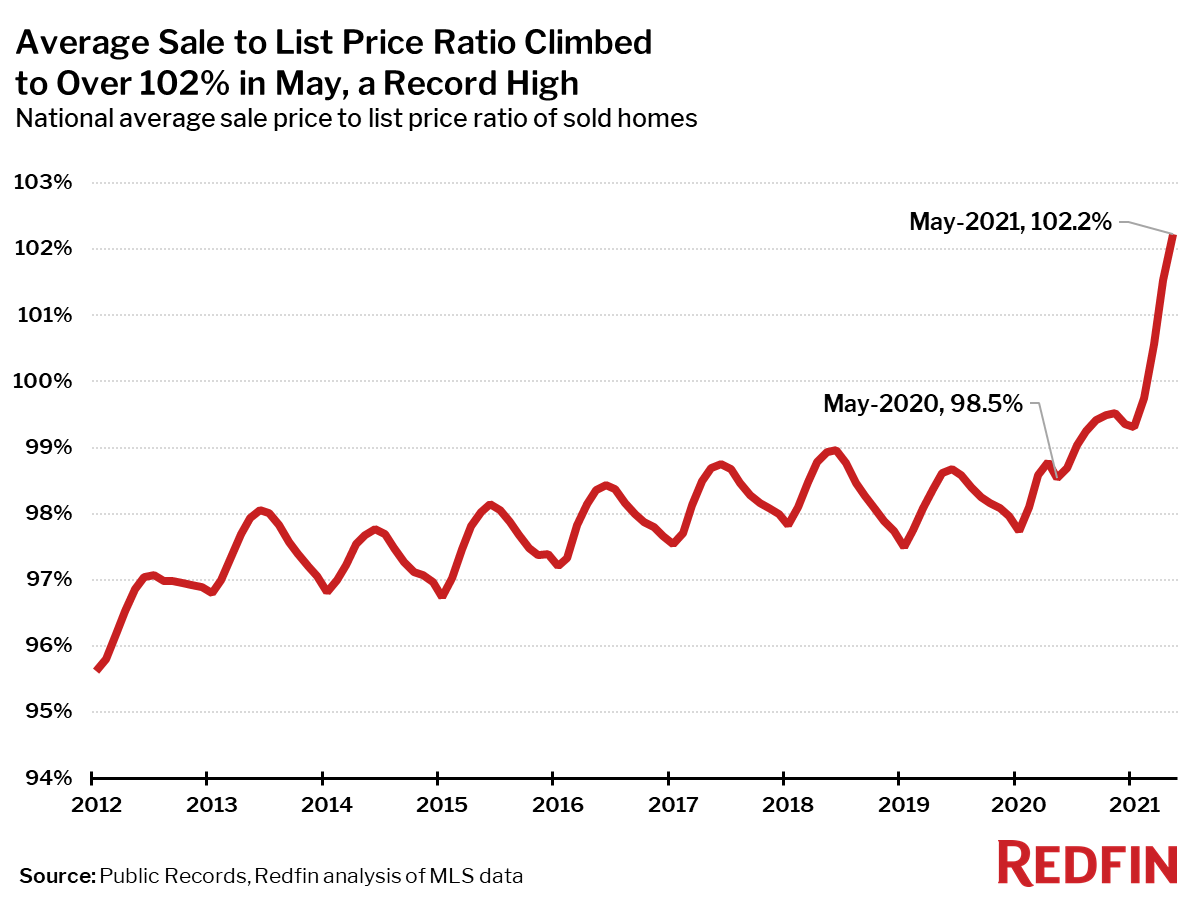
- The average sale-to-list ratio, a measure of how close homes are selling to their asking price, hit a record high of 102.6%. In other words, the average home sold for 2.6% above list price.
“In June we entered a new phase of the housing market,” said Redfin Chief Economist Daryl Fairweather. “Home sales are starting to stall because prices have increased beyond what many buyers can afford. This summer I expect home prices to stabilize as more homeowners list their homes, realizing they likely won’t fetch a higher price by waiting longer to sell. But as rents rise, homeownership will become appealing to more people, and home sales will rev back up by 2022.”
| Market Summary | June 2021 | Month-Over-Month | Year-Over-Year |
|---|---|---|---|
| Median sale price | $386,900 | 2.9% | 24.8% |
| Homes sold, seasonally-adjusted | 602,800 | -1.2% | 21.7% |
| Pending sales, seasonally-adjusted | 562,800 | 1.3% | 19.4% |
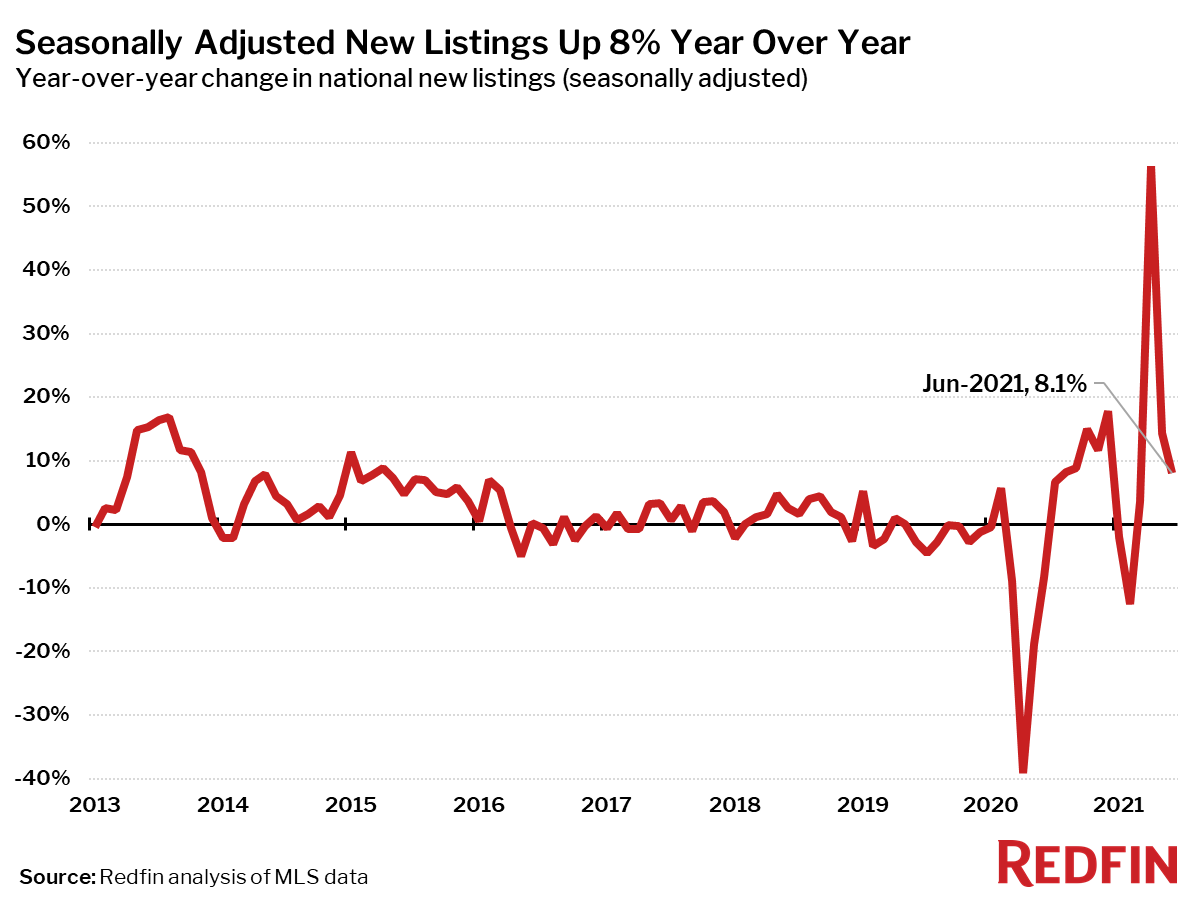
| New listings, seasonally-adjusted | 630,900 | 2.7% | 8.1% |
| All Homes for sale, seasonally-adjusted | 1,315,400 | -2.6% | -27.5% |
| Median days on market | 14 | -1 | -24 |
| Months of supply | 1.1 | -0.1 | -1.1 |
| Sold above list | 56.4% | 2.8 pts† | 29.5 pts† |
| Median Off-Market Redfin Estimate | $350,500 | 1.8% | 15.6% |
| Average Sale-to-list | 102.6% | 0.4 pts† | 3.9 pts† |
| Average 30-year fixed mortgage rate | 2.98% | +0.02 pts† | -0.18 pts† |
Median sale prices increased from a year earlier in all of the 85 largest metro areas Redfin tracks. The largest price increase was in Austin, TX (+43%), where a typical 3-bedroom, 2-bathroom suburban Austin home sold for about $485,000 last month, up from about $340,000 a year earlier.
“Home price growth over the last few months in Austin has been astronomical,” said Redfin Austin market manager Jennifer Hoffer. “There has been a perfect storm of factors driving up price here with tech firms like Tesla, Amazon and Oracle announcing expansions in Austin, celebrities relocating here, and overall a whole lot of really great press for the area.”
The next biggest price increases were seen in Lake County, IL (+31%) and Phoenix (+30%). The smallest price increase was posted in San Francisco, where prices were up 2.6% from a year ago.
Seasonally-adjusted home sales in June were up 22% from a year earlier, but down 1.2% from May. Compared to June 2020, home sales rose in all but four of the 85 largest metro areas Redfin tracks. The biggest declines in sales were in Fort Worth (-8%), Dallas (-3%) and San Antonio (-3%). The largest gains were in places that had the most abrupt slowdown of home sales in June 2020, including Philadelphia (+100%), San Francisco (+96%), and Honolulu (+96%).
Seasonally adjusted active listings—the count of all homes that were for sale at any time during the month—fell 28% year over year to their lowest level on record.
Only two of the 85 largest metros tracked by Redfin posted a year-over-year increase in the number of seasonally adjusted active listings of homes for sale: Milwaukee (+4%) and New York (+1%). The biggest year-over-year declines in active housing supply in June were in Baton Rouge, LA (-57%), North Port, FL (-52%) and Greensboro, NC (-46%).
Seasonally adjusted new listings of homes for sale were up 8% in June from a year earlier. New listings fell from a year ago in 15 of the 85 largest metro areas. The biggest declines were in Baton Rouge (-51%), Allentown, PA (47%) and St. Louis, MO (-41%). New listings rose the most from a year ago in San Jose, CA (+38%), Tacoma, WA (+35%) and Milwaukee (+32%).
Although sales are declining, measures of completed home sales reflected the most competitive market on record in June.
The typical home that sold in June went under contract in 14 days—less than half as much time as a year earlier, when homes sold in a median 39 days.
In June, 56% of homes sold above list price, the largest share on record.
The average sale-to-list price ratio continued to surge in June, hitting a record high of 102.6%. This measure typically peaks in June, but was still climbing sharply through the end of the month. The latest weekly housing market data through July 4 does show the sale-to-list ratio beginning to taper off, so June may still be the peak this year.
Other June Highlights
Competition
- Indianapolis was the fastest market, with half of all homes pending sale in just 4 days, down from 10 days a year earlier. Denver and Elgin, IL were the next fastest markets with 5 and 5 median days on market, followed by Omaha, NE (5) and Oklahoma City (5).
- The most competitive market in June was Oakland, CA where 85.3% of homes sold above list price, followed by 80.1% in San Jose, CA, 78.3% in Worcester, MA, 76.5% in Rochester, NY, and 74.3% in Denver.
Prices
- Austin, TX had the nation’s highest price growth, rising 42.6% since last year to $485,000. Lake County, IL had the second highest growth at 30.5% year-over-year price growth, followed by Phoenix (30%), Salt Lake City (29.4%), and North Port, FL (27.6%).
- No metro areas saw price declines in June.
Sales
- Philadelphia led the nation in year-over-year sales growth, up 100%, followed by San Francisco, up 96%. Honolulu, HI rounded out the top three with sales up 96% from a year ago.
- Fort Worth, TX saw the largest decline in sales since last year, falling 8.1%. Home sales in Dallas and San Antonio declined by 2.9% and 2.6%, respectively.
Inventory
- Milwaukee had the highest increase in the number of homes for sale, up 4.7% year over year, followed by New York (1.5%) and San Jose, CA (-0.6%).
- Baton Rouge, LA had the largest decrease in overall active listings, falling 56.8% since last June. North Port, FL (-51.6%), and Greensboro, NC (-46.5%) also saw far fewer homes available on the market than a year ago.
Redfin Estimate
- Miami (89.1%) had the largest share of homes predicted to sell for below list price, according to Redfin Estimate data, followed by West Palm Beach, FL (83.6%) and Fort Lauderdale, FL (82.7%).
- Oakland, CA (93.7%) had the largest share of homes predicted to sell at or above list price, followed by San Jose, CA (91.3%) and Portland, OR (84.8%).
Below are market-by-market breakdowns for prices, inventory, new listings and sales for markets with populations of 750,000 or more. For downloadable data on all of the markets Redfin tracks, visit the Redfin Data Center. Refer to our metrics definition page for explanations of all the metrics used in this report.
Median Sale Price
| Redfin Metro | Median Sale Price | Month-Over-Month | Year-Over-Year |
|---|---|---|---|
| Albany, NY | $269,000 | 5.5% | 19.6% |
| Allentown, PA | $276,000 | 10.4% | 20.0% |
| Anaheim, CA | $910,000 | 1.1% | 19.7% |
| Atlanta, GA | $339,000 | 4.3% | 25.6% |
| Austin, TX | $485,000 | 3.6% | 42.6% |
| Bakersfield, CA | $306,500 | -1.1% | 15.7% |
| Baltimore, MD | $351,500 | 3.4% | 13.4% |
| Baton Rouge, LA | $245,400 | 4.4% | 14.2% |
| Birmingham, AL | $267,000 | 2.7% | 11.6% |
| Boston, MA | $650,000 | 4.5% | 20.1% |
| Bridgeport, CT | $575,000 | 7.9% | 18.6% |
| Buffalo, NY | $205,000 | 0.0% | 24.2% |
| Camden, NJ | $266,000 | 2.4% | 21.6% |
| Charleston, SC | $360,000 | 2.7% | 24.3% |
| Charlotte, NC | $341,300 | 2.9% | 18.1% |
| Chicago, IL | $320,000 | 1.6% | 18.5% |
| Cincinnati, OH | $256,800 | 7.0% | 18.9% |
| Cleveland, OH | $203,000 | 9.7% | 17.3% |
| Columbus, OH | $285,000 | 0.5% | 14.2% |
| Dallas, TX | $380,000 | 1.3% | 21.0% |
| Dayton, OH | $190,000 | 1.6% | 13.3% |
| Denver, CO | $542,500 | 1.9% | 23.2% |
| Detroit, MI | $182,000 | 3.4% | 16.9% |
| El Paso, TX | $199,600 | 2.3% | 14.0% |
| Elgin, IL | $285,000 | 5.2% | 14.1% |
| Fort Lauderdale, FL | $345,000 | 6.2% | 13.1% |
| Fort Worth, TX | $313,500 | 1.2% | 20.9% |
| Frederick, MD | $500,000 | 0.0% | 14.9% |
| Fresno, CA | $368,200 | 4.9% | 18.8% |
| Grand Rapids, MI | $280,000 | 4.6% | 21.1% |
| Greensboro, NC | $232,200 | 7.8% | 16.1% |
| Greenville, SC | $273,400 | 3.9% | 16.4% |
| Hartford, CT | $282,600 | 2.8% | 16.3% |
| Houston, TX | $312,000 | 4.0% | 19.1% |
| Indianapolis, IN | $250,000 | 0.0% | 13.7% |
| Jacksonville, FL | $305,000 | 5.1% | 18.5% |
| Kansas City, MO | $285,000 | 1.5% | 12.6% |
| Knoxville, TN | $284,900 | 5.5% | 21.2% |
| Lake County, IL | $325,000 | 8.4% | 30.5% |
| Las Vegas, NV | $365,000 | 2.8% | 18.1% |
| Los Angeles, CA | $828,000 | 1.6% | 26.4% |
| Louisville, KY | $239,900 | 4.3% | 14.2% |
| McAllen, TX | $190,000 | 4.3% | 22.6% |
| Memphis, TN | $260,000 | 4.8% | 20.9% |
| Miami, FL | $415,000 | 2.5% | 22.1% |
| Milwaukee, WI | $280,000 | 3.7% | 12.0% |
| Minneapolis, MN | $351,000 | 1.7% | 14.3% |
| Montgomery County, PA | $410,000 | 7.5% | 18.0% |
| Nashville, TN | $390,700 | 4.2% | 22.1% |
| Nassau County, NY | $578,800 | 2.4% | 22.1% |
| New Brunswick, NJ | $430,000 | 3.0% | 21.1% |
| New Haven, CT | $299,000 | 7.0% | 24.6% |
| New Orleans, LA | $283,000 | 3.3% | 15.5% |
| New York, NY | $662,500 | 2.7% | 17.3% |
| Newark, NJ | $495,000 | 8.7% | 23.8% |
| North Port, FL | $370,000 | 2.7% | 27.6% |
| Oakland, CA | $960,000 | -2.0% | 20.3% |
| Oklahoma City, OK | $230,000 | 2.2% | 12.2% |
| Omaha, NE | $265,000 | 4.7% | 13.7% |
| Orlando, FL | $325,000 | 4.3% | 16.5% |
| Oxnard, CA | $800,000 | 6.7% | 25.0% |
| Philadelphia, PA | $280,000 | 4.5% | 12.0% |
| Phoenix, AZ | $403,000 | 1.3% | 30.0% |
| Pittsburgh, PA | $235,000 | 8.7% | 17.5% |
| Portland, OR | $512,000 | 0.4% | 19.1% |
| Providence, RI | $379,000 | 4.7% | 21.5% |
| Raleigh, NC | $375,000 | 4.2% | 23.4% |
| Richmond, VA | $325,000 | 4.8% | 17.1% |
| Riverside, CA | $510,000 | 1.6% | 25.2% |
| Rochester, NY | $202,400 | 6.0% | 26.5% |
| Sacramento, CA | $565,000 | 2.7% | 27.0% |
| Salt Lake City, UT | $478,700 | 5.2% | 29.4% |
| San Antonio, TX | $294,000 | 4.2% | 17.6% |
| San Diego, CA | $770,000 | 1.3% | 26.4% |
| San Francisco, CA | $1,590,000 | 3.3% | 2.6% |
| San Jose, CA | $1,400,000 | 2.2% | 19.9% |
| Seattle, WA | $735,000 | 0.0% | 20.5% |
| St. Louis, MO | $238,000 | 3.5% | 13.3% |
| Tacoma, WA | $505,000 | 0.8% | 23.2% |
| Tampa, FL | $310,000 | 3.4% | 21.6% |
| Tucson, AZ | $310,000 | 3.1% | 26.5% |
| Tulsa, OK | $227,500 | 6.8% | 16.4% |
| Honolulu, HI | $657,500 | -0.7% | 7.9% |
| Virginia Beach, VA | $290,000 | 1.8% | 13.3% |
| Warren, MI | $280,000 | 2.6% | 18.1% |
| Washington, DC | $520,000 | 1.5% | 18.2% |
| West Palm Beach, FL | $380,000 | 3.3% | 21.4% |
| Worcester, MA | $370,000 | 2.8% | 23.3% |
| National | $386,900 | 2.9% | 24.8% |
Homes Sold
| Redfin Metro | Homes Sold | Month-Over-Month | Year-Over-Year |
|---|---|---|---|
| Albany, NY | 1,024 | 16.5% | 49.1% |
| Allentown, PA | 1,087 | 28.8% | 78.8% |
| Anaheim, CA | 3,598 | 8.8% | 66.3% |
| Atlanta, GA | 11,301 | 7.9% | 4.7% |
| Austin, TX | 4,171 | 9.4% | 4.4% |
| Bakersfield, CA | 942 | 5.7% | 19.2% |
| Baltimore, MD | 5,359 | 16.2% | 27.3% |
| Baton Rouge, LA | 1,287 | 1.7% | 5.6% |
| Birmingham, AL | 1,853 | 8.1% | 5.2% |
| Boston, MA | 6,250 | 30.5% | 54.1% |
| Bridgeport, CT | 1,859 | 46.3% | 68.7% |
| Buffalo, NY | 967 | 7.1% | 41.4% |
| Camden, NJ | 2,206 | 25.6% | 24.1% |
| Charleston, SC | 2,189 | 12.4% | 16.3% |
| Charlotte, NC | 5,098 | 12.7% | 4.2% |
| Chicago, IL | 12,942 | 17.5% | 58.3% |
| Cincinnati, OH | 3,415 | 12.2% | 7.0% |
| Cleveland, OH | 3,238 | 18.3% | 18.3% |
| Columbus, OH | 3,428 | 18.2% | 13.5% |
| Dallas, TX | 7,137 | 6.1% | -2.9% |
| Dayton, OH | 1,290 | 16.2% | 8.6% |
| Denver, CO | 6,501 | 16.6% | 10.2% |
| Detroit, MI | 2,136 | 11.7% | 23.7% |
| El Paso, TX | 943 | 13.2% | 5.2% |
| Elgin, IL | 1,507 | 28.6% | 31.7% |
| Fort Lauderdale, FL | 4,193 | 6.4% | 65.2% |
| Fort Worth, TX | 3,404 | 9.8% | -8.1% |
| Frederick, MD | 2,341 | 13.6% | 41.8% |
| Fresno, CA | 922 | 11.0% | 9.9% |
| Grand Rapids, MI | 1,516 | 13.0% | 2.8% |
| Greensboro, NC | 1,144 | 9.5% | 16.6% |
| Greenville, SC | 1,520 | 12.6% | 3.8% |
| Hartford, CT | 2,014 | 28.4% | 35.5% |
| Houston, TX | 11,009 | 7.9% | 14.6% |
| Indianapolis, IN | 3,950 | 16.1% | 10.5% |
| Jacksonville, FL | 3,463 | 0.5% | 15.4% |
| Kansas City, MO | 4,109 | 15.8% | 7.4% |
| Knoxville, TN | 1,535 | 21.9% | 3.2% |
| Lake County, IL | 1,956 | 25.8% | 55.0% |
| Las Vegas, NV | 4,627 | 9.7% | 60.9% |
| Los Angeles, CA | 7,739 | 9.9% | 67.6% |
| Louisville, KY | 1,982 | 5.9% | -0.6% |
| McAllen, TX | 434 | 1.9% | 4.3% |
| Memphis, TN | 1,386 | 10.4% | 9.2% |
| Miami, FL | 4,038 | 6.5% | 92.7% |
| Milwaukee, WI | 2,482 | 19.3% | 24.8% |
| Minneapolis, MN | 7,498 | 32.0% | 20.0% |
| Montgomery County, PA | 3,306 | 36.1% | 84.7% |
| Nashville, TN | 4,300 | 12.3% | 4.0% |
| Nassau County, NY | 3,013 | 24.8% | 56.8% |
| New Brunswick, NJ | 3,904 | 21.5% | 40.4% |
| New Haven, CT | 1,334 | 25.6% | 38.1% |
| New Orleans, LA | 1,823 | 10.0% | 21.0% |
| New York, NY | 7,727 | 15.9% | 85.5% |
| Newark, NJ | 3,009 | 33.7% | 53.9% |
| North Port, FL | 2,858 | 8.5% | 39.6% |
| Oakland, CA | 3,430 | 8.0% | 56.9% |
| Oklahoma City, OK | 2,519 | 10.5% | 0.5% |
| Omaha, NE | 1,615 | 17.9% | 2.1% |
| Orlando, FL | 5,084 | 4.3% | 31.0% |
| Oxnard, CA | 935 | 8.2% | 38.3% |
| Philadelphia, PA | 3,173 | 20.0% | 100.4% |
| Phoenix, AZ | 9,640 | 4.5% | 5.4% |
| Pittsburgh, PA | 2,978 | 19.0% | 62.6% |
| Portland, OR | 4,485 | 9.3% | 26.3% |
| Providence, RI | 2,372 | 29.5% | 34.2% |
| Raleigh, NC | 3,101 | 14.7% | 7.3% |
| Richmond, VA | 2,372 | 17.8% | 20.5% |
| Riverside, CA | 6,177 | 15.9% | 30.6% |
| Rochester, NY | 1,136 | 17.7% | 37.5% |
| Sacramento, CA | 3,376 | 10.6% | 13.6% |
| San Antonio, TX | 3,591 | 7.7% | -2.6% |
| San Diego, CA | 3,989 | 11.7% | 26.9% |
| San Francisco, CA | 1,565 | 11.9% | 96.4% |
| San Jose, CA | 2,096 | 9.7% | 73.8% |
| Seattle, WA | 6,014 | 15.7% | 38.4% |
| St. Louis, MO | 4,856 | 20.5% | 14.0% |
| Tacoma, WA | 1,878 | 24.6% | 31.1% |
| Tampa, FL | 7,182 | 8.7% | 11.6% |
| Tucson, AZ | 1,859 | 6.8% | 8.8% |
| Tulsa, OK | 1,643 | 7.3% | 8.3% |
| Honolulu, HI | 1,150 | 20.7% | 96.2% |
| Virginia Beach, VA | 3,556 | 17.1% | 24.0% |
| Warren, MI | 4,275 | 14.6% | 23.9% |
| Washington, DC | 9,394 | 11.6% | 30.7% |
| West Palm Beach, FL | 4,071 | 0.8% | 58.2% |
| Worcester, MA | 1,316 | 28.4% | 27.8% |
| National | 602,800 | -1.2% | 21.7% |
New Listings
| Redfin Metro | New Listings | Month-Over-Month | Year-Over-Year |
|---|---|---|---|
| Albany, NY | 1,560 | 14.9% | 9.9% |
| Allentown, PA | 690 | -18.0% | -46.9% |
| Anaheim, CA | 3,520 | 1.2% | 11.5% |
| Atlanta, GA | 12,128 | 10.5% | 6.1% |
| Austin, TX | 5,002 | 16.2% | 23.8% |
| Bakersfield, CA | 1,011 | 6.4% | 7.8% |
| Baltimore, MD | 5,411 | -0.3% | 17.0% |
| Baton Rouge, LA | 661 | -31.3% | -51.3% |
| Birmingham, AL | 1,985 | 15.3% | 11.4% |
| Boston, MA | 7,291 | 21.9% | 8.3% |
| Bridgeport, CT | 2,003 | -1.2% | -14.4% |
| Buffalo, NY | 1,673 | 18.1% | 9.3% |
| Camden, NJ | 2,350 | -1.7% | 13.3% |
| Charleston, SC | 2,016 | 9.4% | 6.8% |
| Charlotte, NC | 3,488 | -16.7% | -27.7% |
| Chicago, IL | 13,728 | 2.5% | 4.7% |
| Cincinnati, OH | 3,734 | 7.3% | 5.1% |
| Cleveland, OH | 3,977 | 7.6% | 14.3% |
| Columbus, OH | 3,961 | 10.1% | 20.0% |
| Dallas, TX | 8,188 | 6.0% | 0.8% |
| Dayton, OH | 1,511 | 15.6% | 13.2% |
| Denver, CO | 7,449 | 21.4% | 12.4% |
| Detroit, MI | 2,760 | 6.6% | 3.5% |
| El Paso, TX | 1,182 | 23.1% | 12.6% |
| Elgin, IL | 1,456 | -0.7% | 0.1% |
| Fort Lauderdale, FL | 3,714 | -1.0% | -3.7% |
| Fort Worth, TX | 4,051 | 14.4% | 2.8% |
| Frederick, MD | 2,305 | 0.6% | 18.8% |
| Fresno, CA | 1,026 | 3.4% | 29.7% |
| Grand Rapids, MI | 1,723 | 12.9% | -6.3% |
| Greensboro, NC | 780 | -8.8% | -28.0% |
| Greenville, SC | 1,566 | 10.7% | 14.1% |
| Hartford, CT | 2,350 | 3.2% | 8.9% |
| Houston, TX | 13,367 | 12.3% | 20.1% |
| Indianapolis, IN | 4,341 | 12.1% | 14.1% |
| Jacksonville, FL | 3,585 | 2.1% | 14.4% |
| Kansas City, MO | 4,170 | -0.9% | 4.3% |
| Knoxville, TN | 1,365 | -6.1% | -3.7% |
| Lake County, IL | 1,932 | 3.6% | 8.7% |
| Las Vegas, NV | 4,870 | 0.5% | 32.0% |
| Los Angeles, CA | 8,693 | 5.0% | 19.6% |
| Louisville, KY | 2,301 | 12.0% | 8.9% |
| McAllen, TX | 569 | 12.7% | 28.2% |
| Memphis, TN | 1,603 | 5.7% | 13.2% |
| Miami, FL | 4,454 | 1.3% | 14.5% |
| Milwaukee, WI | 3,308 | 26.5% | 32.0% |
| Minneapolis, MN | 7,846 | 8.0% | 12.8% |
| Montgomery County, PA | 3,520 | 5.1% | 0.9% |
| Nashville, TN | 4,110 | 11.0% | -14.0% |
| Nassau County, NY | 4,197 | 5.3% | -6.8% |
| New Brunswick, NJ | 4,802 | 6.6% | 1.8% |
| New Haven, CT | 1,551 | 1.3% | 5.3% |
| New Orleans, LA | 1,815 | 0.4% | 11.4% |
| New York, NY | 10,586 | 4.3% | 0.7% |
| Newark, NJ | 3,529 | 8.6% | 1.7% |
| North Port, FL | 2,351 | -5.3% | 8.8% |
| Oakland, CA | 3,754 | 11.3% | 32.0% |
| Oklahoma City, OK | 2,880 | 9.4% | 8.1% |
| Omaha, NE | 1,593 | 10.7% | 2.5% |
| Orlando, FL | 5,210 | 2.6% | 9.6% |
| Oxnard, CA | 987 | 2.8% | 16.5% |
| Philadelphia, PA | 3,154 | -5.3% | -2.4% |
| Phoenix, AZ | 9,460 | 0.7% | 17.0% |
| Pittsburgh, PA | 3,491 | 3.6% | 4.1% |
| Portland, OR | 4,876 | 6.3% | 19.5% |
| Providence, RI | 2,846 | 12.0% | 19.5% |
| Raleigh, NC | 2,552 | 1.4% | -7.6% |
| Richmond, VA | 2,421 | -0.5% | 18.7% |
| Riverside, CA | 6,905 | 4.5% | 26.3% |
| Rochester, NY | 1,688 | 24.3% | 8.5% |
| Sacramento, CA | 3,715 | 9.3% | 10.7% |
| San Antonio, TX | 4,200 | 8.4% | 16.2% |
| San Diego, CA | 4,253 | 2.4% | 15.9% |
| San Francisco, CA | 1,298 | -11.6% | -13.6% |
| San Jose, CA | 2,085 | -0.2% | 38.2% |
| Seattle, WA | 6,375 | 9.9% | 23.0% |
| St. Louis, MO | 2,812 | -24.6% | -40.7% |
| Tacoma, WA | 2,024 | 9.5% | 34.7% |
| Tampa, FL | 7,385 | 4.1% | 18.1% |
| Tucson, AZ | 1,806 | 4.5% | 21.5% |
| Tulsa, OK | 1,946 | 13.5% | 17.4% |
| Honolulu, HI | 947 | 4.4% | 7.6% |
| Virginia Beach, VA | 3,716 | 1.6% | 30.6% |
| Warren, MI | 5,481 | 16.3% | 1.9% |
| Washington, DC | 9,244 | -3.7% | 20.9% |
| West Palm Beach, FL | 3,620 | -6.8% | -3.3% |
| Worcester, MA | 1,670 | 24.1% | 17.9% |
| National | 630,900 | 2.7% | 8.1% |
All Homes for Sale
| Redfin Metro | All Homes for Sale | Month-Over-Month | Year-Over-Year |
|---|---|---|---|
| Albany, NY | 3,099 | 5.8% | -13.4% |
| Allentown, PA | 1,609 | -12.6% | -43.5% |
| Anaheim, CA | 7,786 | -1.1% | -20.5% |
| Atlanta, GA | 22,702 | 3.5% | -35.1% |
| Austin, TX | 9,271 | 9.5% | -11.4% |
| Bakersfield, CA | 2,008 | 0.4% | -19.9% |
| Baltimore, MD | 9,933 | -1.7% | -20.8% |
| Baton Rouge, LA | 1,980 | -17.7% | -56.8% |
| Birmingham, AL | 4,706 | 3.7% | -22.0% |
| Boston, MA | 12,974 | 6.5% | -12.8% |
| Bridgeport, CT | 6,083 | 2.4% | -16.6% |
| Buffalo, NY | 2,616 | 11.3% | -12.6% |
| Camden, NJ | 4,774 | 0.7% | -20.9% |
| Charleston, SC | 5,514 | 1.9% | -28.1% |
| Charlotte, NC | 9,309 | -9.4% | -41.4% |
| Chicago, IL | 29,791 | 1.9% | -17.0% |
| Cincinnati, OH | 9,095 | 6.3% | -9.8% |
| Cleveland, OH | 8,045 | 8.0% | -9.9% |
| Columbus, OH | 8,557 | 10.5% | -1.9% |
| Dallas, TX | 15,407 | 2.8% | -37.2% |
| Dayton, OH | 2,874 | 11.4% | -10.6% |
| Denver, CO | 9,941 | 10.4% | -28.2% |
| Detroit, MI | 5,411 | 6.7% | -24.4% |
| El Paso, TX | 2,634 | 4.6% | -23.3% |
| Elgin, IL | 2,353 | -1.2% | -35.8% |
| Fort Lauderdale, FL | 12,090 | -5.0% | -28.8% |
| Fort Worth, TX | 7,287 | 6.3% | -34.2% |
| Frederick, MD | 4,141 | -0.9% | -14.1% |
| Fresno, CA | 1,750 | 6.4% | -10.8% |
| Grand Rapids, MI | 2,588 | 7.3% | -31.4% |
| Greensboro, NC | 1,787 | -14.2% | -46.5% |
| Greenville, SC | 3,955 | 2.1% | -25.0% |
| Hartford, CT | 5,637 | 3.5% | -11.8% |
| Houston, TX | 26,694 | 6.5% | -25.3% |
| Indianapolis, IN | 6,551 | 4.9% | -18.2% |
| Jacksonville, FL | 7,348 | -3.4% | -31.0% |
| Kansas City, MO | 7,617 | -1.9% | -18.2% |
| Knoxville, TN | 3,862 | 3.1% | -24.7% |
| Lake County, IL | 3,752 | 5.0% | -26.1% |
| Las Vegas, NV | 9,868 | 2.1% | -25.8% |
| Los Angeles, CA | 21,464 | 1.6% | -3.9% |
| Louisville, KY | 4,268 | 3.9% | -20.5% |
| McAllen, TX | 1,752 | -1.0% | -31.2% |
| Memphis, TN | 3,411 | 4.6% | -9.3% |
| Miami, FL | 16,256 | -3.1% | -20.6% |
| Milwaukee, WI | 7,466 | 15.3% | 4.7% |
| Minneapolis, MN | 13,570 | 5.4% | -17.2% |
| Montgomery County, PA | 6,418 | 3.7% | -24.1% |
| Nashville, TN | 8,367 | 2.5% | -45.5% |
| Nassau County, NY | 10,521 | 4.1% | -19.9% |
| New Brunswick, NJ | 10,553 | 7.2% | -21.6% |
| New Haven, CT | 4,082 | 1.8% | -8.6% |
| New Orleans, LA | 4,139 | -2.0% | -25.6% |
| New York, NY | 39,836 | 2.4% | 1.5% |
| Newark, NJ | 8,925 | 7.9% | -11.7% |
| North Port, FL | 3,968 | -6.5% | -51.6% |
| Oakland, CA | 5,722 | 6.4% | -5.2% |
| Oklahoma City, OK | 4,688 | 6.1% | -27.8% |
| Omaha, NE | 2,441 | 4.0% | -21.1% |
| Orlando, FL | 9,269 | -0.9% | -34.0% |
| Oxnard, CA | 2,233 | 2.1% | -17.7% |
| Philadelphia, PA | 8,173 | -3.3% | -11.3% |
| Phoenix, AZ | 18,796 | -0.7% | -22.7% |
| Pittsburgh, PA | 10,048 | 5.7% | -8.0% |
| Portland, OR | 7,637 | 3.0% | -19.6% |
| Providence, RI | 5,481 | 8.8% | -15.1% |
| Raleigh, NC | 5,554 | -6.8% | -38.2% |
| Richmond, VA | 4,033 | -2.7% | -12.8% |
| Riverside, CA | 14,517 | 4.5% | -19.1% |
| Rochester, NY | 2,422 | 9.5% | -18.9% |
| Sacramento, CA | 5,949 | 6.4% | -25.6% |
| San Antonio, TX | 7,885 | 3.9% | -33.8% |
| San Diego, CA | 7,364 | 5.1% | -18.1% |
| San Francisco, CA | 2,995 | -9.4% | -12.0% |
| San Jose, CA | 3,647 | -0.5% | -0.6% |
| Seattle, WA | 8,950 | 2.9% | -10.9% |
| St. Louis, MO | 7,227 | -15.5% | -41.5% |
| Tacoma, WA | 2,842 | 6.6% | -2.3% |
| Tampa, FL | 12,275 | 2.2% | -32.2% |
| Tucson, AZ | 4,271 | -1.5% | -17.7% |
| Tulsa, OK | 3,206 | 9.4% | -23.9% |
| Honolulu, HI | 3,106 | -2.6% | -23.7% |
| Virginia Beach, VA | 7,140 | 1.7% | -7.7% |
| Warren, MI | 9,334 | 11.6% | -24.1% |
| Washington, DC | 17,940 | -2.2% | -5.8% |
| West Palm Beach, FL | 10,720 | -4.3% | -34.7% |
| Worcester, MA | 2,921 | 12.8% | -13.1% |
| National | 1,315,400 | -2.6% | -27.5% |
Median Off-Market Redfin Estimate
| Redfin Metro | Estimate | Month-Over-Month | Year-Over-Year |
|---|---|---|---|
| Albany, NY | $222,400 | 1.2% | 11.7% |
| Allentown, PA | $241,800 | 1.4% | 13.5% |
| Anaheim, CA | $845,400 | 1.8% | 14.6% |
| Atlanta, GA | $271,600 | 2.1% | 15.9% |
| Austin, TX | $387,000 | 4.8% | 27.7% |
| Bakersfield, CA | $221,500 | 2.1% | 12.1% |
| Baltimore, MD | $306,400 | 1.4% | 12.4% |
| Baton Rouge, LA | $145,200 | 1.3% | 11.6% |
| Birmingham, AL | $153,300 | 1.6% | 12.4% |
| Boston, MA | $588,200 | 1.6% | 11.2% |
| Bridgeport, CT | $429,600 | 1.3% | 9.4% |
| Buffalo, NY | $173,600 | 1.7% | 13.7% |
| Camden, NJ | $241,900 | 1.8% | 16.6% |
| Charleston, SC | $271,500 | 2.0% | 13.3% |
| Charlotte, NC | $254,000 | 2.2% | 19.4% |
| Chicago, IL | $283,700 | 1.5% | 8.1% |
| Cincinnati, OH | $189,800 | 1.9% | 13.5% |
| Cleveland, OH | $161,300 | 1.5% | 13.1% |
| Columbus, OH | $225,500 | 1.8% | 12.1% |
| Dallas, TX | $296,000 | 1.9% | 14.2% |
| Dayton, OH | $144,400 | 1.7% | 13.4% |
| Denver, CO | $473,100 | 1.9% | 11.9% |
| Detroit, MI | $118,900 | 1.7% | 11.8% |
| Elgin, IL | $254,300 | 1.6% | 9.9% |
| Fort Lauderdale, FL | $306,900 | 1.3% | 11.2% |
| Fort Worth, TX | $252,100 | 2.0% | 13.5% |
| Frederick, MD | $463,800 | 1.7% | 11.3% |
| Fresno, CA | $306,500 | 2.0% | 16.7% |
| Grand Rapids, MI | $207,100 | 2.1% | 19.1% |
| Greensboro, NC | $162,500 | 2.1% | 18.5% |
| Greenville, SC | $183,900 | 1.6% | 13.3% |
| Hartford, CT | $244,300 | 1.1% | 8.4% |
| Houston, TX | $226,000 | 1.9% | 13.2% |
| Indianapolis, IN | $189,600 | 1.9% | 13.4% |
| Jacksonville, FL | $247,000 | 2.1% | 15.3% |
| Kansas City, MO | $210,100 | 2.1% | 13.3% |
| Knoxville, TN | $210,500 | 2.2% | 16.9% |
| Lake County, IL | $241,300 | 1.7% | 11.0% |
| Las Vegas, NV | $326,300 | 2.5% | 13.5% |
| Los Angeles, CA | $739,400 | 1.8% | 13.6% |
| Louisville, KY | $197,000 | 0.6% | 10.3% |
| Memphis, TN | $174,100 | 1.6% | 16.6% |
| Miami, FL | $352,500 | 1.4% | 11.2% |
| Milwaukee, WI | $232,500 | 1.8% | 11.7% |
| Minneapolis, MN | $304,300 | 1.3% | 10.5% |
| Montgomery County, PA | $365,600 | 1.4% | 11.9% |
| Nashville, TN | $314,500 | 1.9% | 12.0% |
| Nassau County, NY | $546,200 | 0.8% | 13.0% |
| New Brunswick, NJ | $395,600 | 1.4% | 14.1% |
| New Haven, CT | $250,100 | 1.3% | 11.4% |
| New Orleans, LA | $191,700 | 1.4% | 11.8% |
| Newark, NJ | $419,100 | 0.9% | 13.2% |
| North Port, FL | $275,500 | 2.2% | 15.6% |
| Oakland, CA | $918,800 | 2.5% | 17.4% |
| Oklahoma City, OK | $163,600 | 1.2% | 10.7% |
| Omaha, NE | $217,000 | 1.7% | 13.7% |
| Orlando, FL | $265,800 | 1.6% | 11.9% |
| Oxnard, CA | $689,400 | 2.3% | 14.3% |
| Philadelphia, PA | $220,400 | 1.5% | 13.6% |
| Phoenix, AZ | $335,500 | 2.4% | 21.3% |
| Pittsburgh, PA | $150,100 | 1.5% | 13.2% |
| Portland, OR | $456,700 | 2.0% | 13.3% |
| Providence, RI | $342,600 | 1.7% | 15.2% |
| Raleigh, NC | $294,900 | 2.1% | 13.1% |
| Richmond, VA | $265,000 | 1.8% | 10.8% |
| Riverside, CA | $401,500 | 2.5% | 20.4% |
| Rochester, NY | $163,600 | 1.5% | 11.6% |
| Sacramento, CA | $488,800 | 2.1% | 17.4% |
| Salt Lake City, UT | $423,200 | 2.4% | 17.6% |
| San Antonio, TX | $209,000 | 1.6% | 12.7% |
| San Diego, CA | $724,300 | 2.5% | 18.6% |
| San Francisco, CA | $1,442,800 | 1.7% | 5.0% |
| San Jose, CA | $1,337,700 | 1.7% | 15.1% |
| Seattle, WA | $672,700 | 2.4% | 17.6% |
| St. Louis, MO | $168,300 | 1.0% | 5.1% |
| Tacoma, WA | $445,300 | 1.9% | 19.4% |
| Tampa, FL | $252,800 | 0.0% | 13.4% |
| Tucson, AZ | $246,400 | 2.1% | 19.1% |
| Tulsa, OK | $147,500 | 1.1% | 10.4% |
| Honolulu, HI | $771,400 | 1.4% | 9.9% |
| Virginia Beach, VA | $258,900 | 1.2% | 10.2% |
| Warren, MI | $239,400 | 1.6% | 13.2% |
| Washington, DC | $449,600 | 1.4% | 11.4% |
| West Palm Beach, FL | $313,700 | 1.8% | 12.5% |
| Worcester, MA | $323,800 | 1.6% | 13.9% |
| National | $350,500 | 1.8% | 15.6% |


