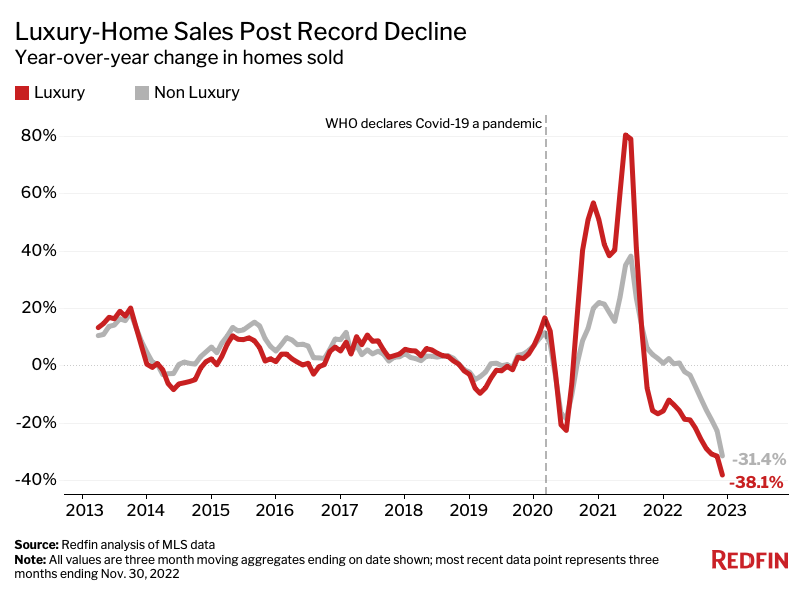
That outpaced the 31% decline in non luxury home sales—which was also a record drop—but there are early indicators that homebuyer demand may inch back.
Sales of luxury U.S. homes fell 38.1% year over year during the three months ending Nov. 30, 2022, the biggest decline on record. That outpaced the record 31.4% decline in sales of non-luxury homes. Redfin’s data goes back to 2012.
This is according to an analysis that divided all U.S. residential properties into tiers based on Redfin Estimates of the homes’ market values as of Dec. 10, 2022. This report defines luxury homes as those estimated to be in the top 5% based on market value, and non luxury homes as those estimated to be in the 35th-65th percentile based on market value.
The luxury market and the overall housing market have lost momentum this year due to many of the same factors: inflation, relatively high interest rates, a sagging stock market and recession fears. But the high-end market has slowed at a sharper clip for a handful of reasons, including:
- Luxury goods are often among the first to get cut from budgets during times of economic stress.
- Luxury properties are frequently used as investment properties, and with home values and rents poised to fall in 2023, investment prospects are lackluster.
- High-end home sales saw outsized growth during the pandemic, so they have more room to fall (see chart above).
- Affluent buyers often have significant funds stored in the stock market, which has been losing value.
Expensive coastal markets led the decline in high-end home sales. In Nassau County, NY (Long Island), luxury-home sales plummeted 65.6% year over year during the three months ending Nov. 30, the largest decline among the most populous U.S. metropolitan areas. Next came four California metros: San Diego (-60.4%), San Jose (-58.7%), Riverside (-55.6%) and Anaheim (-55.5%). These markets are prohibitively expensive for most buyers even when the economy is thriving, so it’s not surprising more buyers would back off during a downturn.
There are early signs that overall homebuyer demand is starting to creep back as interest rates decline, which may ultimately cause the decline in luxury sales to ease. Mortgage applications and Redfin’s Homebuyer Demand Index—a measure of requests for tours and other buying services—have both been on the rise, and Redfin real estate agents say they’re seeing more buyers move off of the sidelines.
“There has been a small shift in the market that’s not fully showing up in the data yet. With mortgage rates falling, a lot of house hunters see this as their moment to come back and compete,” said Seattle Redfin agent Shoshana Godwin. “Many of my buyers are taking out jumbo loans—mortgages typically used for purchases of high-end homes. While some data shows jumbo mortgage rates above 6%, some of my buyers are getting rates in the low 5% range.”
Luxury-Home Supply Rises Most in Six Years
The number of luxury U.S. homes for sale rose 5.2% year over year to roughly 163,000 during the three months ending Nov. 30, the largest increase since 2016. By comparison, the supply of non luxury homes declined 5.7% to about 552,000.
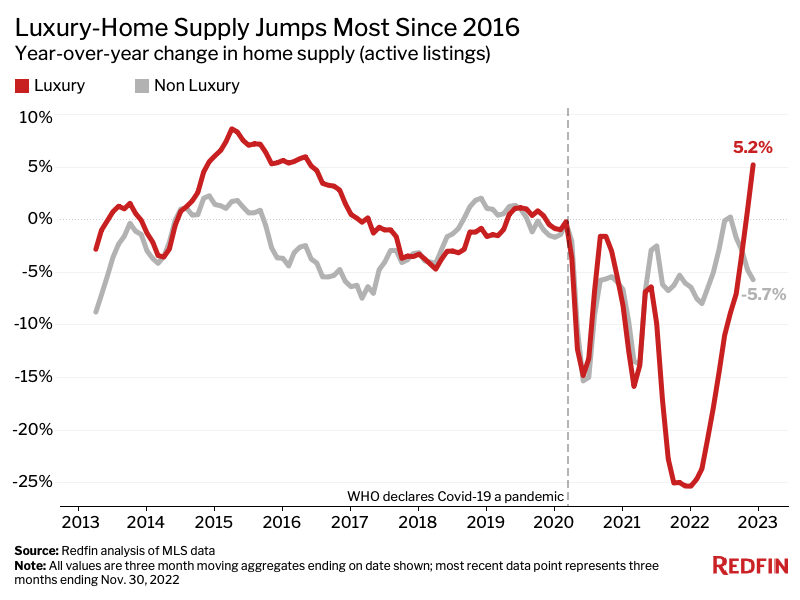
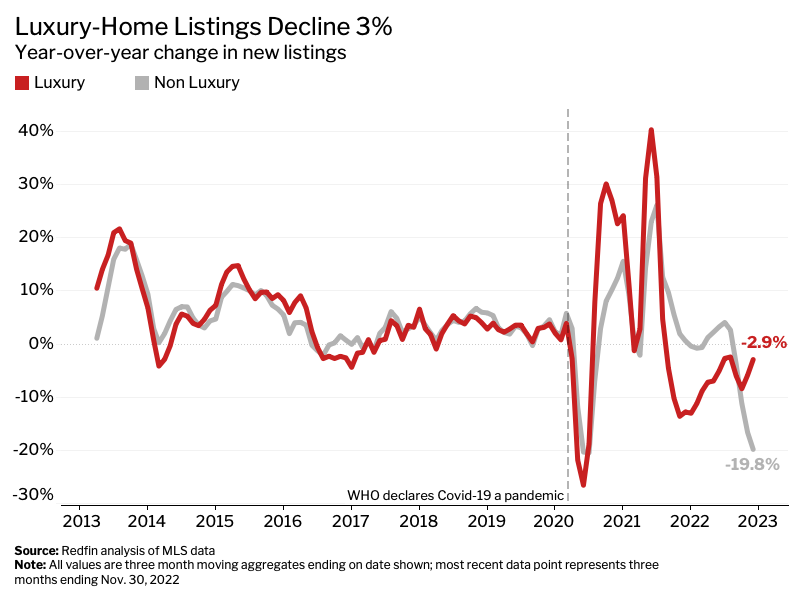
The large decline in luxury home sales is contributing to the rise in supply, but new listings are also a factor. New listings of luxury homes fell just 2.9% year over year during the three months ending Nov. 30, compared with a 19.8% drop in listings of non luxury homes.
Home-Price Growth Slows Across the Board
Home-price growth has slowed across the housing market due to ebbing demand. Prices of both luxury and non luxury homes rose 10% year over year during the three months ending Nov. 30, compared with 17% growth one year earlier. The median sale price was $1.1 million for luxury homes and $325,000 for non luxury homes.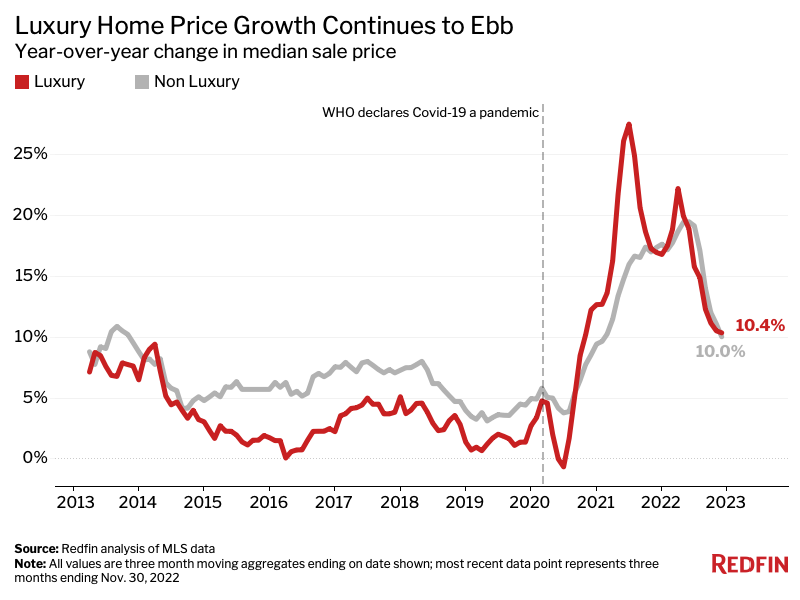
Metro-Level Highlights: Three Months Ending Nov. 30, 2022
Redfin’s metro-level data includes the 50 most populous U.S. metropolitan areas, with the exception of San Antonio, which we left out due to insufficient data. Scroll down to the table below to find data on your metro.
-
- Home sales: Luxury home sales fell in every metro. The biggest declines were in Nassau County (-65.6% YoY), San Diego (-60.4%), San Jose (-58.7%), Riverside (-55.6%) and Anaheim (-55.5%). The smallest decreases were in Kansas City, MO (-20.2%), Cleveland (-21.5%), Virginia Beach, VA (-26.2%) Milwaukee (-26.4%) and Charlotte, NC (-28.3%).
-
- Supply: Active listings of luxury homes rose in 21 metros, with the biggest increases in Austin, TX (51% YoY), Denver (50.1%), Nashville (35.7%), Warren, MI (29.8%) and Atlanta (25.9%). The largest declines were in San Jose (-32.2%), Anaheim (-22.5%), Los Angeles (-19.4%), St. Louis (-18.5%) and Miami (-16.6%).
-
- New listings: New listings of luxury homes fell in 39 metros. The biggest declines were in San Jose (-39.2% YoY), Oakland, CA (-37.1%), Anaheim (-29.8%), San Diego (-26.2%) and Orlando, FL (-25.9%) The largest gains were in Denver (44%), Warren (32.4%), Austin (20.2%), Detroit (16.3%) and Atlanta (15%).
-
- Prices: The median sale price of luxury homes rose in all but one metro—San Jose (-0.3% YoY). The biggest jumps were in Miami (28.1%), Tampa, FL (27.7%), Charlotte (25%), West Palm Beach, FL (25%) and Orlando (23.7%). The smallest increases were in San Francisco (0.1%), Nassau County (2.1%), Oakland (3.1%) and Portland, OR (5.8%).
Luxury Market Summary by Metro Area: Three Months Ending Nov. 30, 2022
| U.S. Metro Area | Homes Sold, YoY Change | Active Listings, YoY Change | New Listings, YoY Change | Median Sale Price | Median Sale Price, YoY Change |
| Anaheim, CA | -55.5% | -22.5% | -29.8% | $3,750,000 | 16.0% |
| Atlanta, GA | -47.6% | 25.9% | 15.0% | $1,150,000 | 21.1% |
| Austin, TX | -40.9% | 51.0% | 20.2% | $1,889,500 | 12.8% |
| Baltimore, MD | -42.3% | -13.7% | -22.1% | $1,047,100 | 8.3% |
| Boston, MA | -33.7% | 7.7% | 3.3% | $2,192,100 | 10.8% |
| Charlotte, NC | -28.3% | -11.8% | -22.3% | $1,250,000 | 25.0% |
| Chicago, IL | -35.3% | -7.7% | -24.9% | $1,066,000 | 7.7% |
| Cincinnati, OH | -38.8% | -15.1% | -18.1% | $767,200 | 14.5% |
| Cleveland, OH | -21.5% | -14.7% | -16.9% | $675,000 | 9.8% |
| Columbus, OH | -30.1% | -3.7% | -7.4% | $800,000 | 12.0% |
| Dallas, TX | -30.9% | 19.1% | 5.9% | $1,350,000 | 17.4% |
| Denver, CO | -33.9% | 50.1% | 44.0% | $1,680,000 | 15.1% |
| Detroit, MI | -41.0% | 20.9% | 16.3% | $600,000 | 8.1% |
| Fort Lauderdale, FL | -52.3% | -7.1% | -4.0% | $1,600,000 | 19.8% |
| Fort Worth, TX | -36.3% | 13.5% | -2.9% | $1,040,000 | 14.8% |
| Houston, TX | -36.4% | 2.1% | -1.5% | $1,095,000 | 15.0% |
| Indianapolis, IN | -34.1% | -8.4% | -22.8% | $794,000 | 11.1% |
| Jacksonville, FL | -44.7% | 12.0% | -5.2% | $1,355,600 | 23.2% |
| Kansas City, MO | -20.2% | -2.2% | -13.4% | $840,600 | 11.9% |
| Las Vegas, NV | -48.6% | 10.3% | -21.5% | $1,183,900 | 18.4% |
| Los Angeles, CA | -51.4% | -19.4% | -20.1% | $3,520,000 | 9.7% |
| Miami, FL | -53.8% | -16.6% | -18.6% | $2,825,000 | 28.1% |
| Milwaukee, WI | -26.4% | -9.0% | -12.5% | $850,000 | 11.8% |
| Minneapolis, MN | -33.1% | 2.9% | -8.3% | $965,000 | 9.9% |
| Montgomery County, PA | -34.1% | -14.4% | -14.8% | $1,210,000 | 11.2% |
| Nashville, TN | -28.8% | 35.7% | 10.5% | $1,595,000 | 11.9% |
| Nassau County, NY | -65.6% | -2.1% | -2.2% | $2,400,000 | 2.1% |
| New Brunswick, NJ | -37.4% | 4.3% | -10.7% | $1,725,000 | 18.6% |
| New York, NY | -37.9% | -9.1% | -5.0% | $3,650,000 | 10.6% |
| Newark, NJ | -39.7% | -5.9% | -9.1% | $1,500,000 | 17.6% |
| Oakland, CA | -53.7% | -14.0% | -37.1% | $2,680,000 | 3.1% |
| Orlando, FL | -47.3% | -1.2% | -25.9% | $1,063,800 | 23.7% |
| Philadelphia, PA | -40.7% | -10.2% | -7.4% | $991,500 | 14.6% |
| Phoenix, AZ | -45.2% | 11.4% | -7.0% | $1,550,000 | 14.8% |
| Pittsburgh, PA | -34.2% | 2.5% | -0.6% | $747,300 | 8.8% |
| Portland, OR | -43.0% | -0.2% | -12.8% | $1,280,000 | 5.8% |
| Providence, RI | -33.6% | -12.9% | -19.2% | $1,325,000 | 13.1% |
| Riverside, CA | -55.6% | -3.7% | -12.6% | $1,380,000 | 13.6% |
| Sacramento, CA | -41.0% | 6.6% | -21.3% | $1,455,000 | 7.8% |
| San Diego, CA | -60.4% | -15.9% | -26.2% | $3,158,500 | 14.9% |
| San Francisco, CA | -48.4% | -13.6% | -19.7% | $4,999,000 | 0.1% |
| San Jose, CA | -58.7% | -32.2% | -39.2% | $4,350,000 | -0.3% |
| Seattle, WA | -46.0% | 14.1% | -23.2% | $2,600,000 | 6.1% |
| St. Louis, MO | -40.5% | -18.5% | -19.4% | $790,500 | 9.8% |
| Tampa, FL | -43.8% | 10.2% | -14.8% | $1,325,000 | 27.7% |
| Virginia Beach, VA | -26.2% | 0.8% | 9.1% | $920,000 | 9.2% |
| Warren, MI | -37.4% | 29.8% | 32.4% | $800,000 | 6.7% |
| Washington, D.C. | -45.0% | -14.7% | -17.7% | $1,595,000 | 6.3% |
| West Palm Beach, FL | -43.0% | 6.7% | 5.2% | $2,750,000 | 25.0% |
| National—U.S.A. | -38.1% | 5.2% | -2.9% | $1,065,000 | 10.4% |
Non Luxury Market Summary by Metro Area: Three Months Ending Nov. 30, 2022
| U.S. Metro Area | Homes Sold, YoY Change | Active Listings, YoY Change | New Listings, YoY Change | Median Sale Price | Median Sale Price, YoY Change |
| Anaheim, CA | -40.6% | -10.9% | -29.7% | $950,000 | 10.5% |
| Atlanta, GA | -44.7% | 27.2% | 1.4% | $360,000 | 16.1% |
| Austin, TX | -33.4% | 18.8% | -29.5% | $500,000 | 9.7% |
| Baltimore, MD | -33.6% | -28.4% | -33.1% | $332,000 | 5.4% |
| Boston, MA | -28.0% | -21.8% | -28.0% | $647,000 | 7.8% |
| Charlotte, NC | -36.0% | 0.5% | -19.1% | $350,000 | 16.7% |
| Chicago, IL | -30.7% | -6.6% | -32.3% | $287,000 | 7.3% |
| Cincinnati, OH | -25.7% | -22.9% | -26.8% | $240,000 | 12.7% |
| Cleveland, OH | -24.8% | -25.3% | -29.1% | $189,000 | 11.2% |
| Columbus, OH | -28.1% | -12.4% | -18.6% | $277,000 | 10.8% |
| Dallas, TX | -24.6% | 17.2% | -13.6% | $391,000 | 15.0% |
| Denver, CO | -37.4% | 35.9% | 0.9% | $565,000 | 8.3% |
| Detroit, MI | -22.0% | 31.9% | 33.1% | $147,000 | 8.9% |
| Fort Lauderdale, FL | -29.4% | -14.3% | -18.9% | $390,000 | 20.0% |
| Fort Worth, TX | -21.1% | 21.7% | -6.7% | $325,900 | 12.4% |
| Houston, TX | -24.1% | 10.9% | -12.0% | $300,000 | 11.5% |
| Indianapolis, IN | -26.2% | -10.4% | -23.1% | $250,000 | 10.6% |
| Jacksonville, FL | -39.4% | 4.3% | -25.0% | $355,000 | 18.3% |
| Kansas City, MO | -27.1% | -20.1% | -27.1% | $260,000 | 8.3% |
| Las Vegas, NV | -49.3% | 5.4% | -36.2% | $400,000 | 8.1% |
| Los Angeles, CA | -40.3% | -14.7% | -33.4% | $799,000 | 6.5% |
| Miami, FL | -37.3% | -12.6% | -16.2% | $450,000 | 23.3% |
| Milwaukee, WI | -30.3% | -34.4% | -31.8% | $265,000 | 10.4% |
| Minneapolis, MN | -32.9% | -14.0% | -27.3% | $345,000 | 5.0% |
| Montgomery County, PA | -35.0% | -27.9% | -28.1% | $425,000 | 10.1% |
| Nashville, TN | -34.6% | 11.2% | -17.3% | $430,000 | 17.8% |
| Nassau County, NY | -39.9% | -25.1% | -33.5% | $615,000 | 9.6% |
| New Brunswick, NJ | -27.7% | -11.1% | -20.3% | $479,000 | 15.4% |
| New York, NY | -26.8% | -14.6% | -18.9% | $700,000 | 7.9% |
| Newark, NJ | -29.3% | -15.6% | -15.3% | $480,000 | 14.3% |
| Oakland, CA | -39.8% | -5.0% | -26.9% | $925,000 | 2.8% |
| Orlando, FL | -34.5% | 6.8% | -20.6% | $375,000 | 19.1% |
| Philadelphia, PA | -32.2% | -15.5% | -26.7% | $230,000 | 12.2% |
| Phoenix, AZ | -50.5% | 6.5% | -32.8% | $435,000 | 8.2% |
| Pittsburgh, PA | -26.1% | -22.4% | -29.1% | $188,000 | 7.4% |
| Portland, OR | -41.3% | -12.5% | -31.8% | $535,000 | 7.5% |
| Providence, RI | -33.1% | -29.5% | -32.9% | $415,000 | 12.8% |
| Riverside, CA | -39.8% | -6.5% | -30.7% | $550,000 | 12.2% |
| Sacramento, CA | -44.2% | -7.7% | -37.1% | $555,000 | 3.2% |
| San Diego, CA | -47.6% | -21.3% | -40.6% | $830,000 | 12.2% |
| San Francisco, CA | -35.8% | -12.8% | -22.1% | $1,415,000 | -0.4% |
| San Jose, CA | -38.6% | -20.2% | -34.5% | $1,389,000 | 2.9% |
| Seattle, WA | -41.9% | -2.4% | -28.6% | $760,000 | 6.3% |
| St. Louis, MO | -26.9% | -20.1% | -22.6% | $220,000 | 12.8% |
| Tampa, FL | -32.3% | 16.6% | -14.9% | $365,000 | 21.7% |
| Virginia Beach, VA | -32.8% | -23.8% | -30.1% | $305,000 | 10.9% |
| Warren, MI | -24.6% | 8.6% | 5.1% | $270,000 | 8.0% |
| Washington, DC | -40.4% | -15.4% | -27.8% | $499,000 | 6.4% |
| West Palm Beach, FL | -37.5% | 0.3% | -17.1% | $429,000 | 22.6% |
| National—U.S.A. | -31.4% | -5.7% | -19.8% | $325,000 | 10.0% |