
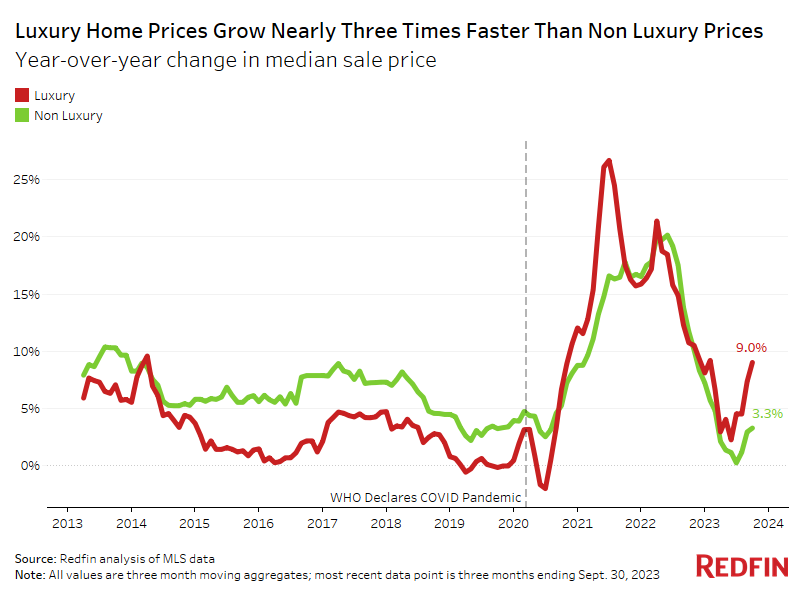
Luxury home prices rose 9% to the highest third-quarter level on record, growing nearly three times faster than non luxury prices. Luxury sales and listings also held up relatively well—a reversal from last year—as a rising share of high-end buyers escaped the pain of high mortgage rates by paying in cash.
The median sale price of luxury U.S. homes rose 9% year over year to $1.1 million in the third quarter, while the median sale price of non luxury homes climbed 3.3% to $340,000. Both were at the highest level of any third quarter on record.
This is according to an analysis that divided all U.S. residential properties into tiers based on Redfin Estimates of the homes’ market values as of Oct. 15, 2023. This report defines luxury homes as those estimated to be in the top 5% of their respective metro area based on market value, and non luxury homes as those estimated to be in the 35th-65th percentile based on market value.
43% of Luxury Home Purchases Are Paid for in Cash, Up From 35% Last Year
“Wealthy homebuyers have more tools to weather the storm of high mortgage rates,” said Redfin Senior Vice President of Real Estate Operations Jason Aleem. “Many of them can afford to pay in cash, meaning they’re escaping high mortgage rates altogether. Others are choosing to take on a higher rate and refinance later—an expensive option that isn’t feasible for a lot of lower-income consumers. Affluent Americans are still spending big, in large part because of pandemic savings and resilient housing and stock values.”
More than two in five (42.5%) luxury homes that sold in the third quarter were purchased in cash, up from just over one-third (34.6%) a year earlier. By comparison, just 28% of non luxury homes that sold were bought in cash, little changed from the third quarter of 2022.
“While many luxury buyers have the resources to forge ahead even when mortgage rates are elevated, stubbornly high rates and home prices will likely push some affluent house hunters to the sidelines in the coming months,” said Redfin Chief Economist Daryl Fairweather. “High costs, along with the uptick in the number of high-end homes for sale, could cause luxury price growth to cool.”
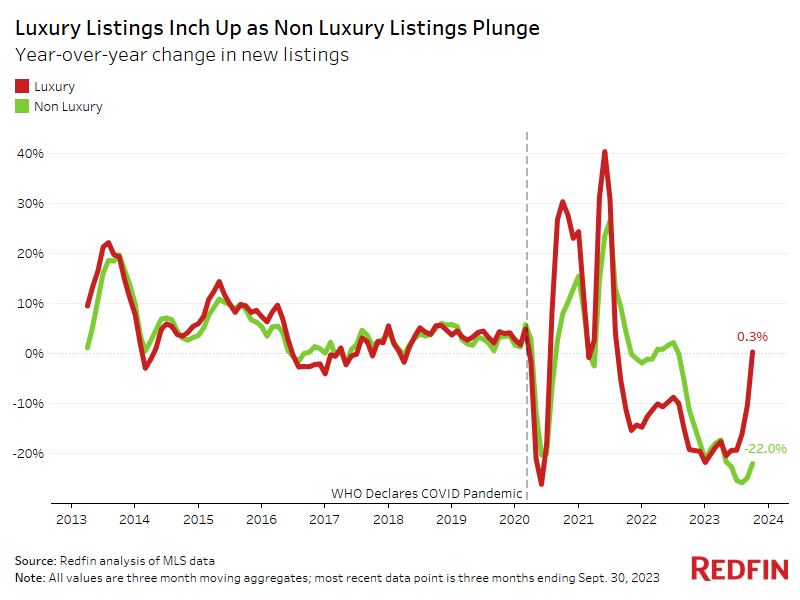
Housing Supply Is Up 3% in the Luxury Market—And Down 21% in the Non Luxury Market
The total supply of luxury homes for sale (active listings) grew 2.9% from a year earlier in the third quarter, compared with a record 20.8% decline in the supply of non luxury homes.
Similarly, luxury new listings rose 0.3%, while non luxury new listings fell 22%. Luxury new listings were below pre-pandemic levels, but not by much. Non luxury new listings, on the other hand, stood at the lowest third-quarter level since 2012.
This marks a reversal from last year, when both housing supply and sales were falling more sharply in the luxury market than in the non luxury market.
One reason luxury listings have held up relatively well is high-end homeowners are less likely to feel locked into their low mortgage rate, either because they don’t have a mortgage at all or because they have the means to move and take on a higher rate. Put another way, wealthy homeowners have more flexibility to relocate, which loosens up high-end housing inventory.
Another reason luxury listings are outperforming is an increase in homebuilding. Newly built homes tend to be more expensive, meaning they often fall into the luxury tier. It’s worth noting that building may start to slow because mortgage rates are now hovering around 8%—the highest level in more than two decades—which is curtailing homebuyer demand.
Luxury Home Sales Are Falling, But Not as Fast as Non Luxury Sales
Luxury home sales declined 10.6% year over year in the third quarter, compared with a 17% drop in non luxury sales.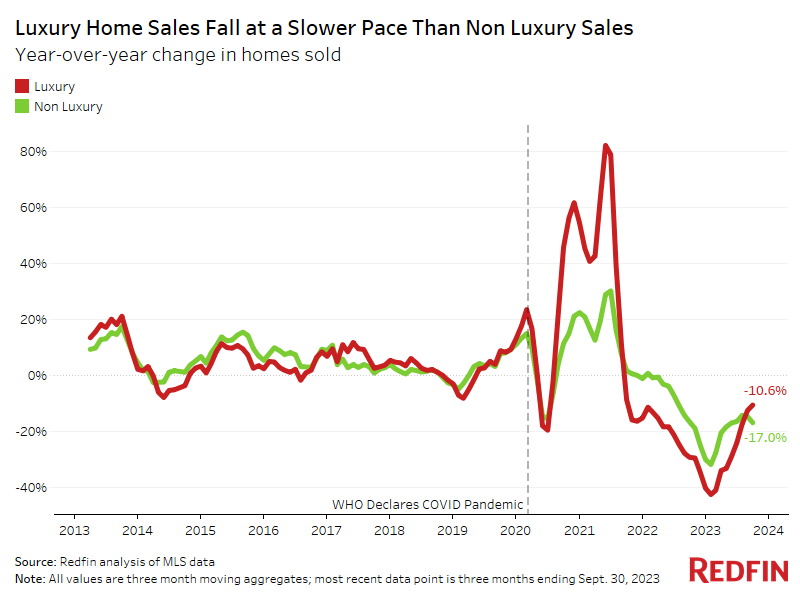
Home sales are still falling from a year ago across the board because mortgage rates have climbed so much. But the declines have eased—especially for luxury sales. That said, both luxury and non luxury home sales were at the lowest third-quarter levels since 2014.
Luxury Home Sales Jump 36% in Tampa, Which Is Home to Many Cash Buyers
While luxury home sales were down from a year earlier in most areas, 14 major U.S. metropolitan areas saw increases. In Tampa, FL, luxury sales surged 35.8% year over year in the third quarter—the largest increase in the country. Next came Las Vegas (33.4%), Austin, TX (14.5%), Sacramento, CA (10.1%) and San Francisco (9.6%).
“It’s an opportune time to be a cash buyer, and there are a lot of cash buyers in Florida,” said Redfin Tampa Sales Manager Eric Auciello. “We’re still seeing many affluent house hunters move in from the Northeast and West Coast because they want lower taxes, different politics and/or to be closer to family. Tampa also has a ton of new construction, a lot of which is high-end condos.”
Luxury new listings in Tampa rose 13.9% year over year in the third quarter, a larger increase than every metro but New York.
Rising flood insurance costs are likely another reason Tampa’s luxury market is outperforming its non luxury market, Auciello said. Cash buyers aren’t required to purchase flood insurance. And for luxury buyers who do take out mortgages, their high-end homes are often elevated further above the ocean and built more resiliently, which often makes them easier to insure. Additionally, affluent buyers are more likely to be able to afford rising insurance premiums.
Metro-Level Luxury Market Highlights: Q3 2023
Redfin’s metro-level data includes the 50 most populous U.S. metropolitan areas, with the exception of Houston, which we removed due to a data issue. All changes below are year-over-year changes.
- Prices: The median sale price of luxury homes rose most in New Brunswick, NJ (15.3%), Virginia Beach, VA (11%) and Baltimore (8.7%). It fell most in Austin, TX (-8.8%), Oakland, CA (-6%) and Seattle (-4.6%).
- Supply: Active listings of luxury homes rose most in Austin (46%), San Antonio (25.6%) and Nashville (22.9%). They fell most in Cincinnati (-19.4%), Chicago (-18.3%) and Newark, NJ (-16.6%).
- New listings: New listings of luxury homes rose most in New York (17.1%), Tampa, FL (13.9%) and San Antonio (12.7%). They fell most in Atlanta (-19.8%), Newark (-18.4%) and Chicago (-17.2%).
- Home sales: Luxury home sales rose most in Tampa (35.8%), Las Vegas (33.4%) and Austin (14.5%). They fell most in New York (-33.5%), Philadelphia (-23.2%) and Baltimore (-23%).
10 Most Expensive U.S. Home Sales: Q3 2023
- Aspen, CO: $76M
- Aspen, CO: $63.8M
- Miami Beach, FL: $57M
- New York, NY: $52M
- Palm Beach, FL: $50M
- Aspen, CO: $47.9M
- Carpinteria, CA: $46.9M
- New York, NY: $40M
- Miami Beach, FL: $36M
- Coral Gables, FL: $36M
Luxury Housing Market Summary by Metro Area: Q3 2023
| U.S. Metro Area | Median Sale Price | Median Sale Price, YoY Change | Active Listings, YoY Change | New Listings, YoY Change | Homes Sold, YoY Change | Median Days On Market |
|---|---|---|---|---|---|---|
| Anaheim, CA | $3,900,000 | 2.6% | 0.1% | 5.1% | -5.5% | 41 |
| Atlanta, GA | $1,250,000 | 4.2% | -13.6% | -19.8% | -13.5% | 30 |
| Austin, TX | $1,778,000 | -8.8% | 46.0% | 9.9% | 14.5% | 69 |
| Baltimore, MD | $1,125,000 | 8.7% | -13.1% | -9.8% | -23.0% | 28 |
| Boston, MA | $2,250,000 | 2.3% | 6.4% | 5.2% | -12.9% | 26 |
| Charlotte, NC | $1,300,000 | 8.3% | 0.8% | 4.2% | -14.7% | 40 |
| Chicago, IL | $1,215,000 | 8.0% | -18.3% | -17.2% | -17.6% | 64 |
| Cincinnati, OH | $785,000 | 2.4% | -19.4% | -5.5% | -19.6% | 14 |
| Cleveland, OH | $713,500 | 6.3% | -1.8% | 3.3% | -18.7% | 22 |
| Columbus, OH | $850,000 | 5.1% | 1.3% | -3.0% | -10.0% | 40 |
| Dallas, TX | $1,375,000 | 2.0% | 13.0% | 6.9% | 3.4% | 37 |
| Denver, CO | $1,690,000 | 0.9% | 20.3% | 11.0% | -5.8% | 17 |
| Detroit, MI | $649,900 | 7.4% | -16.1% | -5.5% | -4.3% | 16 |
| Fort Lauderdale, FL | $1,600,000 | 4.9% | 3.2% | -14.2% | -16.2% | 84 |
| Fort Worth, TX | $1,077,500 | 0.2% | 11.4% | -7.2% | -7.6% | 44 |
| Indianapolis, IN | $830,000 | 6.3% | 8.1% | 9.0% | -5.1% | 16 |
| Jacksonville, FL | $1,295,000 | 3.6% | 4.6% | 2.2% | 1.9% | 42 |
| Kansas City, MO | $880,000 | 6.5% | 2.3% | -6.1% | -18.8% | 32 |
| Las Vegas, NV | $1,175,000 | -1.4% | -9.6% | -4.8% | 33.4% | 63 |
| Los Angeles, CA | $3,400,000 | -2.0% | 6.4% | -1.0% | -7.7% | 48 |
| Miami, FL | $2,850,000 | 1.8% | 7.0% | 8.3% | -10.7% | 125 |
| Milwaukee, WI | $915,000 | 8.4% | -9.0% | -9.4% | -22.5% | 57 |
| Minneapolis, MN | $1,000,000 | 2.6% | 9.9% | 4.8% | -6.0% | 22 |
| Montgomery County, PA | $1,283,100 | 6.9% | -13.5% | -13.1% | -19.7% | 21 |
| Nashville, TN | $1,700,000 | 6.3% | 22.9% | 4.6% | -7.6% | 66 |
| Nassau County, NY | $2,400,000 | 5.6% | 6.2% | 10.8% | -0.6% | 43 |
| New Brunswick, NJ | $1,850,000 | 15.3% | -11.3% | 4.4% | -20.4% | 39 |
| New York, NY | $3,395,000 | 3.0% | 0.5% | 17.1% | -33.5% | 72 |
| Newark, NJ | $1,625,000 | 7.7% | -16.6% | -18.4% | -22.7% | 16 |
| Oakland, CA | $2,750,000 | -6.0% | -9.0% | -1.3% | 4.1% | 13 |
| Orlando, FL | $1,170,000 | 6.4% | 2.4% | 0.6% | 1.4% | 25 |
| Philadelphia, PA | $993,000 | 2.4% | 2.4% | 1.2% | -23.2% | 40 |
| Phoenix, AZ | $1,577,500 | 0.2% | 1.3% | 2.6% | 9.5% | 59 |
| Pittsburgh, PA | $750,000 | 2.2% | 2.2% | 2.3% | -15.8% | 60 |
| Portland, OR | $1,317,700 | -0.6% | 7.1% | 2.4% | -6.9% | 23 |
| Providence, RI | $1,300,000 | 2.8% | -6.3% | -13.0% | -17.8% | 29 |
| Riverside, CA | $1,380,000 | 2.2% | -2.0% | -1.5% | -10.5% | 50 |
| Sacramento, CA | $1,500,000 | 0.0% | 8.2% | 8.9% | 10.1% | 35 |
| San Antonio, TX | $964,000 | 4.2% | 25.6% | 12.7% | -16.1% | 47 |
| San Diego, CA | $3,250,000 | 2.8% | 7.0% | 1.4% | 2.0% | 33 |
| San Francisco, CA | $4,936,000 | -1.8% | 17.3% | 11.3% | 9.6% | 42 |
| San Jose, CA | $4,572,500 | 2.8% | -7.2% | -4.8% | 1.8% | 13 |
| Seattle, WA | $2,575,000 | -4.6% | -0.6% | -1.2% | 7.3% | 13 |
| St. Louis, MO | $847,500 | 8.0% | 0.6% | 4.6% | -1.3% | 12 |
| Tampa, FL | $1,306,500 | -3.2% | 22.5% | 13.9% | 35.8% | 23 |
| Virginia Beach, VA | $999,000 | 11.0% | -9.0% | -12.2% | -11.8% | 34 |
| Warren, MI | $846,000 | 5.5% | -7.9% | -4.0% | -15.1% | 24 |
| Washington, D.C. | $1,662,200 | 5.1% | 2.0% | -1.9% | -4.4% | 36 |
| West Palm Beach, FL | $2,917,000 | 8.0% | 18.9% | 5.4% | 6.5% | 83 |
| National—U.S.A. | $1,134,000 | 9.0% | 2.9% | 0.3% | -10.6% | 40 |
Non Luxury Housing Market Summary by Metro Area: Q3 2023
| U.S. Metro Area | Median Sale Price | Median Sale Price, YoY Change | Active Listings, YoY Change | New Listings, YoY Change | Homes Sold, YoY Change | Median Days On Market |
|---|---|---|---|---|---|---|
| Anaheim, CA | $1,010,000 | 4.3% | -28.9% | -20.9% | -9.1% | 26 |
| Atlanta, GA | $377,000 | 1.9% | -26.8% | -34.9% | -16.6% | 26 |
| Austin, TX | $457,900 | -10.0% | -10.4% | -24.0% | -13.1% | 54 |
| Baltimore, MD | $357,000 | 3.5% | -29.5% | -27.9% | -25.4% | 11 |
| Boston, MA | $677,000 | 4.2% | -30.5% | -25.0% | -27.5% | 19 |
| Charlotte, NC | $360,000 | 1.4% | -11.4% | -18.1% | -13.5% | 36 |
| Chicago, IL | $305,000 | 5.2% | -26.0% | -20.9% | -16.9% | 46 |
| Cincinnati, OH | $255,000 | 6.3% | -33.6% | -22.2% | -23.0% | 7 |
| Cleveland, OH | $205,000 | 6.8% | -25.0% | -21.6% | -17.8% | 11 |
| Columbus, OH | $298,800 | 6.7% | -19.6% | -20.2% | -18.2% | 34 |
| Dallas, TX | $390,000 | -3.0% | -9.2% | -15.6% | -9.5% | 32 |
| Denver, CO | $566,300 | -2.0% | -20.4% | -21.2% | -13.6% | 14 |
| Detroit, MI | $157,000 | 3.3% | -20.4% | -19.3% | -13.3% | 13 |
| Fort Lauderdale, FL | $410,000 | 6.0% | -5.9% | -11.8% | -9.1% | 43 |
| Fort Worth, TX | $325,000 | -3.7% | -9.4% | -20.7% | -8.9% | 31 |
| Indianapolis, IN | $265,000 | 4.5% | -20.0% | -24.4% | -25.2% | 9 |
| Jacksonville, FL | $352,500 | -0.4% | -13.6% | -25.7% | -0.5% | 44 |
| Kansas City, MO | $278,000 | 3.7% | -17.7% | -22.0% | -19.6% | 15 |
| Las Vegas, NV | $398,500 | -6.2% | -39.0% | -40.1% | -3.4% | 31 |
| Los Angeles, CA | $815,000 | 0.6% | -30.7% | -23.6% | -17.2% | 31 |
| Miami, FL | $480,000 | 8.8% | -15.7% | -17.4% | -12.5% | 43 |
| Milwaukee, WI | $290,000 | 8.6% | -24.3% | -14.5% | -25.9% | 36 |
| Minneapolis, MN | $360,000 | 1.4% | -17.7% | -17.0% | -14.0% | 16 |
| Montgomery County, PA | $450,000 | 7.1% | -20.0% | -16.3% | -22.7% | 12 |
| Nashville, TN | $430,000 | 0.4% | -7.9% | -21.4% | -12.5% | 44 |
| Nassau County, NY | $630,000 | 4.1% | -32.6% | -25.7% | -19.5% | 23 |
| New Brunswick, NJ | $511,000 | 9.2% | -34.7% | -27.0% | -23.4% | 23 |
| New York, NY | $717,000 | 3.9% | -24.2% | -24.3% | -28.5% | 45 |
| Newark, NJ | $518,000 | 11.4% | -32.2% | -27.2% | -30.4% | 23 |
| Oakland, CA | $925,000 | -2.6% | -15.7% | -0.7% | -12.7% | 13 |
| Orlando, FL | $380,000 | 0.9% | -10.7% | -13.9% | -7.3% | 19 |
| Philadelphia, PA | $245,000 | 7.9% | -19.1% | -22.1% | -22.8% | 36 |
| Phoenix, AZ | $430,000 | -6.5% | -33.7% | -33.4% | -3.0% | 38 |
| Pittsburgh, PA | $200,000 | 4.2% | -24.7% | -23.8% | -20.4% | 47 |
| Portland, OR | $538,000 | -1.3% | -28.3% | -27.8% | -18.6% | 13 |
| Providence, RI | $445,000 | 8.5% | -31.6% | -26.2% | -21.2% | 20 |
| Riverside, CA | $550,000 | -0.9% | -31.4% | -28.0% | -19.7% | 33 |
| Sacramento, CA | $558,500 | -2.9% | -32.8% | -25.6% | -12.9% | 15 |
| San Antonio, TX | $294,500 | -0.2% | -7.8% | -20.7% | -20.8% | 44 |
| San Diego, CA | $855,000 | 2.4% | -37.1% | -27.9% | -14.3% | 13 |
| San Francisco, CA | $1,365,000 | -3.8% | -23.9% | -19.6% | -16.5% | 19 |
| San Jose, CA | $1,470,000 | 4.3% | -29.1% | -11.8% | -18.7% | 10 |
| Seattle, WA | $765,000 | -3.8% | -30.5% | -24.6% | -16.5% | 9 |
| St. Louis, MO | $230,000 | 5.0% | -16.0% | -15.5% | -20.1% | 10 |
| Tampa, FL | $368,000 | -0.5% | -17.4% | -21.3% | -4.4% | 19 |
| Virginia Beach, VA | $330,000 | 6.8% | -22.8% | -20.7% | -24.4% | 20 |
| Warren, MI | $285,000 | 3.6% | -23.7% | -19.3% | -19.4% | 13 |
| Washington, D.C. | $516,100 | 1.2% | -23.0% | -19.8% | -18.0% | 26 |
| West Palm Beach, FL | $445,000 | 6.0% | -11.2% | -19.2% | -7.4% | 51 |
| National—U.S.A. | $340,000 | 3.3% | -20.8% | -22.0% | -17.0% | 27 |


