
Prospective homebuyers are getting some relief as monthly housing payments fall from their peak due to declining mortgage rates and home prices. It’s one reason for renewed homebuyer interest.
The median monthly housing payment for San Francisco homebuyers has dropped 14.8%, from $9,973 to $8,496, since mortgage rates hit their pandemic-era peak in October, the biggest percentage decline of the 49 most populous U.S. metros.
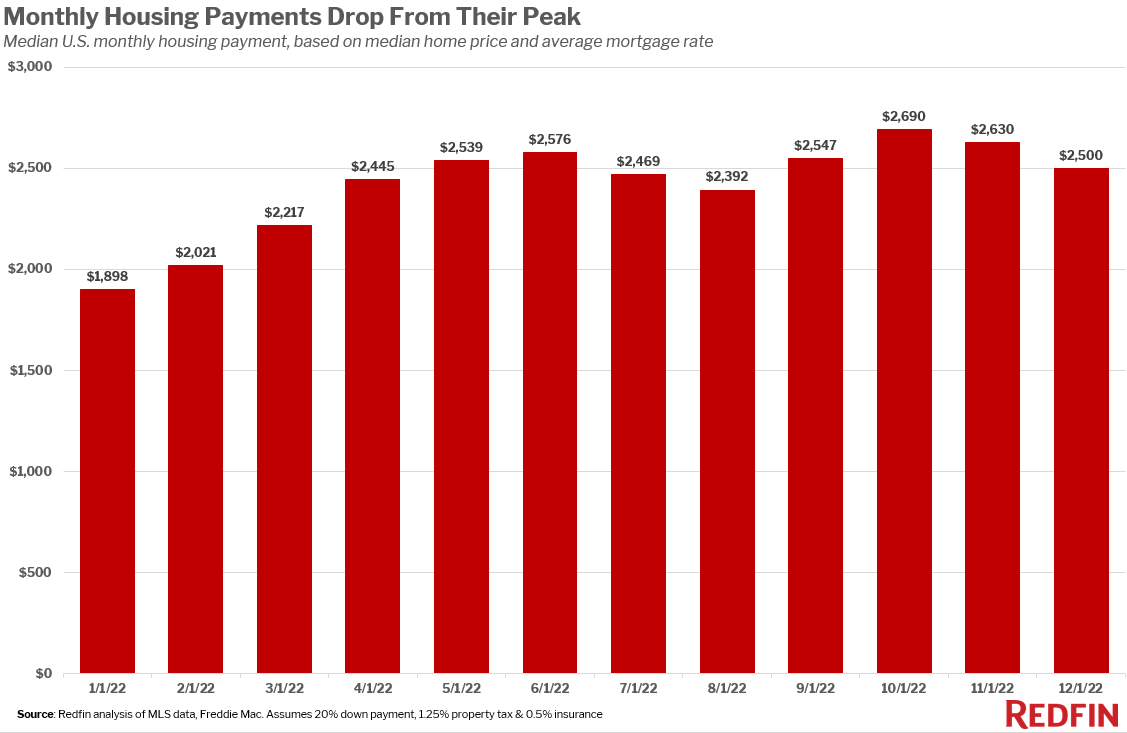
The San Francisco drop is more than double the nationwide decline of 7% (to $2,500). The typical monthly housing payment fell from October 2022 to December 2022 in all the metros in this analysis, with the biggest drops in West Coast tech hubs and some of the nation’s most affordable areas.
Next come Pittsburgh, with the typical monthly payment falling 12.4% to $1,267, Seattle (-12.1% to $4,509), Oakland, CA (-11.6% to $5,443), Detroit (-11.3% to $1,050) and San Jose, CA (-10.6% to $8,116).
Although the typical U.S. monthly housing payment is coming down from its peak, it’s still much higher than it was a year ago, when mortgage rates were averaging 3.5% and the typical U.S. home sold for $378,000. The average 30-year fixed mortgage rate dropped from 6.9% in October to 6.36% in December, and the median U.S. home-sale price dropped from $400,000 to $388,000.
The drop in housing costs has helped fuel a notable uptick in homebuyer demand following a nearly yearlong slump in the housing market. Pending home sales rose 3% in December, the first monthly increase in 14 months. In San Jose, pending sales were up 21%—more than any other metro Redfin analyzed.
In more recent weeks, slowing inflation has sent mortgage rates down further, resulting in lower monthly housing payments and piquing the interest of some sidelined buyers.
“Now that rates are down, a lot of Bay Area house hunters are starting to tour homes and make offers again. We’re in a sweet spot where prices and rates have dropped enough to make a meaningful difference in housing payments but there’s still less competition than there has been for the last few years,” said San Jose Redfin agent Angela Langone. “But competition has started to ramp up as more buyers are back in the market and new listings remain scarce.”
Bay Area home prices have dropped
Monthly housing payments dropped most in tech hubs, along with Pittsburgh and Detroit, because home prices are declining faster in those places than in other parts of the country.
San Francisco, San Jose, Oakland, Seattle, Pittsburgh and Detroit were all among the 19 U.S. metros where sale prices declined from a year earlier in December, and their drops were among the biggest.
Home prices have declined fastest in the Bay Area for several reasons. It’s the most expensive part of the country– the typical San Francisco home sold for $1.3 million in December even after an 11% year-over-year price decline–which means prices had a lot of room to fall. Additionally, the Bay Area isn’t as popular as it once was because the prevalence of remote work means many people don’t need to commute to the office.
Bay Area- and Seattle-based tech workers have also been hit hard by the economic downturn, with a surge of layoffs in the industry and stumbling stock prices. Lower stock prices means less money for down payments, and unemployment or the prospect of it means fewer people are searching for homes. But tech stocks have already begun to tick up in the new year and most laid-off tech workers are finding a new job quickly.
| Change in Median Monthly Housing Payment by U.S. Metro, October 2022 to December 2022 | ||||
| U.S. metro area | Payment change: Percentage | Payment change: Dollars | Monthly housing payment: Oct. 2022 | Monthly housing payment: Dec. 2022 |
| San Francisco, CA | -14.8% | -$1,477 | $9,973 | $8,496 |
| Pittsburgh, PA | -12.4% | -$179 | $1,446 | $1,267 |
| Seattle, WA | -12.1% | -$620 | $5,129 | $4,509 |
| Oakland, CA | -11.6% | -$712 | $6,155 | $5,443 |
| Detroit, MI | -11.3% | -$134 | $1,184 | $1,050 |
| San Jose, CA | -10.6% | -$965 | $9,082 | $8,116 |
| Portland, OR | -9.8% | -$357 | $3,633 | $3,275 |
| Washington, DC | -9.8% | -$340 | $3,464 | $3,124 |
| Phoenix, AZ | -9.6% | -$289 | $3,027 | $2,738 |
| Chicago, IL | -9% | -$182 | $2,018 | $1,836 |
| Kansas City, MO | -9% | -$182 | $2,018 | $1,836 |
| Sacramento, CA | -8.7% | -$315 | $3,633 | $3,317 |
| New Brunswick, NJ | -8.4% | -$260 | $3,094 | $2,834 |
| Dallas, TX | -8.4% | -$236 | $2,825 | $2,589 |
| Miami, FL | -8.3% | -$265 | $3,195 | $2,931 |
| Boston, MA | -8.1% | -$342 | $4,238 | $3,896 |
| Cleveland, OH | -7.8% | -$105 | $1,345 | $1,240 |
| Warren, MI | -7.8% | -$142 | $1,816 | $1,674 |
| Milwaukee, WI | -7.8% | -$143 | $1,850 | $1,707 |
| Austin, TX | -7.7% | -$245 | $3,195 | $2,950 |
| Los Angeles, CA | -7.7% | -$426 | $5,550 | $5,124 |
| Minneapolis, MN | -7.7% | -$184 | $2,407 | $2,222 |
| Denver, CO | -7.6% | -$292 | $3,834 | $3,543 |
| Nassau County, NY | -7.5% | -$310 | $4,104 | $3,794 |
| Jacksonville, FL | -7.4% | -$181 | $2,435 | $2,255 |
| Montgomery County, PA | -7.4% | -$212 | $2,859 | $2,647 |
| New York, NY | -7.2% | -$317 | $4,440 | $4,123 |
| Anaheim, CA | -6.7% | -$428 | $6,354 | $5,926 |
| Fort Lauderdale, FL | -6.7% | -$176 | $2,624 | $2,448 |
| San Diego, CA | -6.7% | -$353 | $5,281 | $4,928 |
| Las Vegas, NV | -6.6% | -$182 | $2,758 | $2,577 |
| Providence, RI | -6.6% | -$183 | $2,792 | $2,609 |
| West Palm Beach, FL | -6.5% | -$186 | $2,859 | $2,673 |
| Atlanta, GA | -6.3% | -$157 | $2,489 | $2,332 |
| St. Louis, MO | -6.3% | -$99 | $1,581 | $1,482 |
| Cincinnati, OH | -6.2% | -$104 | $1,682 | $1,578 |
| Indianapolis, IN | -6% | -$111 | $1,850 | $1,739 |
| Riverside, CA | -5.8% | -$211 | $3,592 | $3,382 |
| Baltimore, MD | -5.7% | -$130 | $2,287 | $2,157 |
| Tampa, FL | -5.5% | -$139 | $2,523 | $2,383 |
| Orlando, FL | -5.5% | -$144 | $2,624 | $2,480 |
| Columbus, OH | -5% | -$100 | $2,018 | $1,918 |
| Fort Worth, TX | -4.9% | -$119 | $2,422 | $2,303 |
| Newark, NJ | -4.9% | -$151 | $3,094 | $2,944 |
| Charlotte, NC | -4.5% | -$117 | $2,597 | $2,480 |
| Virginia Beach, VA | -4.4% | -$92 | $2,085 | $1,993 |
| Houston, TX | -4.2% | -$94 | $2,220 | $2,126 |
| Nashville, TN | -3.2% | -$95 | $2,994 | $2,899 |
| Philadelphia, PA | -3.1% | -$54 | $1,722 | $1,668 |
Methodology
This report is based on a Redfin analysis that compares median monthly housing payments in October 2022 and December 2022 using MLS and Freddie Mac data. For this analysis, housing payments are made up of principal, mortgage interest, annual property taxes of 1.25% of the purchase price and annual insurance of 0.5% of the purchase price.
“Homebuyers” refers to buyers who are taking out a 30-year fixed-rate mortgage; some buyers pay all cash and others use other mortgage types.
We included the 49 most populous U.S. metros with sufficient housing and mortgage data in this analysis.


