
In a strong seller’s market, some homeowners are realizing they can attract bidders without offering as high of a percentage to the buyer’s agent.
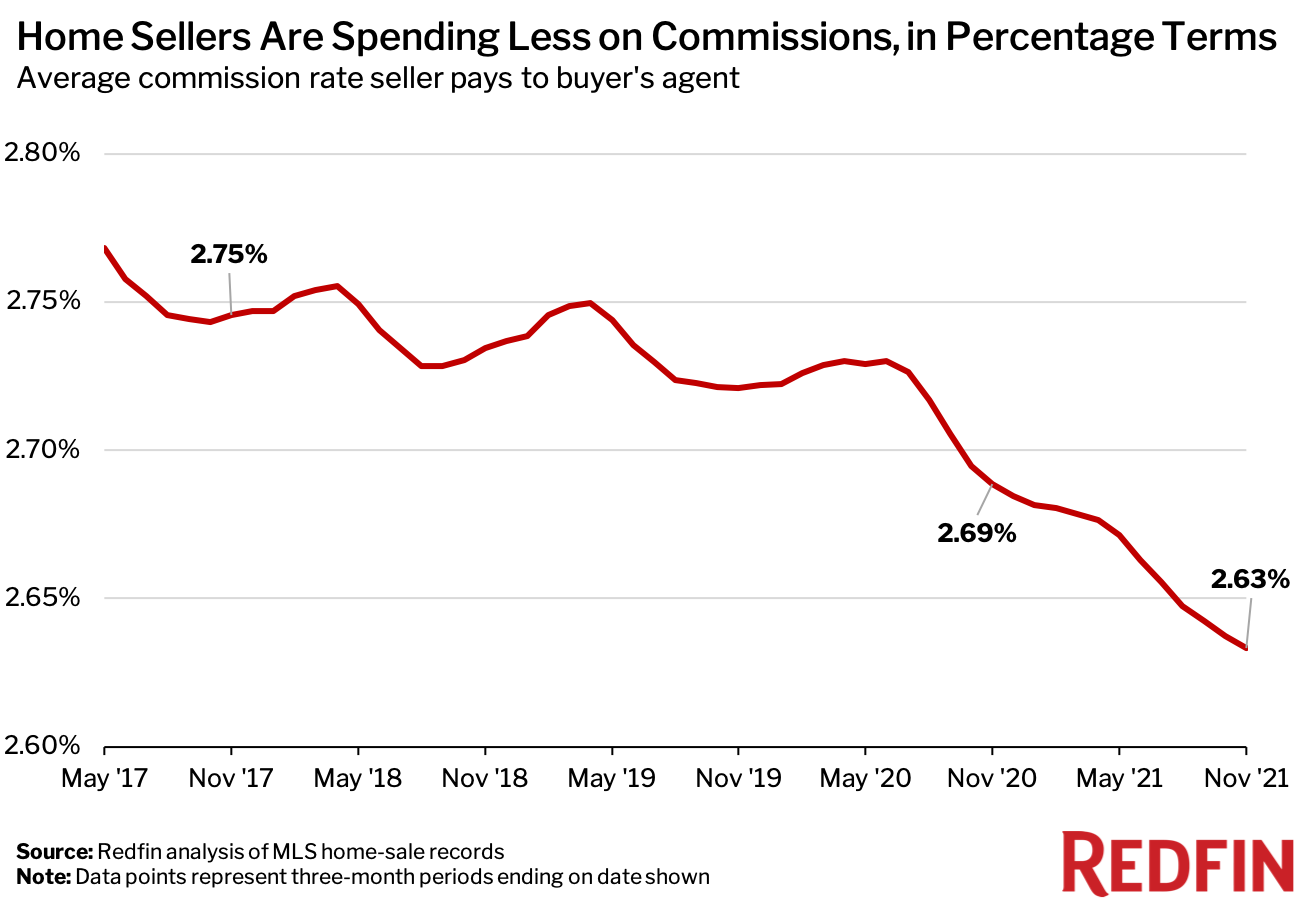
- The typical home seller pays the agent representing the buyer a fee equal to 2.63% of the sale price, down from 2.69% in 2020 and 2.75% in 2017.
- A fiercely competitive housing market is likely one reason for the decline, with sellers realizing they’ll be able to attract bidders regardless of what they offer the buyer’s agent.
- While the buy-side commission rate has fallen in percentage terms, it has risen in dollar terms—a function of surging home prices; the typical seller pays the buyer’s agent $12,415, up from $11,608 in 2020 and $9,610 in 2017.
The typical commission paid to brokerages representing homebuyers was 2.63% of the home-sale price during the three months ending Nov. 30, 2021—down from 2.69% a year earlier and the lowest rate in Redfin’s records, which date back to 2017.
In a typical home sale transaction, the seller covers the cost of the fees of both their agent and the buyer’s agent. The total commission rate has hovered around 5% for the past two decades, with about half paid to the seller’s agent and half to the buyer’s agent. That’s down from a total of around 6% in the 1990s. This report focuses on the portion of the fee paid to the buyer’s agent.
Seller Independence, Fierce Competition May Be Contributing to the Falling Commission Rate
Some sellers are offering lower commissions because they’ve become less reliant on the buyer’s agent to bring in buyers, Redfin agents say. Nearly all homebuyers (95%) searched for a home online last year, and they were twice as likely to have searched online than contacted an agent as the first step in their homebuying process, a report from the National Association of Realtors (NAR) found. Today’s competitive housing market may be accelerating the decline in the buy-side commission rate, with sellers and their agents realizing they’ll likely be able to find a buyer regardless of the commission they offer to the buyer’s agent.
“We’re experiencing a historic shortage of houses for sale. Sellers know their home is a hot commodity and will likely attract multiple offers no matter what, so they’ve started offering the buyer’s agents a 2% or 2.5% fee instead of 3%,” said Joe Hunt, Redfin’s market manager in Phoenix. “Why would you offer 3% when you know you could offer less and sell your home for the same price?”
Owners of homes priced $500,000 and below are most likely to offer a lower fee to the buyer’s agent, as properties in this price range are the most sought after, Hunt added.
With more real-estate agents than homes for sale, agents are also likely competing with one another for clients by accepting lower fees.
Another factor at play is increasing transparency. Some real estate websites, including Redfin, last year started publishing buyer’s agent commission rates in select markets. In November, NAR passed a policy requiring multiple listing services to allow brokerages and agents to display buyer’s agent commissions on their websites, which will bring commission transparency to even more markets in 2022. Consequently, more consumers may discover that some home sellers and home-selling companies (iBuyers) are already paying lower commissions, and follow suit.
Additionally, the real estate industry has been facing scrutiny over the way commissions are paid. The Department of Justice has an open probe into real estate industry practices and two consumer class action suits are making their way through the courts. The plaintiffs claim that NAR’s policy requiring listing brokerages to offer compensation to buyers’ brokerages in order to market homes in the MLS has limited competition and resulted in sellers paying high fees.
“The lawsuits and DOJ investigation are not currently having a major influence on commission rates, but the industry is watching closely to see whether they could result in buyers becoming responsible for paying their own agents,” Redfin Chief Economist Daryl Fairweather said. “If that happens, buyers will likely be much more eager to negotiate commissions.”
In Dollar Terms, Commissions Earned by Buyers’ Agents Have Climbed
While the average commission rate has been declining, the dollar value of buy-side commissions has been on the rise. At $12,415, the average commission fee a buyer’s agent received during the three months ending Nov. 30 was up 6.9% from a year earlier and up 29.2% from the same period in 2017. That’s a function of rising home prices. The median sale price of U.S. homes surged 15% year over year to $383,100 in November, marking the 16th-straight month of double-digit price gains.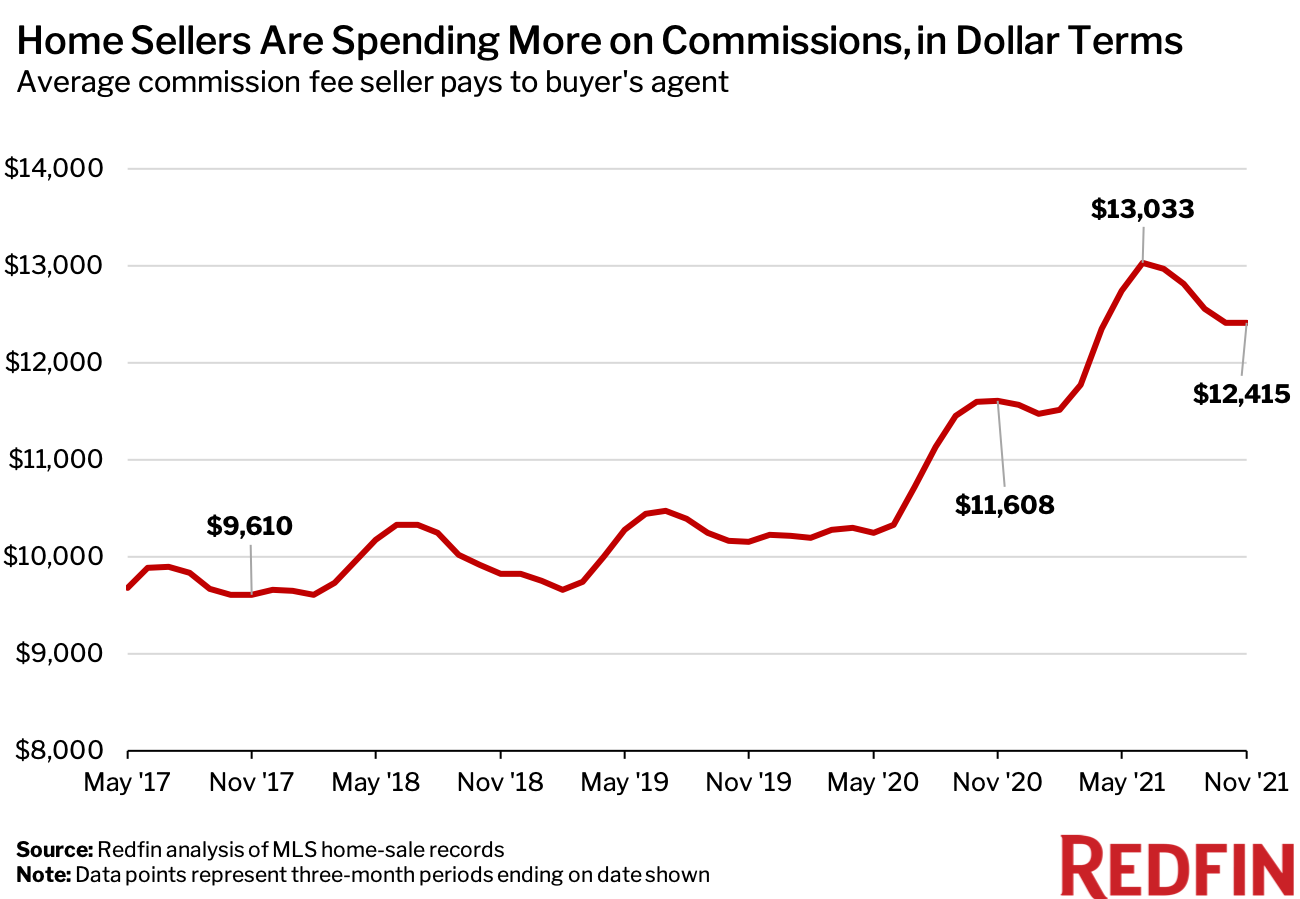
“One might think the surge in home prices that’s driving up commissions in dollar terms is also what’s causing sellers to offer lower commission in percentage terms, but that’s likely not the case,” Fairweather said. “Instead, sellers are probably offering lower commission rates because they realize that a well-priced home in this extreme seller’s market will likely attract buyers on its own.”
Fairweather continued: “With home prices so high, the seller, their agent and the buyer’s agent are splitting a pie of funds that’s bigger than ever. So even though the buyer’s agent is technically getting a smaller share of the pie, their check is 6.9% bigger than it was a year ago. That could change if home prices start to level off.”
Indianapolis, Riverside and Phoenix Have Seen Among the Largest Drops in Buy-Side Commission Rates
Of the 100 most populous U.S. metropolitan areas, there were only 32 for which there was sufficient commissions data. This section focuses on those metros. To see a table with the full data for all 32 metros, scroll down to the bottom of this report.
In Indianapolis, the average commission rate during the three months ending Nov. 30 was 2.85%, down 0.21 percentage points. Indianapolis tied for the biggest drop with Riverside, CA and Phoenix, which also saw 0.21-percentage-point declines. Next came Anaheim, CA, down 0.14 percentage points, followed by Atlanta and New Brunswick, NJ, both with declines of 0.12 percentage points.
While sky-high homebuyer competition is likely the main factor giving sellers the confidence to offer lower commissions in Phoenix, the presence of iBuying businesses could also be a factor, according to Hunt. Phoenix is one of the largest markets for home-selling companies known as iBuyers, which have been experimenting with paying lower commissions to trim costs.
iBuyers purchase houses from homeowners in quick cash transactions, make any necessary improvements, and then resell them. When an iBuyer resells a home, it pays a commission to the buyer’s agent, just like an individual home seller does. In Phoenix, iBuyers paid a 2.28% average commission in the third quarter of 2021, down from 2.57% a year earlier. Over the same period, the average buy-side commission rate in Phoenix overall fell to 2.54% from 2.77%. The decline in commissions paid by iBuyers may be one factor putting downward pressure on the overall commission rate in markets like Phoenix, Hunt said.
Chicago was the only metro in this analysis that saw an increase in the commission rate; the typical seller paid the buyer’s agent a commission equal to 2.47% of the sale price during the three months ending Nov. 30, up 0.1 percentage point from a year earlier.
New York and Massachusetts Have Relatively Low Commission Rates
In Nassau County, NY, home sellers paid a 1.98% average commission to the buyer’s agent during the three months ending Nov. 30—the lowest rate among the 32 metros in this analysis. Nassau County was the only metro with an average commission rate below 2%. Next came Boston (2.21%), Riverside (2.22%), Anaheim (2.25%) and New Brunswick (2.3%).
“In New York, Massachusetts and a handful of other states, the law requires real estate attorneys to preside over home closings,” Fairweather said. “That means the buyer’s agent has less responsibility in some cases, which may be one factor contributing to lower buy-side commissions in these states.”
At 2.94%, Kansas City, MO and Columbus, OH had the highest commission rates of the 32 metros in this analysis. Next came Austin, TX (2.92%), Virginia Beach, VA (2.91%), Houston (2.90%) and Dallas (2.88%).
Buy-Side Commission Summary by Metro Area
| U.S. Metro Area | Average buy-side commission ($), three months ending Nov. 30, 2021 | Average buy-side commission (%), three months ending Nov. 30, 2021 | Average buy-side commission ($), three months ending Nov. 30, 2020 | Average buy-side commission (%), three months ending Nov. 30, 2020 |
|---|---|---|---|---|
| Anaheim, CA | $27,055 | 2.25% | $24,023 | 2.39% |
| Atlanta, GA | $11,585 | 2.84% | $10,351 | 2.96% |
| Austin, TX | $16,844 | 2.92% | $13,881 | 3.00% |
| Baltimore, MD | $9,419 | 2.48% | $9,046 | 2.49% |
| Boston, MA | $16,637 | 2.21% | $15,336 | 2.23% |
| Chicago, IL | $8,813 | 2.47% | $8,034 | 2.37% |
| Columbus, OH | $9,060 | 2.94% | $8,334 | 2.97% |
| Dallas, TX | $13,025 | 2.88% | $11,659 | 2.99% |
| Denver, CO | $16,556 | 2.70% | $14,851 | 2.77% |
| Fort Lauderdale, FL | $12,462 | 2.69% | $10,287 | 2.80% |
| Fort Worth, TX | $10,821 | 2.87% | $9,524 | 2.94% |
| Houston, TX | $10,967 | 2.90% | $9,869 | 2.97% |
| Indianapolis, IN | $8,022 | 2.85% | $7,349 | 3.06% |
| Kansas City, MO | $9,119 | 2.94% | $8,478 | 2.97% |
| Los Angeles, CA | $27,444 | 2.34% | $24,848 | 2.40% |
| Miami, FL | $18,598 | 2.75% | $15,595 | 2.83% |
| Minneapolis, MN | $10,259 | 2.64% | $9,560 | 2.68% |
| Montgomery County, PA | $11,412 | 2.59% | $10,876 | 2.64% |
| Nashville, TN | $14,421 | 2.85% | $12,423 | 2.94% |
| Nassau County, NY | $14,120 | 1.98% | $13,225 | 2.02% |
| New Brunswick, NJ | $12,310 | 2.30% | $11,924 | 2.42% |
| Oakland, CA | $28,026 | 2.49% | $24,117 | 2.49% |
| Philadelphia, PA | $8,618 | 2.66% | $8,200 | 2.70% |
| Phoenix, AZ | $13,339 | 2.53% | $11,718 | 2.74% |
| Portland, OR | $7,074 | 2.38% | $6,870 | 2.42% |
| Riverside, CA | $13,641 | 2.22% | $12,295 | 2.43% |
| San Diego, CA | $12,190 | 2.35% | $11,921 | 2.45% |
| San Jose, CA | $23,274 | 2.49% | $21,772 | 2.50% |
| St. Louis, MO | $41,505 | 2.61% | $36,209 | 2.66% |
| Virginia Beach, VA | $6,847 | 2.91% | $6,340 | 2.95% |
| Washington, D.C. | $9,391 | 2.53% | $9,038 | 2.56% |
| West Palm Beach, FL | $14,753 | 2.64% | $14,059 | 2.74% |
Methodology
Redfin analyzed MLS home-sale records to determine average national and metro-level buy-side commission rates. The national commission rate was calculated by averaging the commission rate for each MLS sale in the U.S. For the metro-level breakdown, we analyzed the 100 most populous U.S. metro areas and focused on the 32 that had at least four years of sufficient buy-side commissions data. To calculate the commission fees in dollar terms, we multiplied the home-sale price by the buy-side commission rate listed in the MLS for all homes with sufficient records, and then calculated the average of those values in a given metro.
This analysis excludes home-sale records with commissions of between 0.1% and 0.5% and home-sale records with commissions of more than 10%, which we consider outliers.


