
- Redfin users who viewed homes with severe and/or extreme flood risk prior to a Redfin experiment proceeded to bid on homes with 54% less risk after gaining access to risk data.
- Redfin users in flood-prone Cape Coral, FL, Houston and Baton Rouge, LA were most likely to click into the flood-risk section within home listings.
- Home values in flood-prone areas could drop as more people become aware of the risks. Authorities should respond by adding denser housing to low-risk cities.
Homebuyers who have access to flood-risk information when browsing home listings online are more likely to view and make offers on homes with lower flood risk than those who don’t have access. That’s according to a three-month randomized controlled trial involving 17.5 million Redfin.com users, half of which had access to property-level flood-risk scores (treatment group) and half of which did not (control group).
Redfin users who viewed homes with an average flood-risk score of 8.5 (severe/extreme risk) prior to the study went on to bid on homes with an average score of 3.9 (moderate risk) after gaining access to flood-risk data—a decrease of 54%. By comparison, users who viewed homes with an average score of 8.5 before the study but did not get access to risk data went on to bid on homes with an average score of 8.5. Please note that this segment of the analysis only includes participants who worked with Redfin agents or Redfin partner agents.
We only saw this impact on users who had been viewing homes with severe/extreme risk prior to the study, suggesting that flood danger is currently unlikely to change homebuyer decisionmaking unless it’s substantial. When users who viewed homes with lower risk (minimal, minor, moderate and/or major) prior to the study gained access to flood-risk scores, there was no statistically significant change in the risk level of homes they proceeded to bid on. Homebuyers should still consider flood ratings below severe and extreme, as lower ratings don’t equate to zero risk.
“We now have definitive evidence that the risks posed by climate change are affecting where Americans choose to live. Before Redfin’s experiment, that was just a hypothesis,” said Redfin Chief Economist Daryl Fairweather. “Equipping people with flood-risk information helps them make more informed decisions. Some will opt to move out of risky areas altogether, while others will stay put but invest in making their homes more resilient to disaster.”
Fairweather continued: “As more house hunters become aware of climate risk, homes in endangered areas will likely receive fewer offers, causing home values to fall. At the same time, we may see prices in lower-risk, inland areas rise as more Americans move there to avoid flooding.”
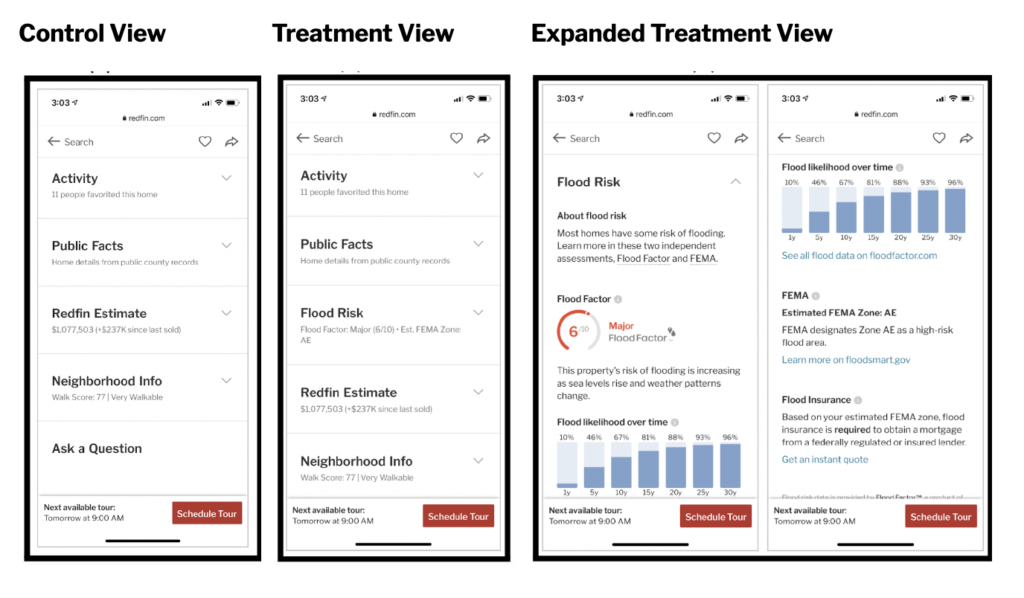
Redfin conducted this experiment from Oct. 12, 2020 to Jan. 3, 2021 in partnership with researchers from University of Southern California, the National Bureau of Economic Research and Massachusetts Institute of Technology. Flood-risk scores came from First Street Foundation’s Flood Factor. Flood Factor’s scores measure the likelihood that a property will flood at least once in the next 30 years (the typical mortgage term), and were presented to the treatment group like so: minimal (1), minor (2), moderate (3-4), major (5-6), severe (7-8), extreme (9-10).
Redfin now publishes climate-risk data (including fire, heat, drought, storm and flood) for nearly every U.S. home, with the exception of rentals.
Flood-Risk Data Also Impacted Which Homes Buyers Viewed Online
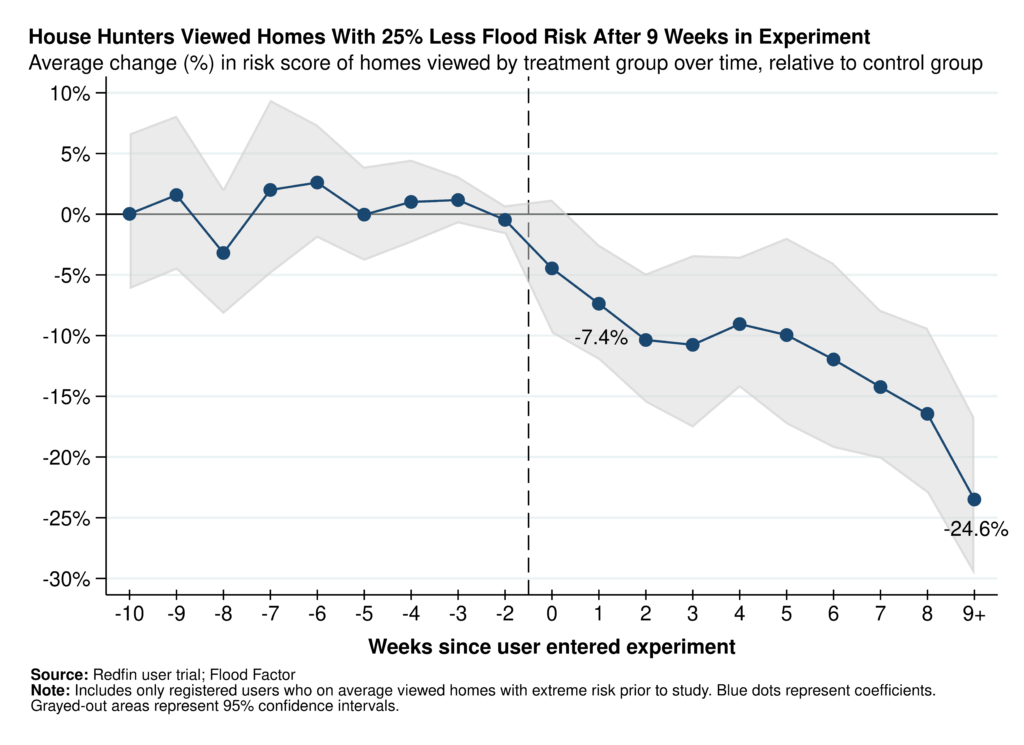
Giving house hunters access to flood-risk data also impacted their online search behavior. Redfin users who were viewing homes with an average risk score of 9.5 (extreme) prior to the study went on to view homes with an average risk score of 8.5 after gaining access to flood-risk data—a decrease of about 10%. There was no meaningful change in the average risk score of homes viewed by users in the control group who had been viewing extremely risky homes prior to the experiment.
The impact increased over time for users who had access to flood-risk data. On average, users who viewed homes with extreme risk before the study were viewing homes with 25% less risk than the control group after nine or more weeks in the experiment, compared with just 7% less risk during week one.
Redfin’s experiment in late 2020 and early 2021 coincided with a period in the housing market when being picky could set buyers back; many were losing bidding war after bidding war as competition surged due to record-low mortgage rates, pandemic-fueled migration and an intensifying housing shortage. Still, flood-risk data caused Redfin users to become more selective about the homes they viewed and bid on—a sign that many homebuyers take climate risk seriously.
“Climate-risk data may start to have an even bigger impact on homebuyer decisions now that the housing market is slowing and tilting more in buyers’ favor,” said Sebastian Sandoval-Olascoaga, the MIT researcher who co-conducted the experiment. “Today’s buyers have more leeway to seek out the home features they really want. For some buyers that might mean considering only turnkey homes, and for others it might mean limiting their search to homes with minimal flood risk.”
Redfin Users in Cape Coral, FL and Houston Were Most Likely to Click on Flood-Risk Data
We also measured how frequently Redfin users in the experiment took the additional step of clicking into a home listing page’s “Flood Risk” section, where more information can be found on future risk, FEMA flood zones and disaster insurance. Nationwide, users in the treatment group clicked into the flood-risk section 2.8% of the time. Many users likely didn’t feel the need to expand the flood-risk section because they found the preview of the flood-risk data sufficient—one reason the clickthrough rate appears low.
In Cape Coral, FL, users in the treatment group clicked into the flood-risk section 8.5% of the time, the highest rate among the 100 most populous U.S. metropolitan areas. Next came Houston (8.1%), Baton Rouge, LA (7.5%), McAllen, TX (7.4%) and New Orleans (7.3%). Three other Florida metros—North Port, Tampa and Jacksonville—were also in the top 10.
All of these areas face flood risk, and some have attracted an influx of homebuyers during the pandemic. Tampa, Cape Coral and North Port all consistently rank on Redfin’s list of most popular migration destinations—an analysis based on net inflow, or how many more Redfin.com users are looking to move into an area than leave. Many cities in Florida and Texas have seen their populations swell as remote workers from expensive coastal cities including New York and San Francisco left in search of warm weather, better bang for their buck and lower taxes. Nationwide, more people have been moving into than out of areas with high flood risk, a 2021 Redfin analysis found.
Top 10 Metros Where Redfin Users Were Most Likely to Click on Flood-Risk Data
| Metro Area | Percentage of Times Redfin Users Clicked into Flood-Risk Section in Home Listings |
|---|---|
| Cape Coral, FL | 8.5% |
| Houston, TX | 8.1% |
| Baton Rouge, LA | 7.5% |
| McAllen, TX | 7.4% |
| New Orleans, LA | 7.3% |
| North Port, FL | 6.9% |
| Virginia Beach, VA | 6.5% |
| Charleston, SC | 6.3% |
| Tampa, FL | 5.7% |
| Jacksonville, FL | 5.7% |
Alexis Malin, a Redfin buyer’s agent in the Jacksonville, FL area, recently worked with a buyer who opted out of purchasing a home due to its high flood-risk rating.
“I had a buyer from the Northeast who toured a beachfront home in the Jacksonville area and was close to making an offer, but changed his mind after seeing that the flood-risk rating on Redfin was almost a 10 out of 10,” Malin said. “He loved the house and the location, but decided the purchase was just too big of a financial risk. He ended up staying in the Northeast and buying a home there instead.”
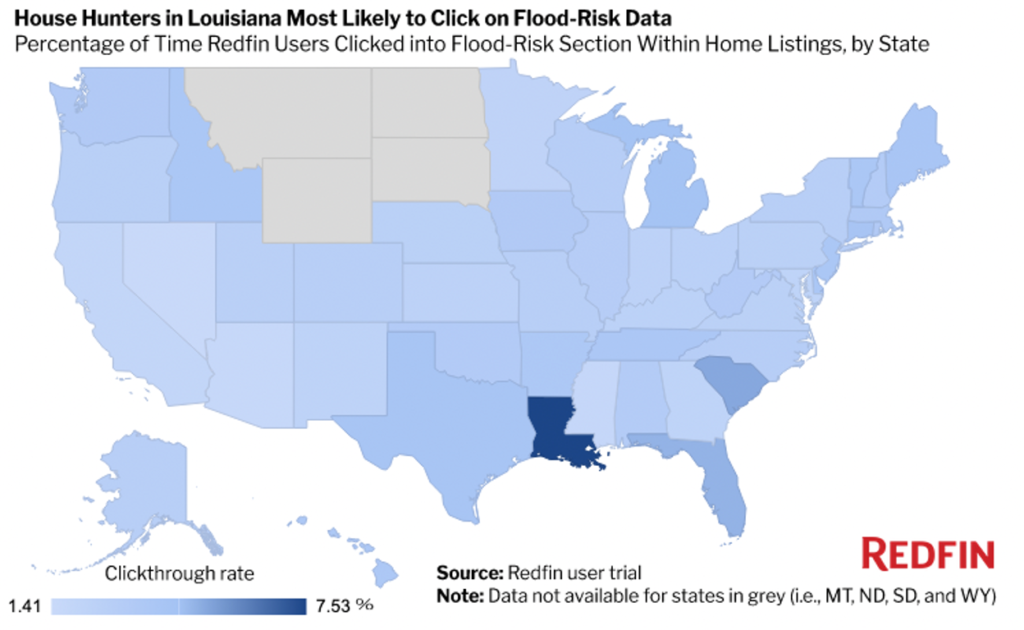
On a state level, Louisiana had the highest click-through rate, with users in the treatment group clicking into the flood-risk section 7.5% of the time. It was followed by South Carolina (5.1%), Florida (4.9%), Michigan (4.4%), Connecticut (4.2%) and Texas (4.1%). Please note that this analysis excludes Montana, Wyoming, North Dakota and South Dakota due to insufficient data.
Top 10 States Where Redfin Users Were Most Likely to Click on Flood-Risk Data
| State | Percentage of Times Redfin Users Clicked into Flood-Risk Section in Home Listings |
|---|---|
| Louisiana | 7.5% |
| South Carolina | 5.1% |
| Florida | 4.9% |
| Michigan | 4.4% |
| Connecticut | 4.2% |
| Texas | 4.1% |
| Maine | 4.0% |
| New Jersey | 3.9% |
| Vermont | 3.9% |
| Delaware | 3.9% |
People Have Access to Climate-Risk Data—What Now?
A homeowner looks up their property on Redfin.com and sees it has a flood-risk rating of 10 out of 10, or extreme. What should they do with this information? What should local leaders and governments do with this information?
Individuals should be aware that if they own or buy a home with high natural-disaster risk, it may require costly disaster insurance and could ultimately drop in value. It’s possible this will disproportionately impact disadvantaged communities, which are often more exposed to flooding. Formerly redlined areas have a larger share of homes with high flood risk than areas that weren’t redlined, a 2021 Redfin analysis found. While redlining has been outlawed for years, formerly redlined areas are still more likely to house people of color than non-redlined areas.
“Home prices haven’t yet started to broadly plummet due to natural-disaster risk. That means communities that face the highest risk still have time to act,” Fairweather said. “If a homeowner thinks their property will lose value due to flood risk, they may want to relocate now to keep both themself and their finances safe. Unfortunately, that may mean passing on the risk to someone else. Governments can help prevent that by purchasing and demolishing at-risk homes, and subsidizing climate-resilient improvements. Upgrades like landscaping, flood walls and flood openings to direct water away from homes can help an at-risk property retain value.”
Fairweather continued: “Local and federal leaders should also be using climate-risk data to inform their policymaking decisions. Lawmakers in lower-risk cities should consider changing zoning laws to allow for denser housing, which would provide more options for people who face flood risk but don’t have a place to go.”
Methodology
Redfin’s randomized controlled trial included 17.5 million Redfin users and was conducted from Oct. 12, 2020 to Jan. 3, 2021. The treatment group had access to Flood Factor risk data for all U.S. homes on Redfin.com, with the exception of those in Montana, Wyoming, North Dakota, and South Dakota, where Redfin was not operational at the time of the experiment. The control group did not have access to this data. Flood risk was described as a property’s risk of flooding at least once over the course of a 30-year mortgage signed today.
Users entered the experiment on a rolling basis; the treatment group and the control group each saw an average of 103,902 users enter per day. Once a user entered the experiment, they remained in the same group for the duration. After the experiment ended, every user was given access to flood-risk data.
We analyzed the flood risk of homes users were viewing prior to the experiment to see how their behavior changed once they gained access to flood-risk data. Redfin pooled users starting Oct. 6, 2020, and entered them into the experiment once they scrolled down within a listing to the section where the flood-risk information is or would be. We define “prior to the experiment” as the period between Oct. 6 and when the user was entered into the experiment. Unless otherwise specified, results presented are statistically significant at the 95% level. The standard errors are clustered at the user level.
Clickthrough rates were calculated by dividing the number of times users in the treatment group scrolled to the flood-risk section by the number of times they expanded the flood-risk section. State- and metro-level clickthrough rates are based on where the viewed properties are located.


