-
Both buyers and sellers retreated in September as surging mortgage rates made moving more expensive.
-
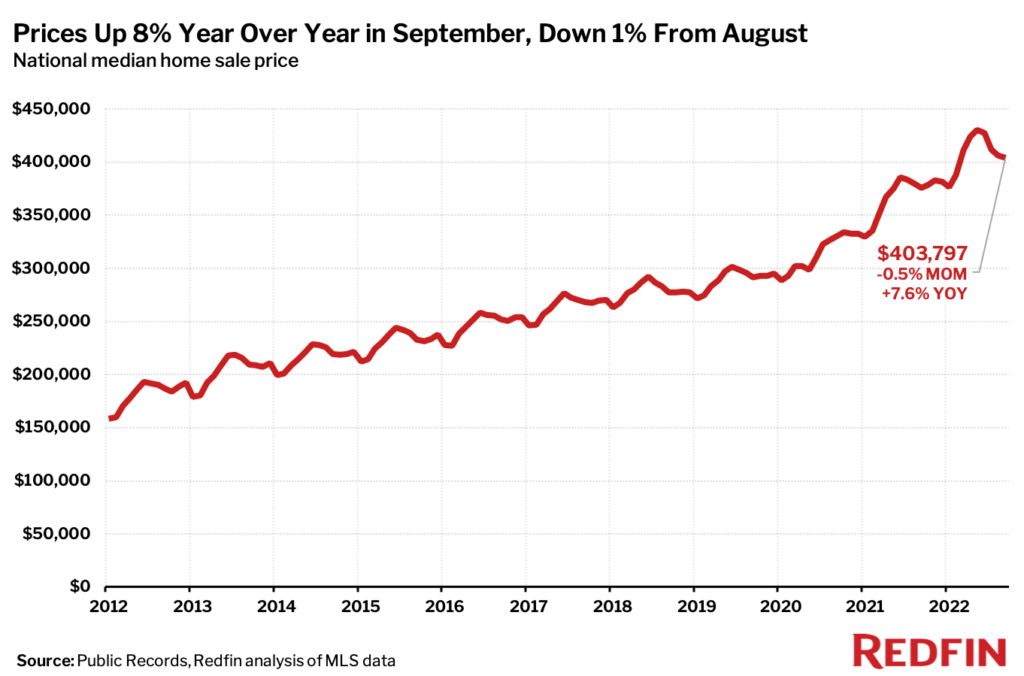
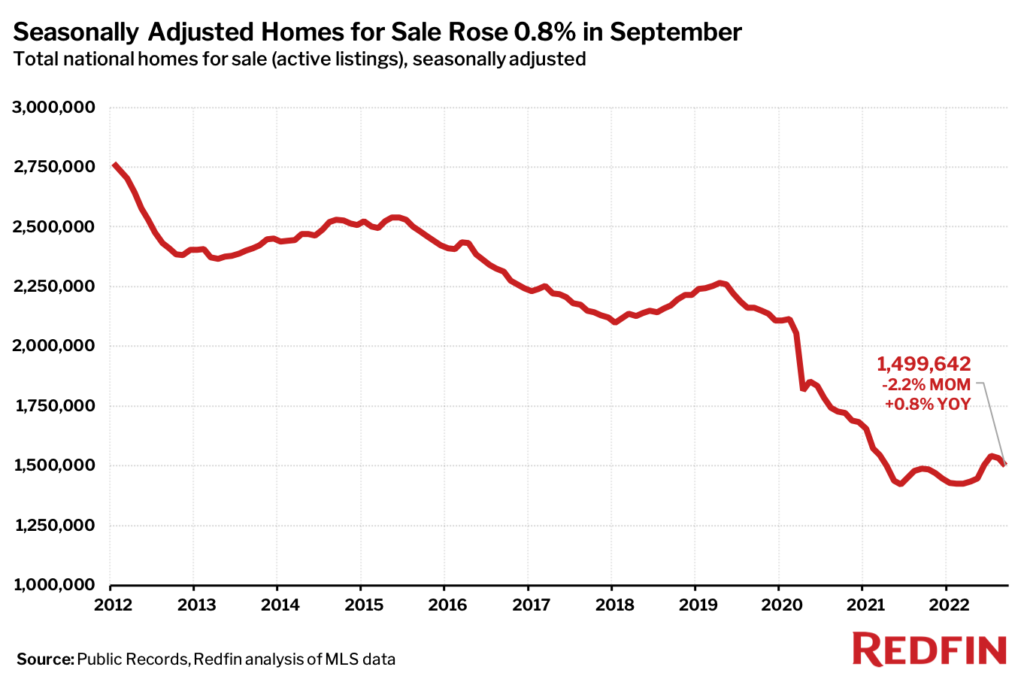
Still, home prices rose 8% year over year due to persistent tight supply and inflation.
-
About 60,000 deals were called off, equal to 17% of homes that went under contract—the highest share on record aside from March 2020.
-
A record 22% of homes for sale had a price drop in September as homebuyer bidding wars eased.
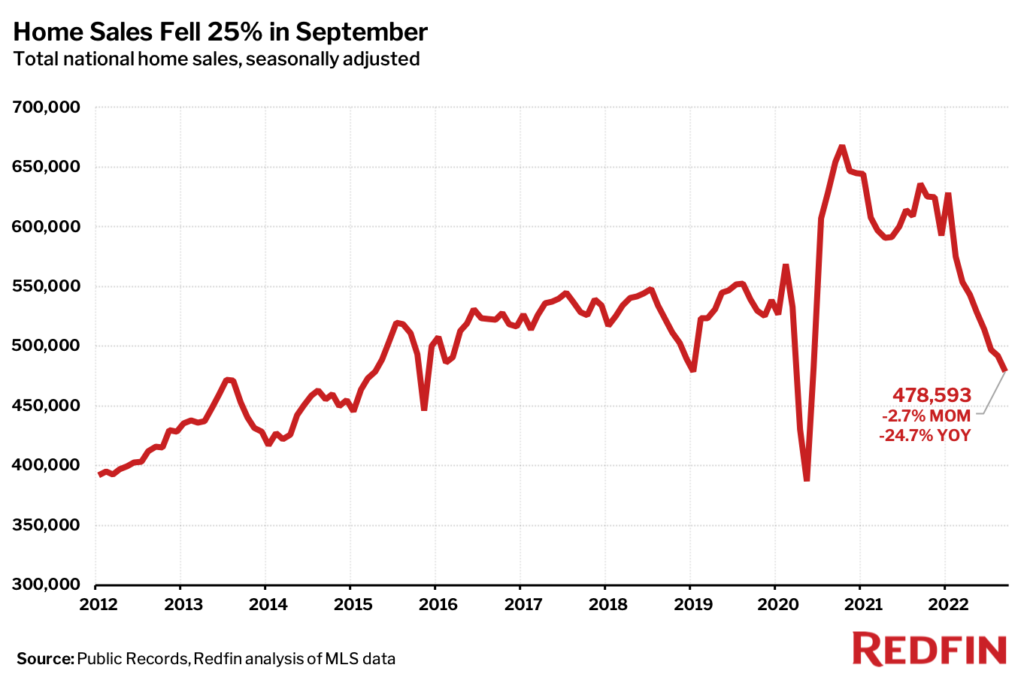
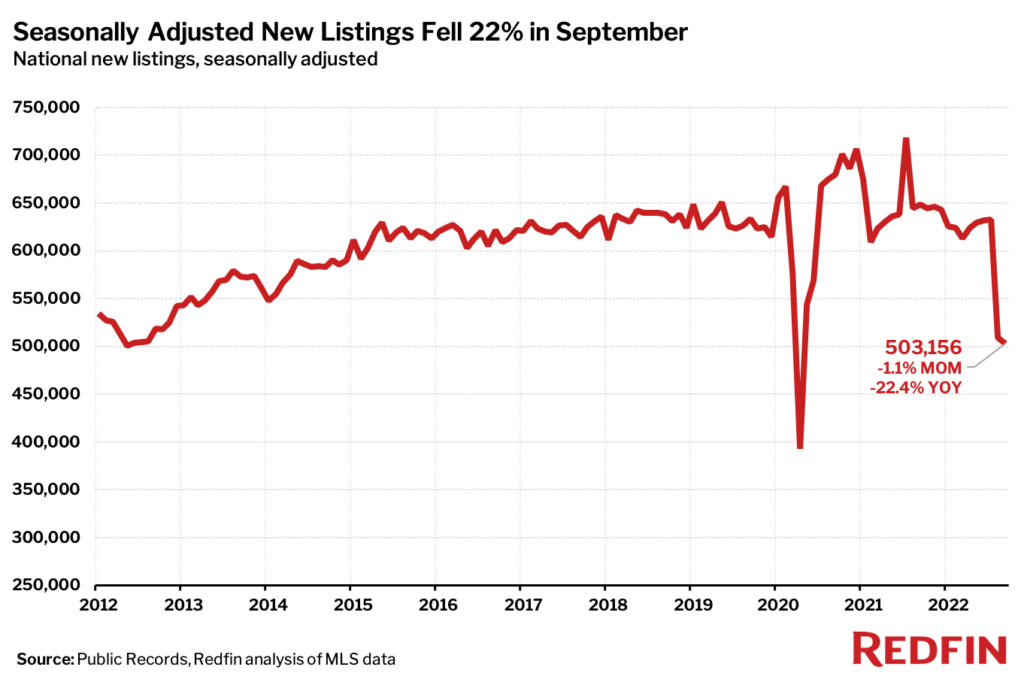
Home sales and listings in September both slumped the most on record with the exception of the early months of the pandemic as rapidly rising mortgage rates prompted both buyers and sellers to stay put. The number of homes sold dropped 25% year over year while new listings fell 22%—the largest declines since May 2020 and April 2020, respectively, when the onset of the pandemic brought the housing market to a near halt.
“The U.S. housing market is at another standstill, but the driving forces are completely different from those that triggered the standstill at the start of the pandemic,” said Redfin Economics Research Lead Chen Zhao. “This time, demand is slumping due to surging mortgage rates, but prices are being propped up by inflation and a drop in the number of people putting their homes up for sale. Many Americans are staying put because they already relocated and scored a rock-bottom mortgage rate during the pandemic, so they have little incentive to move today.”
While the median home-sale price was down 0.5% month-over-month in September, it still rose 8% on a year-over-year basis to $403,797.
Zhao continued: “The housing market is going to get worse before it gets better. With inflation still rampant, the Federal Reserve will likely continue hiking interest rates. That means we may not see high mortgage rates—the primary killer of housing demand—decline until early to mid-2023.”
Homebuyers are backing off because mortgage rates are now at the highest level in two decades, which has driven monthly housing payments for buyers up more than 50% year over year. Prospective sellers are backing off because they don’t want to risk losing the low mortgage rate they already have locked in. As a result, deals are increasingly falling through and buyer competition is plunging.
Roughly 60,000 home-purchase agreements were canceled in September, equal to 17% of homes that went under contract that month. That’s the highest percentage on record with the exception of March 2020—the month the World Health Organization declared the coronavirus a pandemic. Fewer than half (46%) of home offers written by Redfin agents faced competition in September, the lowest share since the start of the pandemic.
September Highlights
| Market Summary | September 2022 | Month-Over-Month | Year-Over-Year |
| Median sale price | $403,797 | -0.5% | 7.6% |
| Homes sold, seasonally-adjusted | 478,593 | -2.7% | -24.7% |
| Pending sales, seasonally-adjusted | 451,438 | -5% | -25.3% |
| New listings, seasonally-adjusted | 503,156 | -1.1% | -22.4% |
| All homes for sale, seasonally-adjusted | 1,499,642 | -2.2% | 0.8% |
| Median days on market | 32 | 5 | 13 |
| Months of supply | 2.3 | 0.2 | 0.7 |
| Share of homes sold above final list price | 32% | -5.8 pp† | -15.9 pp† |
| Average sale-to-final-list-price ratio | 99.2% | -0.6 pp† | -1.8 pp† |
| Average 30-year fixed mortgage rate | 6.11% | 0.89 pp† | 3.21 pp† |
| Share of for-sale homes with a price drop | 22.4% | 1.2 pp† | 9.8 pp† |
| Share of home offers written by Redfin agents that faced competition (seasonally adjusted) | 46.4% | -2.3 pp† | -19.5 pp† |
| Pending sales that fell out of contract, as % of overall pending sales | 17% | 2 pp† | 4.5 pp† |
† – “pp” = percentage-point change
Note: Data is subject to revision
Metro-Level Highlights
Bulleted rankings below came from a list of the 91 U.S. metro areas that have populations of at least 750,000, with the exception of rankings of bidding-war rates and home-purchase cancellations. The bidding-wars ranking came from a list of 36 metros—those that had a monthly average of at least 50 offers submitted by Redfin agents from March 2021 to March 2022. The home-purchase cancellations ranking came from a list of the 50 most populous metro areas.
For more metro-level trends, head to Redfin’s data center.
Competition
- Rochester, NY was the fastest market, with half of all homes pending sale in just 9 days. It was followed by Grand Rapids, MI and Omaha, NE, with 10 median days on market in September. Next came Buffalo, NY and Indianapolis, with 11 median days on market.
- Chicago was the slowest market, with 57 median days on market. Next came Lake County, IL (54), Charleston, SC (53), Honolulu (52) and Pittsburgh (52).
- In Rochester, 68.4% of homes sold above their final list price—a higher share than any other metro Redfin analyzed. It was followed by Buffalo (65.7%) Hartford, CT (60.1%), Newark, NJ (56.2%) and Worcester, MA (54.4%).
- In Boise, ID, 13.7% of homes sold above their final list price—a lower share than any other metro Redfin analyzed. Next came North Port, FL (15%), Phoenix (15.3%), Cape Coral, FL (15.4%) and Las Vegas (15.6%).
- Philadelphia had the highest bidding-war rate, with 62.2% of home offers written by Redfin agents facing competition. Next came Colorado Springs, CO (60.9%), Boston (58.6%), San Francisco (54.6%) and Providence, RI (53.8%).
- The lowest bidding-war rates were in Las Vegas (20.3%), Phoenix (20.7%), Tampa, FL (25%), Riverside, CA (25.7%) and Houston (26.9%).
Prices
- El Paso, TX saw the highest growth in prices, which rose 23% year over year to $245,950. Next came West Palm Beach, FL (22.2%), Greenville, SC (19.3%), Miami (17.6%) and Greensboro, NC (17.5%).
- Three metros saw year-over-year price declines: New Orleans (-5.7%), Oakland, CA (-2.1%) and San Francisco (-1.9%).
- More than two-thirds (67.8%) of homes for sale in Boise had a price drop in September—a larger share than any other metro Redfin analyzed. Next came Denver (58.4%), Indianapolis (55.9%), Phoenix (54.5%) and Salt Lake City (54.3%).
- Newark had the smallest share of price drops (15.9%), followed by El Paso (16.1%), Miami (18.6%), New Brunswick, NJ (19.6%) and Honolulu (20.3%).
Sales
- Only one metro area—New Orleans—saw year-over-year home-sales growth, up 13.9%. The smallest declines were in Newark (-5.4%), Buffalo (-5.6%), Allentown, PA (-7.4%) and Oklahoma City, OK (-8.3%).
- North Port saw the largest decline in sales, falling 39.7% year over year. Next came Cape Coral (-39%), Las Vegas (-38.4%), Boise (-37.9%) and Tampa (-35.8%).
- In Jacksonville, FL, 745 home-purchase agreements fell through, equal to 30.3% of homes that went under contract that month—the highest percentage among the metros Redfin analyzed. It was followed by San Antonio, TX (25.3%), Atlanta (25%), Orlando, FL (24.6%) and Tampa (24.5%).
- Newark had the lowest percentage of cancellations (3.9%), followed by San Francisco (5.5%), Nassau County, NY (5.6%), New York (6.9%) and San Jose, CA (7.7%).
Inventory
- Austin, TX saw the largest increase in the number of homes for sale, up 41.4% year over year, followed by North Port (41.3%), Nashville (36.9%), Las Vegas (34.1%) and New Orleans (31.9%).
- Hartford, CT had the largest decrease in overall active listings, falling 34.2% year over year. Next came Frederick, MD (-31.9%), Allentown (-31.3%), Montgomery County, PA (-30.9%) and Bridgeport, CT (-29.7%).
Scroll down for national charts and market-by-market breakdowns. For downloadable data on all of the markets Redfin tracks, visit the Redfin Data Center. Refer to our metrics definition page for explanations of the metrics used in this report.


Competition
| Metro Area | Sept. 2022: Share of Redfin Offers That Faced Competition | Aug. 2022: Share of Redfin Offers That Faced Competition | Sept. 2021: Share of Redfin Offers That Faced Competition |
|---|---|---|---|
| Atlanta, GA | 34.7% | 37.2% | 58.3% |
| Austin, TX | 28.4% | 28.6% | 49.7% |
| Baltimore, MD | 45.9% | 52.4% | 56.0% |
| Boston, MA | 58.6% | 54.5% | 73.0% |
| Charlotte, NC | 41.2% | 36.4% | 54.2% |
| Chicago, IL | 36.2% | 43.2% | 47.8% |
| Colorado Springs, CO | 60.9% | 29.7% | 61.4% |
| Dallas-Fort Worth, TX | 33.6% | 45.1% | 64.8% |
| Denver, CO | 37.3% | 39.8% | 57.0% |
| Detroit, MI | 32.5% | 55.9% | 49.4% |
| Honolulu, HI | 41.2% | 51.4% | 63.3% |
| Houston, TX | 26.9% | 36.4% | 52.9% |
| Indianapolis, IN | 33.3% | 53.1% | 67.8% |
| Las Vegas, NV | 20.3% | 30.9% | 60.2% |
| Los Angeles, CA | 44.2% | 52.8% | 68.9% |
| Miami, FL | 37.8% | 43.6% | 51.2% |
| Minneapolis, MN | 36.0% | 26.3% | 58.1% |
| Nashville, TN | 42.9% | 48.7% | 52.7% |
| New York, NY | 46.7% | 50.2% | 51.1% |
| Olympia, WA | 42.1% | 24.2% | 63.2% |
| Orlando, FL | 44.4% | 31.0% | 52.0% |
| Philadelphia, PA | 62.2% | 65.5% | 64.6% |
| Phoenix, AZ | 20.7% | 27.1% | 55.0% |
| Portland, OR | 35.9% | 50.0% | 63.6% |
| Providence, RI | 53.8% | 55.6% | 64.9% |
| Raleigh, NC | 39.1% | 34.8% | 72.7% |
| Riverside, CA | 25.7% | 39.6% | 57.5% |
| Sacramento, CA | 40.6% | 48.1% | 69.4% |
| San Antonio, TX | 36.9% | 23.0% | 58.2% |
| San Diego, CA | 45.6% | 47.1% | 71.8% |
| San Francisco, CA | 54.6% | 52.9% | 69.3% |
| San Jose, CA | 50.7% | 57.4% | 76.6% |
| Seattle, WA | 35.5% | 33.8% | 63.4% |
| Tampa, FL | 25.0% | 25.6% | 56.9% |
| Washington, D.C. | 42.5% | 44.7% | 57.5% |
| Worcester, MA | 38.9% | 55.8% | 71.4% |
Home-Purchase Cancellations
| Metro Area | Sept. 2022: Pending Sales that Fell Out of Contract | Sept. 2022: Pending Sales That Fell Out of Contract, as % of Overall Pending Sales | Aug. 2022: Pending Sales That Fell Out of Contract, as % of Overall Pending Sales | Sept. 2021: Pending Sales That Fell Out of Contract, as % of Overall Pending Sales |
|---|---|---|---|---|
| Anaheim, CA | 337 | 17.1% | 15.3% | 13.2% |
| Atlanta, GA | 1,999 | 25.0% | 22.2% | 16.5% |
| Austin, TX | 551 | 21.3% | 18.0% | 12.6% |
| Baltimore, MD | 464 | 14.2% | 12.5% | 12.7% |
| Boston, MA | 478 | 12.5% | 9.9% | 10.3% |
| Charlotte, NC | 576 | 15.5% | 13.1% | 10.5% |
| Chicago, IL | 1,361 | 18.0% | 15.7% | 17.2% |
| Cincinnati, OH | 381 | 14.7% | 13.8% | 13.4% |
| Cleveland, OH | 538 | 20.4% | 15.4% | 15.6% |
| Columbus, OH | 511 | 19.2% | 16.6% | 13.8% |
| Dallas, TX | 1,193 | 21.2% | 19.7% | 17.3% |
| Denver, CO | 895 | 20.5% | 13.9% | 8.8% |
| Detroit, MI | 357 | 18.7% | 16.2% | 15.4% |
| Fort Lauderdale, FL | 647 | 22.1% | 21.8% | 19.8% |
| Fort Worth, TX | 614 | 21.0% | 21.2% | 17.8% |
| Houston, TX | 1,835 | 23.0% | 20.0% | 18.3% |
| Indianapolis, IN | 597 | 20.0% | 15.7% | 12.9% |
| Jacksonville, FL | 745 | 30.3% | 25.4% | 17.6% |
| Kansas City, MO | 457 | 16.2% | 15.0% | 14.3% |
| Las Vegas, NV | 596 | 22.7% | 21.7% | 18.9% |
| Los Angeles, CA | 914 | 18.3% | 16.2% | 13.1% |
| Miami, FL | 519 | 19.2% | 17.4% | 15.2% |
| Milwaukee, WI | 175 | 10.5% | 8.6% | 10.1% |
| Minneapolis, MN | 517 | 12.5% | 10.6% | 10.0% |
| Montgomery County, PA | 174 | 9.4% | 7.2% | 9.7% |
| Nashville, TN | 600 | 20.9% | 15.2% | 13.2% |
| Nassau County, NY | 126 | 5.6% | 6.1% | 5.3% |
| New Brunswick, NJ | 409 | 10.5% | 11.3% | 8.8% |
| New York, NY | 426 | 6.9% | 7.2% | 6.4% |
| Newark, NJ | 192 | 3.9% | 2.7% | 2.7% |
| Oakland, CA | 239 | 11.6% | 9.5% | 7.1% |
| Orlando, FL | 914 | 24.6% | 21.6% | 20.7% |
| Philadelphia, PA | 248 | 12.9% | 12.9% | 12.0% |
| Phoenix, AZ | 1,432 | 23.5% | 21.3% | 16.1% |
| Pittsburgh, PA | 445 | 18.9% | 14.5% | 16.0% |
| Portland, OR | 501 | 18.9% | 13.6% | 12.3% |
| Providence, RI | 219 | 13.9% | 12.6% | 11.5% |
| Riverside, CA | 902 | 20.8% | 17.7% | 15.3% |
| Sacramento, CA | 433 | 19.0% | 15.7% | 12.4% |
| San Antonio, TX | 754 | 25.3% | 21.4% | 19.7% |
| San Diego, CA | 396 | 17.6% | 14.2% | 13.1% |
| San Francisco, CA | 48 | 5.5% | 4.6% | 3.1% |
| San Jose, CA | 82 | 7.7% | 8.2% | 5.9% |
| Seattle, WA | 413 | 13.2% | 10.1% | 7.1% |
| St. Louis, MO | 521 | 14.5% | 14.3% | 13.5% |
| Tampa, FL | 1,255 | 24.5% | 21.3% | 18.7% |
| Virginia Beach, VA | 402 | 15.9% | 14.3% | 14.2% |
| Warren, MI | 497 | 14.9% | 13.1% | 13.2% |
| Washington, D.C. | 666 | 12.4% | 12.2% | 11.2% |
| West Palm Beach, FL | 517 | 21.1% | 19.2% | 18.7% |
 United States
 Canada