
-
That’s the lowest share on record, down from 21% in 2022 and over 40% before the pandemic homebuying boom.
-
White households had three times more affordable options than Black households this year.
-
Housing affordability is expected to improve in 2024 as mortgage rates fall and more homes go up for sale.
Just 15.5% of homes for sale in 2023 were affordable for the typical U.S. household—the lowest share on record. That’s down from 20.7% in 2022 and more than 40% before the pandemic homebuying boom.
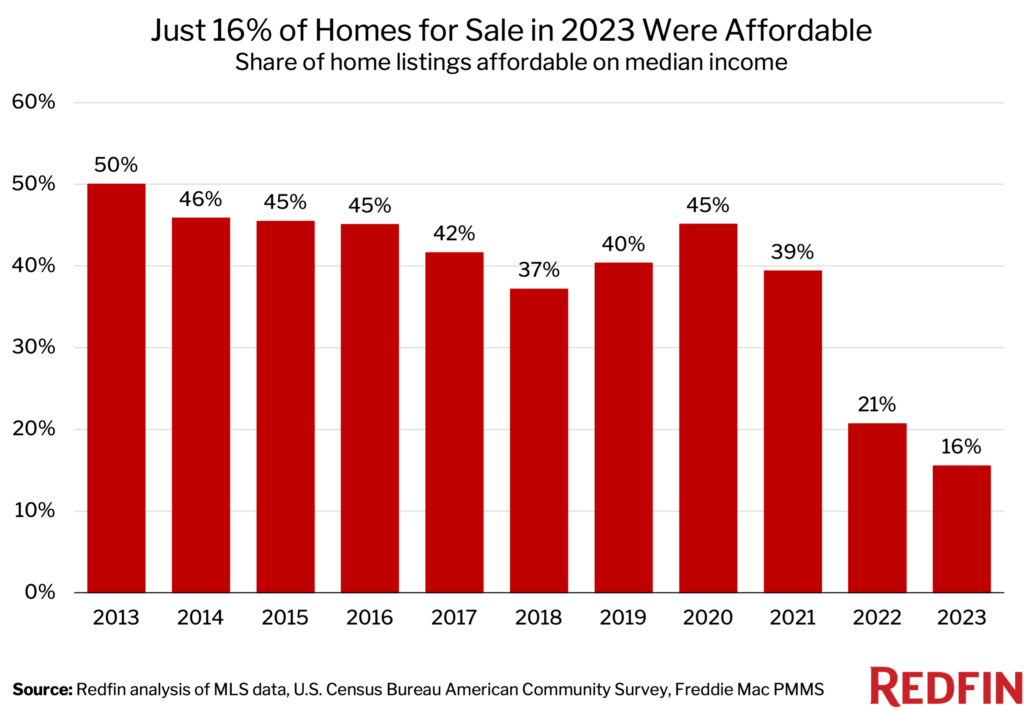
This is according to a Redfin analysis of new listings in 97 of the most populous U.S. metropolitan areas. A listing is considered affordable if the estimated monthly mortgage payment is no more than 30% of the local county’s median household income. The national share was calculated by taking the sum of affordable listings in the metros Redfin analyzed and dividing it by the sum of all listings in those metros. Data for 2023 goes through November, while data from past years spans the full year. Redfin’s records date back to 2013.
The number of affordable homes for sale also dropped to the lowest level on record. There were 352,500 affordable listings in 2023, down 40.9% from 596,135 in 2022 and down from over a million per year during the prior decade. While the decline is partly due to a drop in listings in general—listings overall fell 21.2% year over year—it’s also due to the fact that elevated mortgage rates and stubbornly high prices made the listings hitting the market more expensive.
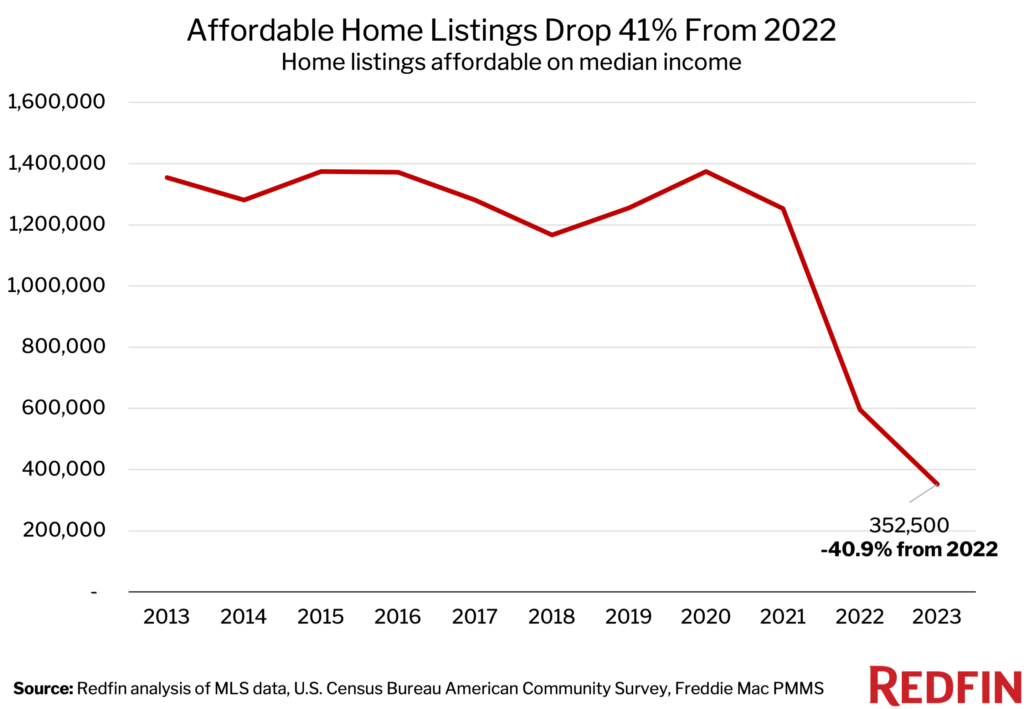
Mortgage rates have fallen from their October peak, but remain higher than they were in 2022; the typical homebuyer’s monthly payment is roughly $250 more than it was a year ago. Elevated mortgage rates have also propped up housing costs by limiting supply. Many homeowners are staying put instead of selling because they don’t want to lose their ultra low interest rate. That’s bolstering home prices because it means buyers are competing for a limited pool of homes.
The good news is that housing affordability has already started to improve, and Redfin expects it to continue improving in 2024.
“Many of the factors that made 2023 the least affordable year for homebuying on record are easing,” said Redfin Senior Economist Elijah de la Campa. “Mortgage rates are under 7% for the first time in months, home price growth is slowing as lower rates prompt more people to list their homes, and overall inflation continues to cool. We’ll likely see a jump in home purchases in the new year as buyers take advantage of lower mortgage rates and more listings after the holidays.”
Housing Affordability Was Three Times Worse for Black Households Than for White Households
Only 6.9% of homes for sale in 2023 were affordable for the typical Black household, compared with 21.6% for the typical white household. The share was nearly as low for Hispanic/Latino households (10.4%) and was highest for Asian households (27.4%).
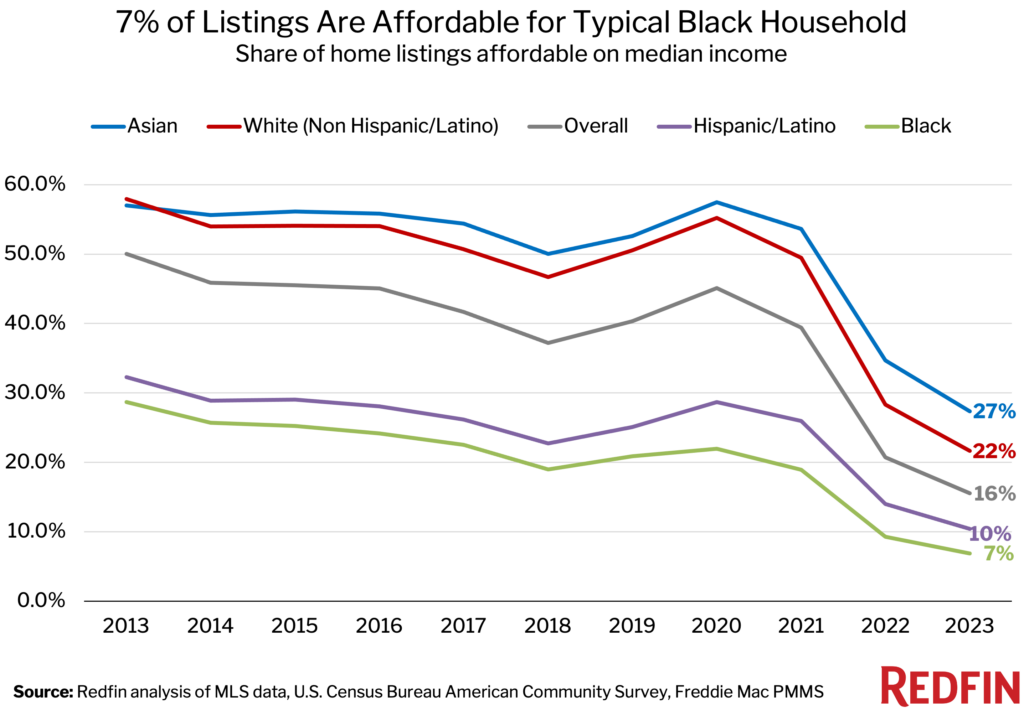
Housing has become unaffordable for a lot of Americans, but Black and Hispanic/Latino families have been hit especially hard because they’re often less wealthy to begin with. On average, these groups earn less money, have less generational wealth, and have lower credit scores (and sometimes no credit scores at all) than white Americans due to decades of discrimination. That makes it tougher to afford a down payment and qualify for a low mortgage rate. Black Americans, in particular, also frequently face racial bias during the homebuying process.
The racial housing affordability gap exists nationwide, from the least affordable metros to the most affordable metros. In Detroit, which has the lowest mortgage payments in the country, 31.8% of listings were affordable for the typical Black household this year and 50.2% were affordable for the typical Hispanic/Latino household, but that’s much lower than the 66% affordable for the typical white household. In Anaheim, CA, one of the most expensive markets in the country, people across the board have a hard time finding affordable housing. Still, Black and Hispanic/Latino house hunters have fewer options. Less than 0.5% of listings were affordable for the typical Black household and the typical Hispanic/Latino household in 2023, compared with 1.8% for the typical white household.
It’s worth noting that wages have grown faster for nonwhite households than for white households this year, helping to shrink the income gap. Rents have also started to fall, which disproportionately impacts communities of color because they’re more likely to be renters.
Affordable Markets Became Much Less Affordable in 2023
In Kansas City, MO, 27.9% of homes for sale in 2023 were affordable for the typical local household, down from 42.8% in 2022. That 14.8 percentage point decline is the largest among the metros Redfin analyzed. Next came Greenville, SC (-14.1 ppts), Worcester, MA (-13.7 ppts), Cincinnati (-13.7 ppts) and Little Rock, AR (-13.5 ppts).
Relatively inexpensive metros have seen affordability erode quickly because housing costs have relatively more room to rise, and local incomes are often climbing at a fraction of the pace that mortgage payments are.
In San Francisco, 0.3% of homes for sale in 2023 were affordable for the typical local household, down from 0.4% in 2022. That’s the smallest decline among the metros Redfin analyzed. Next came Detroit (-0.2 ppts), Los Angeles (-0.2 ppts) Boise, ID (-0.3 ppts) and Oakland, CA (-0.5 ppts).
Markets that have long been expensive like San Francisco, Oakland and Los Angeles already had so few affordable homes that the share didn’t have much room to fall. In the five aforementioned metros aside from Detroit, less than 5% of listings were affordable for the typical household in 2023.
Metro-Level Summary: Share of Homes Affordable for Typical Household
The table below includes the 100 most populous U.S. metropolitan areas, with the exception of three Connecticut metros, which we removed due to insufficient data.
| U.S. metro area | 2023: Share of listings affordable | 2022: Share of listings affordable | Change in number of affordable listings (2022-2023) |
|---|---|---|---|
| Akron, OH | 51.2% | 56.2% | -27.4% |
| Albany, NY | 26.0% | 36.5% | -42.3% |
| Albuquerque, NM | 5.8% | 14.3% | -69.1% |
| Allentown, PA | 23.3% | 33.5% | -48.0% |
| Anaheim, CA | 1.1% | 1.9% | -59.2% |
| Atlanta, GA | 13.8% | 20.8% | -48.9% |
| Austin, TX | 4.2% | 4.7% | -25.2% |
| Bakersfield, CA | 8.4% | 10.3% | -40.7% |
| Baltimore, MD | 29.6% | 41.1% | -45.0% |
| Baton Rouge, LA | 26.4% | 36.5% | -45.5% |
| Birmingham, AL | 34.5% | 39.1% | -32.6% |
| Boise City, ID | 1.0% | 1.3% | -52.3% |
| Boston, MA | 4.7% | 8.7% | -58.2% |
| Buffalo, NY | 35.0% | 40.9% | -24.5% |
| Camden, NJ | 34.4% | 45.1% | -42.1% |
| Cape Coral, FL | 4.7% | 9.5% | -52.4% |
| Charleston, SC | 5.9% | 13.7% | -64.6% |
| Charlotte, NC | 10.5% | 19.2% | -53.6% |
| Chicago, IL | 30.6% | 36.7% | -37.2% |
| Cincinnati, OH | 34.8% | 48.5% | -46.7% |
| Cleveland, OH | 46.5% | 50.2% | -24.3% |
| Colorado Springs, CO | 2.5% | 8.7% | -78.7% |
| Columbia, SC | 19.0% | 30.1% | -46.7% |
| Columbus, OH | 24.2% | 34.7% | -43.4% |
| Dallas, TX | 11.0% | 12.6% | -24.1% |
| Dayton, OH | 49.4% | 53.1% | -24.0% |
| Denver, CO | 3.8% | 7.8% | -62.8% |
| Des Moines, IA | 36.6% | 46.4% | -34.2% |
| Detroit, MI | 51.4% | 51.6% | -14.7% |
| El Paso, TX | 5.1% | 11.9% | -62.8% |
| Elgin, IL | 34.0% | 42.4% | -38.5% |
| Fort Lauderdale, FL | 11.3% | 15.9% | -39.6% |
| Fort Worth, TX | 7.9% | 11.9% | -42.7% |
| Frederick, MD | 22.0% | 28.6% | -44.7% |
| Fresno, CA | 5.8% | 9.1% | -52.8% |
| Gary, IN | 33.3% | 44.2% | -38.8% |
| Grand Rapids, MI | 24.5% | 36.5% | -46.6% |
| Greensboro, NC | 21.5% | 33.4% | -51.1% |
| Greenville, SC | 10.1% | 24.2% | -65.8% |
| Honolulu, HI | 2.5% | 5.1% | -64.0% |
| Houston, TX | 15.4% | 19.3% | -31.9% |
| Indianapolis, IN | 30.9% | 44.1% | -42.9% |
| Jacksonville, FL | 16.1% | 19.8% | -34.0% |
| Kansas City, MO | 27.9% | 42.8% | -47.7% |
| Knoxville, TN | 10.7% | 22.7% | -62.2% |
| Lake County, IL | 38.7% | 48.2% | -39.0% |
| Lakeland, FL | 8.1% | 9.3% | -22.6% |
| Las Vegas, NV | 6.3% | 7.3% | -43.8% |
| Little Rock, AR | 31.2% | 44.6% | -44.5% |
| Los Angeles, CA | 0.3% | 0.5% | -55.2% |
| Louisville, KY | 30.6% | 43.2% | -42.0% |
| McAllen, TX | 8.8% | 12.8% | -35.0% |
| Memphis, TN | 32.6% | 35.0% | -20.8% |
| Miami, FL | 1.7% | 3.2% | -58.5% |
| Milwaukee, WI | 24.9% | 32.8% | -38.2% |
| Minneapolis, MN | 22.1% | 34.0% | -47.3% |
| Montgomery County, PA | 23.9% | 35.2% | -46.5% |
| Nashville, TN | 3.4% | 8.8% | -68.0% |
| Nassau County, NY | 5.6% | 9.2% | -52.9% |
| New Brunswick, NJ | 14.1% | 20.6% | -48.5% |
| New Orleans, LA | 19.8% | 24.2% | -32.6% |
| New York, NY | 3.1% | 4.5% | -46.3% |
| Newark, NJ | 13.2% | 16.4% | -40.2% |
| North Port, FL | 6.6% | 8.0% | -18.5% |
| Oakland, CA | 2.0% | 2.5% | -43.6% |
| Oklahoma City, OK | 30.1% | 42.1% | -40.8% |
| Omaha, NE | 29.9% | 37.9% | -32.2% |
| Orlando, FL | 7.6% | 10.9% | -42.1% |
| Oxnard, CA | 0.3% | 1.1% | -81.3% |
| Philadelphia, PA | 28.9% | 33.2% | -31.0% |
| Phoenix, AZ | 3.8% | 8.1% | -67.0% |
| Pittsburgh, PA | 45.2% | 52.8% | -27.7% |
| Portland, OR | 2.3% | 3.9% | -57.0% |
| Providence, RI | 6.1% | 8.9% | -47.7% |
| Raleigh, NC | 12.5% | 18.6% | -50.5% |
| Richmond, VA | 21.1% | 31.3% | -44.9% |
| Riverside, CA | 3.1% | 4.3% | -49.7% |
| Rochester, NY | 40.8% | 49.9% | -30.6% |
| Sacramento, CA | 2.8% | 4.4% | -55.2% |
| Salt Lake City, UT | 2.6% | 4.6% | -56.2% |
| San Antonio, TX | 10.1% | 14.9% | -41.4% |
| San Diego, CA | 0.4% | 0.9% | -70.6% |
| San Francisco, CA | 0.3% | 0.4% | -32.6% |
| San Jose, CA | 0.4% | 1.4% | -79.0% |
| Seattle, WA | 3.0% | 5.4% | -62.6% |
| St. Louis, MO | 47.5% | 53.7% | -24.1% |
| Stockton, CA | 5.2% | 6.9% | -48.6% |
| Tacoma, WA | 2.3% | 3.8% | -60.5% |
| Tampa, FL | 7.9% | 10.9% | -38.1% |
| Tucson, AZ | 3.7% | 9.3% | -69.9% |
| Tulsa, OK | 26.5% | 38.9% | -45.4% |
| Virginia Beach, VA | 20.2% | 32.9% | -53.8% |
| Warren, MI | 38.2% | 45.7% | -35.3% |
| Washington, D.C. | 17.1% | 25.9% | -50.6% |
| West Palm Beach, FL | 10.2% | 14.4% | -39.2% |
| Wilmington, DE | 35.3% | 38.5% | -29.8% |
| Worcester, MA | 7.6% | 21.2% | -72.1% |
| National—U.S.A. | 15.5% | 20.7% | -40.9% |
Methodology
This analysis used MLS listing data and county-level data from the U.S. Census Bureau’s American Community Survey on median household income for non Hispanic/Latino white households, Black households, Asian households, Hispanic/Latino households and households overall. To estimate the share of homes affordable in 2023, we used income data from 2022—the most recent data available. To estimate the share of homes affordable in 2022, we used income data from 2021.
The national share of homes affordable was calculated by taking the sum of affordable new listings in 97 of the most populous U.S. metros and dividing it by the sum of all new listings in those metros. We used a weighted average of median incomes across those metros. Metro-level calculations measure the share of homes affordable for the typical household within the metro, based on the local median income.
We define an “affordable” listing as one where the monthly mortgage payment would be no more than 30% of the county’s median income. We estimated the monthly mortgage payment for each listing using the average 30-year-fixed mortgage rate during the month the home hit the market, according to Freddie Mac’s Primary Mortgage Market Survey. We assumed a 5% down payment, private mortgage insurance of 0.75% of the list price and homeowner’s insurance of $70 per month. We also factored in property tax data, assuming a tax rate of 1.25% of the list price if no record was available. We restricted our analysis to single-family homes, condos and townhomes with two bedrooms or more.


