
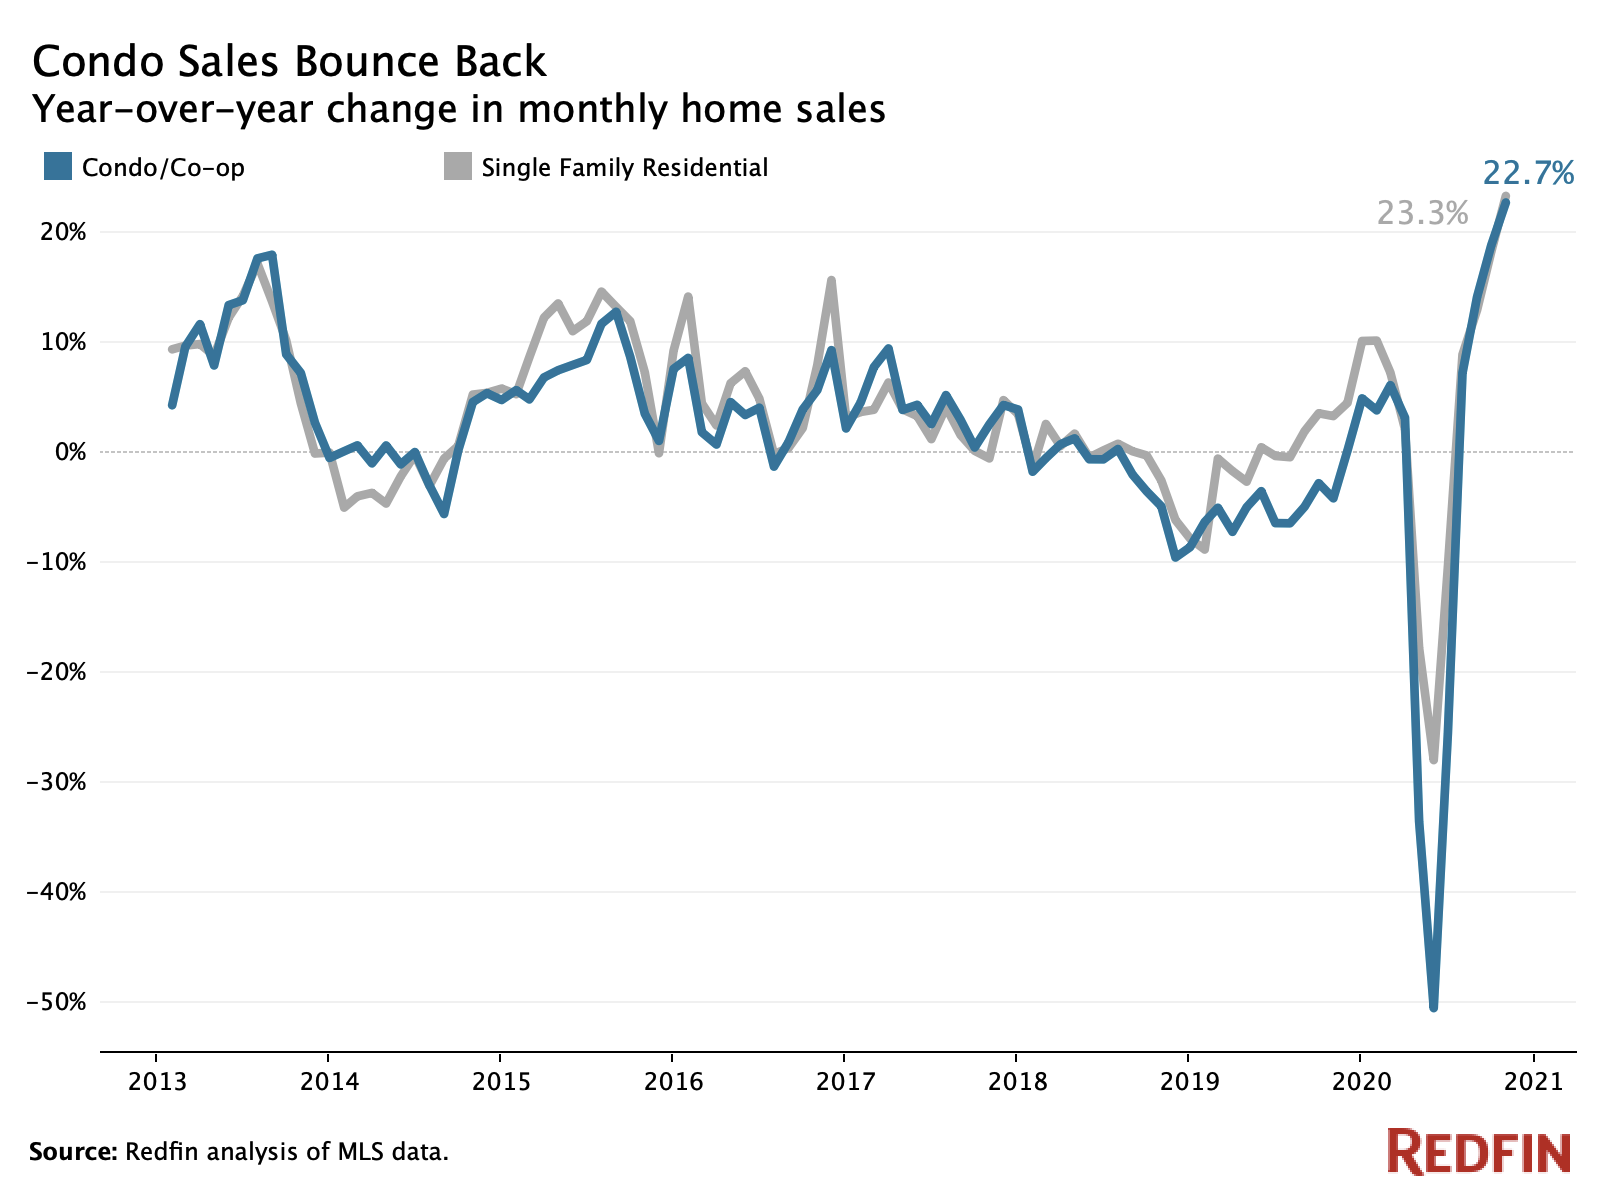
The desire for privacy during the pandemic is keeping a lid on condo prices, but condo sales are up 23%—on par with sales growth for single-family homes—as buyers take advantage of the discounts.
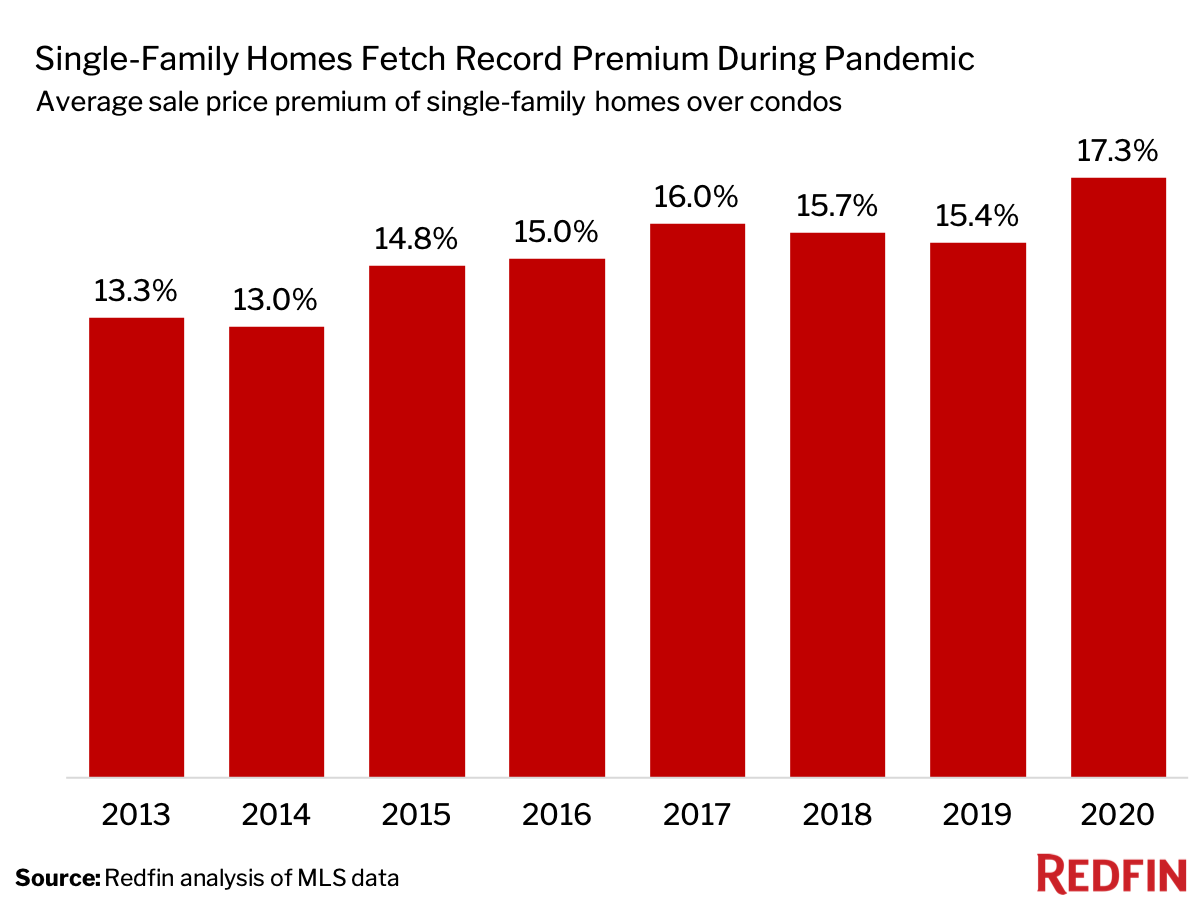
The typical single-family home that sold in the U.S. this year was purchased for an average of 17.3% more ($58,000) than the typical condo. That’s up from 15.4% last year and represents the largest premium since at least 2013, when Redfin began recording this data. This is according to a Redfin analysis of home-price data that controls for features including location, size and number of bedrooms and bathrooms.
The U.S. housing market has been on fire this year, with record-low mortgage rates and remote work prompting scores of Americans to relocate. But the condo market has missed out on much of the gains as homebuyers have left dense cities in search of more space and privacy—AKA single-family homes—during the coronavirus pandemic.
The median sale price of single-family homes surged 15.5% year over year in October, outpacing the condo market’s 9.9% growth. Condos are also taking longer to sell—the typical condo spent 36 days on the market last month, compared with 27 days for the typical single-family home. And less than a quarter (22.8%) of condos sold for more than their listing price, compared with 36.6% of single-family homes.
Purchases of condos, however, have been catching up. In October, condo sales rose 22.7% from a year earlier on a seasonally-adjusted basis, following a 50% plunge in the spring. That’s on par with the 23.3% growth in sales of single-family homes last month.
“Condos sales are rebounding because buyers are finding great deals,” said Redfin Chief Economist Daryl Fairweather. “Families are fleeing cities in search of more space in the suburbs, which has presented an opportunity for millennials who are looking to become homeowners but don’t need extra bedrooms or a backyard.”
October 2020 Market Summary: Single-Family Homes Vs Condos
| Single-family homes | Condos | |
| Median sale price | $350,000 (+15.5% YoY) | $277,000 (9.9% YoY) |
| Median days on market | 27 (-17 days YoY) | 36 (-7 days YoY) |
| Share of properties that sold above list price | 36.6% | 22.8% |
| Share of properties that faced bidding wars | 59.8% | 42.6% |
| Year-over-year change in supply (active listings) | -27.0% | 5.2% |
| Year-over-year change in homes sold (seasonally adjusted) | 23.3% | 22.7% |
Florida and California Rank at the Top of the List When It Comes to Price Premiums for Single-Family Homes
In the Fort Lauderdale, FL metropolitan area, single-family homes sold for an average of 38.3% more than condos in October—the largest premium of the 86 metros in this analysis. It was followed by Bakersfield, CA, with a 35.8% premium, and Lakeland, FL, at 34.3%. Oklahoma City, OK and Tucson, AZ rounded out the top five, both at 30.3%.
In the Seattle metro, where single-family homes are selling for a 17.9% premium, condos are taking several months to sell rather than the usual couple of weeks, according to local Redfin real estate agent Forrest Moody.
“Before the pandemic, it was challenging to find a condo in Seattle for less than $500,000, but now there are plenty selling for under $400,000. The people who are buying condos now are the people who couldn’t afford to buy one a couple of years ago because prices were so high,” he said. “I recently sold a condo that was within walking distance of Amazon’s headquarters for $510,000. Condos in that building normally go for $550,000 and up.”
Moody continued: “Having two people, a dog and a cat in a small condo no longer works when you’re at home 24/7, so folks are moving out of their condos and into houses in the suburbs or townhomes with home offices and outdoor space. A lot of people had been purchasing condos so they could be close to work, restaurants and friends, but those factors aren’t as important during a pandemic.”
There were just three metro areas where single-family homes sold for less than condos in October. San Antonio saw the biggest gap, with single-family homes going for 12.9% less than condos, followed by Omaha, NE (-6.2%) and Salt Lake City (-1.7%).
In San Antonio, there’s been a resurgence of high-end condos in the downtown area, according to local Redfin real estate agent Jim Seifert.
“There are more people buying condos in San Antonio than I’ve ever seen before,” Seifert said. “Young people who work in tech and health care are moving here from Seattle, California, Washington, D.C. and Maryland because San Antonio is so much more affordable, and they have a bigger appreciation for downtown living than the average person from Texas.”
Seifert continued: “San Antonio’s condo market is also likely being fueled by the fact that buyers know they can get in. There’s a shortage of single-family homes for sale, but the supply of condos is growing like wildfire, so some folks are opting for condos because they don’t want to deal with a bidding war.”
October 2020 Market Summary by U.S. Metro Area
| Metro Area | Sale Price Premium for Single-Family Homes (%) | Sale Price Premium for Single-Family Homes ($) | Median Sale Price, Single-Family Homes | Median Sale Price, Condos |
| Fort Lauderdale, FL | 38.3% | $149,760 | $390,876 | $158,000 |
| Bakersfield, CA | 35.8% | $95,950 | $268,000 | $152,750 |
| Lakeland, FL | 34.3% | $78,253 | $228,017 | $139,500 |
| Oklahoma City, OK | 30.3% | $58,151 | $192,000 | $112,000 |
| Tucson, AZ | 30.3% | $76,233 | $252,000 | $130,000 |
| San Jose, CA | 29.7% | $394,101 | $1,328,528 | $711,000 |
| Akron, OH | 28.1% | $49,169 | $175,000 | $158,950 |
| Camden, NJ | 28.0% | $75,653 | $270,000 | $140,000 |
| Miami, FL | 27.7% | $109,292 | $395,000 | $245,000 |
| Tulsa, OK | 27.4% | $52,071 | $190,000 | $ 95,000 |
| Hartford, CT | 27.2% | $68,516 | $252,000 | $163,000 |
| Cleveland, OH | 25.8% | $45,926 | $178,000 | $132,000 |
| Worcester, MA | 25.3% | $79,915 | $316,300 | $186,500 |
| Warren, MI | 25.3% | $61,389 | $243,000 | $171,588 |
| Stockton, CA | 24.7% | $101,110 | $409,450 | $226,000 |
| Madison, WI | 24.4% | $78,189 | $320,000 | $133,500 |
| Dayton, OH | 24.3% | $40,520 | $167,000 | $128,500 |
| Frederick, MD | 24.1% | $135,825 | $563,000 | $277,000 |
| Birmingham, AL | 24.0% | $58,095 | $242,000 | $163,500 |
| Elgin, IL | 23.7% | $64,361 | $271,000 | $150,000 |
| Chicago, IL | 23.3% | $67,334 | $289,000 | $220,000 |
| Riverside, CA | 23.2% | $101,109 | $435,000 | $315,000 |
| West Palm Beach, FL | 23.1% | $90,083 | $389,900 | $170,000 |
| Buffalo, NY | 23.1% | $41,493 | $180,000 | $128,825 |
| Phoenix, AZ | 22.5% | $73,261 | $325,000 | $215,000 |
| Orlando, FL | 22.5% | $67,374 | $300,000 | $193,500 |
| Detroit, MI | 22.2% | $39,235 | $176,450 | $174,900 |
| Sacramento, CA | 21.9% | $98,495 | $449,000 | $279,000 |
| Oxnard, CA | 21.7% | $152,753 | $705,000 | $427,250 |
| Atlanta, GA | 21.6% | $60,441 | $280,000 | $230,000 |
| Baton Rouge, LA | 21.4% | $52,524 | $245,000 | $147,500 |
| Los Angeles, CA | 21.3% | $155,446 | $729,000 | $519,000 |
| Dallas, TX | 21.3% | $65,020 | $305,000 | $205,000 |
| New Orleans, LA | 21.3% | $54,308 | $255,000 | $195,000 |
| San Diego, CA | 20.8% | $145,407 | $700,000 | $430,000 |
| McAllen, TX | 20.5% | $34,878 | $170,000 | $100,000 |
| Las Vegas, NV | 20.3% | $65,928 | $325,000 | $160,000 |
| Minneapolis, MN | 19.8% | $63,497 | $320,000 | $184,950 |
| Oakland, CA | 19.8% | $173,596 | $875,000 | $539,000 |
| Tampa, FL | 19.3% | $53,611 | $278,000 | $189,000 |
| Portland, OR | 19.2% | $86,522 | $450,000 | $279,500 |
| Lake County, IL | 18.7% | $52,436 | $280,000 | $170,000 |
| Allentown, PA | 18.5% | $46,870 | $254,000 | $152,000 |
| St. Louis, MO | 18.4% | $38,573 | $210,000 | $157,500 |
| San Francisco, CA | 18.2% | $296,113 | $1,625,000 | $1,070,000 |
| Seattle, WA | 17.9% | $116,732 | $653,000 | $405,000 |
| Austin, TX | 17.6% | $60,574 | $345,000 | $310,000 |
| New York, NY | 17.3% | $103,389 | $598,250 | $329,000 |
| Jacksonville, FL | 16.9% | $46,612 | $275,000 | $175,000 |
| Cincinnati, OH | 16.8% | $35,410 | $211,000 | $147,000 |
| Kansas City, MO | 16.4% | $40,409 | $247,000 | $159,525 |
| Houston, TX | 15.6% | $40,540 | $260,000 | $152,000 |
| El Paso, TX | 15.6% | $27,265 | $175,000 | $87,500 |
| Anaheim, CA | 14.3% | $124,592 | $870,000 | $519,000 |
| Bridgeport, CT | 13.8% | $69,017 | $500,000 | $285,000 |
| Rochester, NY | 13.1% | $21,612 | $165,000 | $101,250 |
| Washington, DC | 12.7% | $68,044 | $533,800 | $360,000 |
| Montgomery County, PA | 12.2% | $50,198 | $412,000 | $245,000 |
| Memphis, TN | 11.8% | $28,034 | $238,000 | $195,750 |
| Charlotte, NC | 11.7% | $34,994 | $300,000 | $236,000 |
| Raleigh, NC | 11.7% | $39,065 | $335,000 | $193,500 |
| Charleston, SC | 11.6% | $37,499 | $322,500 | $290,000 |
| Greenville, SC | 11.6% | $28,101 | $242,000 | $185,000 |
| Virginia Beach, VA | 11.0% | $32,021 | $289,900 | $229,000 |
| Poughkeepsie, NY | 10.8% | $31,834 | $295,000 | $226,000 |
| Philadelphia, PA | 10.8% | $39,351 | $365,000 | $355,000 |
| Pittsburgh, PA | 10.8% | $22,331 | $207,688 | $224,950 |
| Fort Worth, TX | 10.6% | $26,833 | $252,000 | $150,000 |
| Wilmington, DE | 10.6% | $31,165 | $293,000 | $165,000 |
| Cape Coral, FL | 10.2% | $28,656 | $280,000 | $195,000 |
| Providence, RI | 9.9% | $32,167 | $325,000 | $235,000 |
| Baltimore, MD | 9.4% | $39,552 | $420,000 | $245,000 |
| North Port, FL | 9.4% | $28,832 | $306,500 | $247,000 |
| Boise City, ID | 9.1% | $31,461 | $345,000 | $312,500 |
| Tacoma, WA | 8.6% | $36,019 | $420,000 | $290,000 |
| Nashville, TN | 7.0% | $22,604 | $324,900 | $299,900 |
| Boston, MA | 6.6% | $36,539 | $555,000 | $495,000 |
| Ogden, UT | 6.3% | $21,180 | $338,000 | $206,900 |
| Little Rock, AR | 5.4% | $9,847 | $182,500 | $167,000 |
| New Brunswick, NJ | 4.9% | $19,426 | $399,900 | $290,000 |
| Richmond, VA | 4.5% | $13,018 | $290,000 | $270,249 |
| Nassau County, NY | 4.2% | $22,572 | $542,500 | $451,250 |
| Denver, CO | 1.3% | $6,172 | $472,000 | $279,000 |
| Salt Lake City, UT | -1.7% | ($6,731) | $400,000 | $248,000 |
| Omaha, NE | -6.2% | ($14,163) | $229,000 | $163,000 |
| San Antonio, TX | -12.9% | ($31,229) | $243,000 | $219,000 |
Methodology
The data on the price premium for single-family homes versus condos comes from Redfin housing data. We used a model to determine the relationship between the sale prices of single-family homes versus condos in each metro area tracked by Redfin from 2013 through 2020 (the 2020 numbers are from Jan. 1 through Oct. 15). We controlled for numerous home features, including location, size and number of bedrooms and bathrooms. We determined the percent increase in the sale price correlated with a single-family home over a condo. To make it into the metro breakdown, metros had to have at least 1,500 home sales in the past year and a statistically-significant price premium (or discount) for single-family homes.


