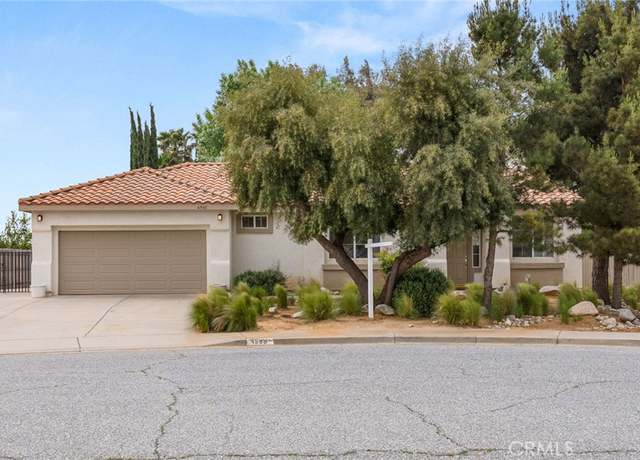
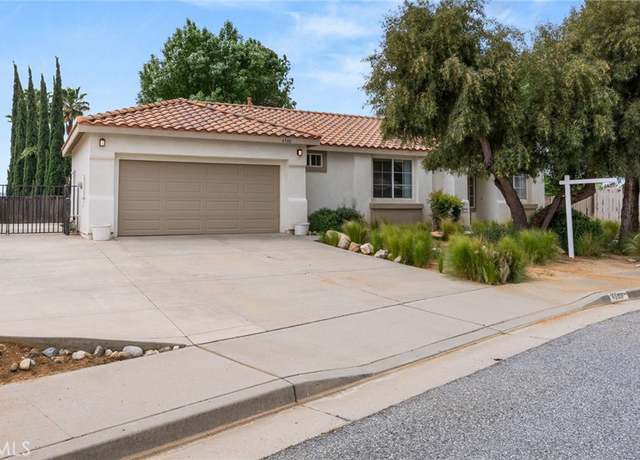
3 bed, 2 bath single level home with no HOA and sitting on a gated corner lot! The interior has a great floorplan and there is an attached 2-car garage with gated driveway parking a private backyard and gorgeous San Gorgonio Mountain views. The living room has a fireplace, the large kitchen is big enough for a dining area, the bedrooms are all generously sized, this home is ready for the new owners design. Also, conveniently located near schools, shopping, and dining options.
(Professional Photos Coming Soon) Sun Lakes Country Club is a Gated Senior Golfing Resort for 55 and over per HOA rules. Beautiful Professional 18-hole Golf Course and for added bonus there's an Executive 18-hole Golf Course. This home is a 2-bedroom, 3-bathrooms, library, formal living, formal dining, family room and a loft with its own bathroom and walk-in closet. You'll love how the homes opens up from the formal entry. Open kitchen into family room with a gas fireplace. Kitchen has beautiful white cabinets and white granite tops. Sliding glass door leads to the large, covered patio area. Great backyard for BBQ's and watching the sunrise in the morning. Master bathroom has been upgraded
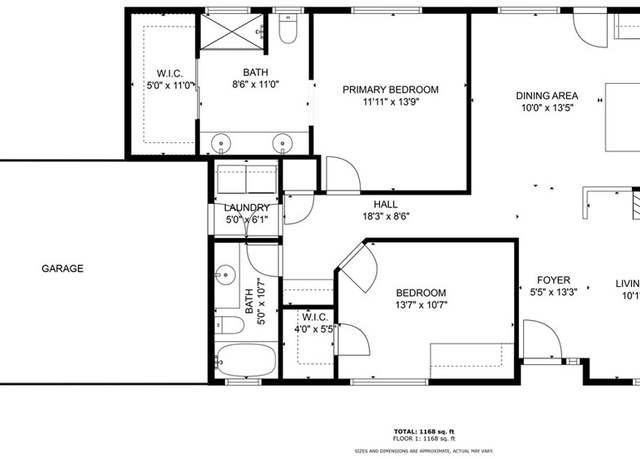
Welcome to this charming home located at 4588 Winterberry Ct, Banning, nestled on a spacious pie-shaped lot in a serene cul-de-sac. This lovely property boasts 2 bedrooms, including a large master suite equipped with dual vanities and a walk-in shower, providing a private retreat for relaxation and comfort. The home has been freshly updated with new paint and flooring throughout, creating a clean and modern atmosphere. The heart of this home is the open kitchen, perfect for the culinary enthusiast, featuring a large center island, a 4-burner gas range, and ample storage space. This area is ideal for hosting gatherings and preparing delicious meals. Adjacent to the kitchen is a cozy living r
Home Priced Right 2 bedroom , 2 bath has separate family , living room. Central Heat and A/C. Built in Hutch, there are ceiling fans. Kitchen snack bar . . appliances included also freezer in shed. This home has double windows. . and metal insulated roof. park has activities. Close to some shopping
* * HUGE LOT * * HUGE LOT * * HUGE LOT * * Beautiful one story home in the city of Banning, sits on almost a 1.5 AC LOT. This home/lot has street access from the back, with options of subdivision, ADU, a farm, garden, and much more (buyers to verify all information with the city). This lot also has a lot of space for parking, RV parking, boat parking, etc. . This home features four bedrooms and two bathrooms. A lot of upgrades have been done including: NEW waterproof laminate floor, NEW carpet in the bedrooms, NEW roof, NEW remodeled kitchen cabinets, Quartz countertops with NEW Stainless steel appliances and sink, NEW recessed lighting, two NEWLY remodeled bathrooms with NEW vaniti
Welcome to this beautiful 4-bedroom (plus loft), 3 bath home situated in the highly sought-after Sundance North Community. Nestled in a prime location, this extraordinary property sits on one of the best lots in the neighborhood with no rear neighbors and boasts stunning snow capped mountain views from the second level that gives you peace, tranquility & park-like-privacy! Upon entry, you will immediately see the pride of ownership on display in this well-maintained home with a bright and open floor plan designed for grand living and entertaining. The versatile floor plan includes formal dining room, family room and oversized loft. The kitchen features an open-concept design, expansi
~GORGEOUS 3 BEDROOM~ABSOLUTELY IMMACULATE AND PRIDE OF OWNERSHIP SHOWS THROUGHOUT~LOCATED IN BANNING'S GATED "ALL AGE" COMMUNITY OF LINDA VISTA~UPGRADES THROUGHOUT INCLUDE . .. PAINTED INTERIOR, LAMINATE FLOORING, 6 PANEL DOORS, NEW VENT COVERS AND RETURN VENTS, PLUS NEWER APPLIANCES~BRIGHT AND SPACIOUS LIVING ROOM WITH CATHEDRAL CEILING PLUS CEILING FAN AND NEWER WALL SWAMP COOLER IN 2020 ~ SPRAWLING KITCHEN WITH CABINETS AND COUNTER SPACE GALORE PLUS BREAKFAST BAR THAT PROVIDES ADDITIONAL STORAGE, NEW CABINET AND DRAWER HANDLES & KNOBS, NEW DISPOSAL APRIL 2024, NEW STOVE, HOOD AND DISHWASHER IN 2023, NEW FRIDGE IN 2020.. .FRIDGE INCLUDED~FULL SIZE DINING ROOM WITH NEW CHAN
Step into this exquisite newer home boasting 4 bedrooms and 3 bathrooms, nestled in the sought-after west Banning area, meticulously crafted by renowned builder, "Tri Pointe Homes, " within the charming new community of Atwell. Upon arrival, a welcoming foyer beckons, leading you into a well-designed layout. To your right, discover a lower-level bedroom and bathroom, perfect for guests or adaptable to your lifestyle needs. The heart of the home unfolds into a spacious open-concept kitchen and family room, ideal for both gatherings and daily living. Indulge your inner chef in the well-appointed kitchen, boasting sleek granite countertops, upgraded cabinets, and stainless steel appl
55+ GATED COMMUNITY/ OCCUPANTS MUST BE 55+ Light and bright home with 2 bedrooms, 2 baths. Open living area with vaulted ceilings, attached 2 car garage and indoor laundry room. Spacious master bedroom, walk-in closet and ensuite bathroom. Gated community amenities include Clubhouse, Swimming Pool, Spa, Fitness, Events, Games, Classes and Tennis Courts. Located just a short distance from the Cabazon Shopping Outlets and the Morongo Casino. Buyer to cooperate with Seller's 1031 tax deferred exchange.
Premier turnkey home in the Fairway Villas of the prestigious 55+ Sun Lakes Country Club! Enjoy a low-maintenance, active living country club lifestyle with all the conveniences plus a splash of luxury. This highly-desired Pebble Beach model features custom louved shutters, upgraded cabinets, granite counter tops, and ceiling fans and fixtures throughout. A striking foyer with custom tile medallion and chandelier greets you along with soaring cathedral ceilings and voluminous natural light through oversized windows; this entry provides easy central access to every room. The spacious living room boasts a custom stone fireplace and mantle and connects seamlessly to a cozy dining nook. Enter a
Discover your ideal retreat in this charming 55+ community! This lovely home sits on a 6,534 sqft. lot with plenty of space to relax and enjoy. Inside, there's extra room to accommodate all your needs, while outside, a beautiful front and backyard await, complete with plants and fruit trees. Plus, with an incredibly low annual HOA fee of only $110, living here is both affordable and enjoyable. Come see for yourself – this could be your perfect place to call home!
CHARMING VICTORIAN STYLE HOME READY TO MOVE IN! HARD WOOD FLOORING THROUGHOUT THE FIRST FLOORS, FIREPLACE IN THE LIVING ROOM, ON JUST UNDER 2800 SQ FEET OF LIVING SPACE. PROPERTY SITS ON UNDER 1/2 ACRE LOT. BEAUTIFULLY LANDSCAPPED FRONT AND BACKYARDS. OUTDOOR PATIO IS PEREFECT FOR ENTERTAINING AND FAMILY GATHERINGS! POOL AND JACUZZI IDEAL FOR THOSE SUMMER DAYS. UPSTAIRS INCLUDES THE PERFECT CRAFT-ROOM, MANCAVE, GAMEROOM OR FAMILY ROOM YOU'LL EVER NEED. A BEDROOM AND TWO BONUS ROOMS ARE ALSO UPSTAIRS. RV PARKING WITH RV HOOKUPS, DRIVEWAY THAT CAN EASILY ACCOMODATE 6-8 CARS. TOO MUCH TO MENTION! MUST SEE! BRING YOUR PICKY BUYERS TO THIS ONE. 1/2 OF THE GARAGE HAS A CONVERSION OF AN ADDITIONAL
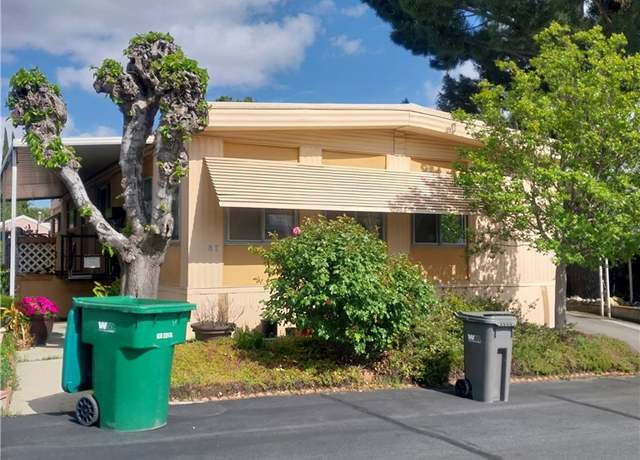
Welcome to your mountain oasis! This sleek doublewide offers stunning views from its front porch. Inside, enjoy top-notch appliances, a kitchen island with outlet and USB port, and ample storage. Stay secure with a RING Security system. Relax with its easy-care lawn and pet-friendly spaces.
GATED COMMUNITY * ALL AGES WELCOME PARK * LOTS OF AMENITIES! BEAUMONT SCHOOL DISTRICT * THIS 2 BED/ 2 BATH , 1224 SQ ft. with a bonus room that is approximately 12x 8 (is not included in the square footage) Located in Banning. As you walk into this beautiful home, you enter the spacious living room that will lead you to the dining area and kitchen. Heading down the hallway you will enter the laundry room, and as a bonus the sellers will be leaving their beautiful washer and dryer! The first bedroom, you can actually walk through to see another bonus area that would be perfect for an office, craft room or mancave! Continuing down the hallway is your first bathroom and finally your
Beautiful Turnberry floorplan located in one of Southern California's premier 55+ community of Sun Lakes. This home has great useable space including 2 bedrooms, 2 baths and a den or office and formal or in-formal dining room. The kitchen comes with a new microwave and range and plenty of storage. Head outside from 3 different sliders (main bedroom, living room, and kitchen) to a beautifully landscaped yard and large patio where you can entertain friends and family and also enjoy the tranquility with no s neighbors behind you. Sun Lakes CC has 2 golf courses, a championship course as well as an executive course, 3 clubhouses, 3 swimming pools (one indoor pool), exercise rooms, pickleball co
If you are waiting to buy an amazing single family residence, THE WAIT IS OVER! Welcome to 998 Sycamore Court; This beautiful home has 4 bedrooms and 2 full bathrooms and the upgrades in this home are undeniably amazing. From the all new flooring throughout the home or the brand-new kitchen appliances, this home has what you need to make this your newest investment. The driveway has been extended to fit a RV trailer and the backyard has had major upgrades from a beautifully installed retaining wall and a durable covering patio. The landscaping has been well kept and ready for those summer bbqs. Both bathrooms have been completely redone and have beautiful new vanities installed. This home h
Step into this enchanting 4-bedroom, 2-bathroom home located in the heart of Banning, CA, boasting a delightful blend of vintage charm and serene, Zen-like outdoor spaces. This residence exudes character and tranquility at every turn. Upon entry, you'll be captivated by the vintage furnishings and Art Deco touches that adorn the living spaces, creating a warm and inviting atmosphere. The living area features classic geometric patterns, elegant light fixtures, and tasteful décor, setting the stage for relaxed gatherings and comfortable living. The bedrooms are spacious and offer a peaceful retreat from the world outside. The master suite boasts its own stylishly appointed en-suite bat
Welcome to the this Beautiful Home awaiting you in Banning—with a spacious 3-bedroom, 2-full bathroom home that embodies both elegance and practicality. As you step inside, you'll be greeted by the breathtaking openness of the living area, highlighted by high church ceilings that create an immediate sense of space. Natural light floods the room. The kitchen is a true standout, integrated into the layout to entertain and everyday living. Find a breakfast bar counter top, perfect for casual meals or catching up with loved ones over coffee. The addition "Curio Cabinets" adds a touch of vintage flair. The best feature of this home is the converted ADU garage—a space spanni
Welcome to your FULLY PAID SOLAR dream home in the Four Seasons Beaumont 55+ community! This exceptional 2019 build offers a unique blend of elegance, comfort, and modern upgrades that make it a true gem within this exclusive community. As you approach the property, you'll immediately notice the eye-catching curb appeal with turf/rock landscaping, an expanded driveway with stamped concrete, custom lit stone columns, custom matching porch and security metal gates, and a brand new glass front door, setting the tone for what lies beyond. Upon entering, you'll be greeted by a spacious hallway enriched with elegant wainscoting and fresh paint. This inviting open-concept layout is designed to max
Step into the ease of modern living with this stunning 4 bedroom, 3 bath home that offers the perfect blend of functionality and style. This Home is located in the sought-after west Banning area, and crafted by Tri Pointe Homes in the new community of Atwell. The first floor is welcoming with an open floor plan, highlighting a spacious living room that flows seamlessly into a chef's dream kitchen, complete with a large quartz island, stainless steal appliances, and extensive cabinet space. The downstairs includes a versatile bedroom and full bath, ideal for guests or as a home office. Ascend to the second level where a cozy loft awaits, alongside two additional bedrooms and a renovated laun
Seller will give buyer a credit, schedule a showing for more information!! Experience the ultimate California living with this exceptional tri-level home nestled in the foothills of North Banning. Boasting an impressive 2,434 square feet, this property offers a rare blend of breathtaking panoramic views, unparalleled amenities, and flexible living spaces. Indulge in the ultimate relaxation with an indoor pool and spa, where you can unwind while taking in the stunning views of the San Jacinto Mountains. The lower level features a private guest bedroom with its own full bathroom and living area, perfect for extended family or a potential renter seeking privacy and independence. The main floor
Popular PAVE Model, one-level on the Golf Course with Mountain View and scenic lush trees. .. .. in Sun Lakes CC, 55+ Community. .. .2 Bedrooms and Den, (den has builtins)Kitchen and Baths are Upgraded. .. Living Rooms looks out to Extended Large Patio and Views. .. .Wood Floors, Shutters, Crown and Baseboard Moulding. Bedrooms have mirrored wardrobes. .. Fans in Most Rooms and Patio. .. .Separate Laundry with Large Sink. .. .2-car Garage with Golf Cart space. .. .SLCC Community offers 2-18 Golf Courses, 2 Pro Shops, 3 Clubhouses, 2 Restaurants, Bar and Lounge, Tennis, Pickleball, Bocce Courts, swimming Pools (one indoors) 3 Fitness Centers, many Social Clubs, Bingo, RV Club. .. .. .. .Loca
Welcome to 733 Daybreak Way, nestled in the serene senior community of Serrano del Vista in Banning, CA. This meticulously maintained 2-bed, 2-bath turnkey home offers comfort and charm at every turn. Upon entry, you're greeted by the inviting living room featuring a captivating stone fireplace, setting the perfect ambiance for cozy evenings. The allure of wood flooring runs seamlessly throughout the entire home, adding warmth and character. The kitchen and bathrooms have been tastefully remodeled, boasting modern finishes and fixtures, ensuring both style and functionality. Shutters adorn the windows, adding privacy and style to each room. Step outside to discover a private backyard retrea
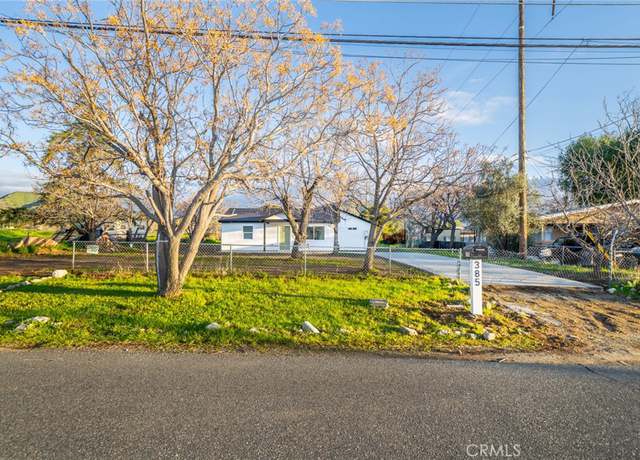
Exciting Chance to Acquire a Lovely Mountain Home A charming home situated near Interstate 10 in a welcoming rural community offers picturesque views through its spacious front windows and front and back decks. This two-bedroom, two-bathroom residence is ideal for those seeking a tranquil and serene living space. Additionally, there is a spacious outdoor structure that can be utilized as an arts and crafts studio or possibly even more creative ideals. Priced attractively, this property is a rare find and is expected to be sold quickly. This property also comes with an adjoining lot for that little extra space. Contact an agent today to seize this opportunity!
Welcome to the prestigious Altis 55+ community! This impeccably crafted home, built in 2022, with paid solar for energy efficiency and savings, boasts modern elegance and thoughtful design throughout. Spanning 1,534 square feet, this residence offers a comfortable and spacious layout with 2 bedrooms and 2 bathrooms. With this home the refrigerator, washer and dryer stay. You'll appreciate the drought-tolerant and easy-care maintenance of the front landscape, complemented by a concrete walkway leading to the covered entrance featuring an upgraded door. Step inside to discover a neutral palette adorned with exquisite details including 5-panel doors and plantation shutters creating a bright an
Enjoy all the benefits of brand-new construction. State of the art energy efficiency. Latest design and high quality with an award-winning builder backed warranty. NO HOA and plenty of room for RV parking. Experience the allure of this beautiful single story home, offering an inviting 2,070 sqft of open living space. With 3-4 bedrooms, 2.5 bathrooms, Office, 3-car garage and located on a large ADU compatible lot with RV parking, this residence perfectly blends comfort and functionality. Throughout this home, you'll find the distinctive features of CrestWood Communities. Marvel at the soaring 9-foot ceilings that create a sense of spaciousness and grandeur in every room. The kitchen shines w
Come and See This Amazing Home located in Resort setting. HUGE LOT! * * ASK ABOUT RATE BUY DOWN * * Everything is NEW NEW NEW . .. NEW Windows, New Roof, New Siding Ect. . Open concept floor plan. Master bedroom with private entrance, walk in closet and overhead rain shower. Appliances included, Stove, Microwave, Dishwasher. Convenient inside washer/dryer connection. New Permitted Upgraded 200 Amp Electric Panel and wiring. Energy efficient dual pane windows. RV parking, RV Connections. Large lot for entertaining etc. Mature Trees keep the home cool all summer. Located conveniently off 10 freeway Sunset Exit, Just one exit after Highland Springs Shopping. Located in Sylvan Acres com
Beautiful 2 bedroom and 2-bathroom home located in the wonderful (55+) Community of Mountain Springs. This home features a large family room with plantation shutters and ceiling fan, a spacious kitchen with breakfast nook and lots of cabinets, nice dining room with ceiling fan, indoor laundry room with desk area and cabinets, spacious guest room with large closet, guest bathroom has walk in shower and 1 vanity, large primary bedroom with walk in closet, primary bathroom with 1 vanity, garden tub and walk in shower. There is a covered patio in the back with a fenced in yard with grass and two car garage. A/C and furnace are only a couple of years old. The Mountain Springs Community amenities
"Muirfield" 3 Bedroom, 2 1/2 Bath Single Family Home On The Golf Course. Spanish Pavers Walkway Lead to Double Door Entrance. Interior Entry has Tiled Floors Entry with Dramatic Staircase and Vaulted Ceilings. Formal Dining Room w/ Plantation Shutters has 2-Story Ceilings, Living Room has Newer Carpet and Vaulted Ceilings, Separate Family Room is open to Kitchen and Overlooks the Golf Course. Freshly Painted Interior and Exterior!! Brand New Door Knobs thru-out, Upgraded Faucets in all Bathrooms, Knock-Down Ceilings and Bull-Nosed Corners. Raised Hearth Brick Gas Fireplace w/ Mantle and New Glass Door in Family Room. Spacious Island Kitchen features Brand New Stainless Steel Refri
Investor special 2BR/1BA with updates to kitchen, bathroom, flooring including a 3rd BR addition not shown on Title; all subject to Buyer inspection. This is currently a rental property with month-to-month tenants that will move out April 30th, 2024. Conveniently located just a short drive from the I-10 Freeway in the San Gorgonio Pass, Banning is the fastest growing City in California with nearby shopping at the Desert Premium Outlets Cabazon and ample entertainment in the Coachella Valley. Across the street from Sylvan Park - playground, picnic area, basketball court and baseball field. upside potential in rental income for investor-buyer!
Investor special 2BR/1BA corner lot, zoned R3. Buyer to verify zoning/use. Recent updates to the kitchen, bathroom, flooring and roof; all subject to Buyer inspection. This is currently a rental property with 7 months remaining on the existing rental agreement. Conveniently located just a short drive from the I-10 Freeway in the San Gorgonio Pass, Banning is the fastest growing City in California with nearby shopping at the Desert Premium Outlets Cabazon and ample entertainment in the Coachella Valley. Great upside potential in rental income for investor-buyer!
Investor special with R3 zoning on a large 20,909sf lot! 1BR/1BA, with 2BR additions (1 detached) not shown on Title. There have been recent updates to the kitchen, flooring and roof; all subject to Buyer inspection. This is currently a rental property with month-to-month tenants who are willing to stay. Conveniently located just a short drive from the I-10 Freeway in the San Gorgonio Pass, Banning is the fastest growing City in California with nearby shopping at the Desert Premium Outlets Cabazon and ample entertainment in the Coachella Valley. Walking distance to Sylvan Park - playground, picnic area, basketball court and baseball field. Great upside potential in rental income for investo
Investor special 2BR/1BA with updates to kitchen and paint, including a 3rd BR addition not shown on Title; all subject to Buyer inspection. This is currently a rental property with month-to-month tenants. Conveniently located just a short drive from the I-10 Freeway in the San Gorgonio Pass, Banning is the fastest growing City in California with nearby shopping at the Desert Premium Outlets Cabazon and ample entertainment in the Coachella Valley. A close distance to Banning Aquatic Center. Great upside potential in rental income for investor-buyer!
This area's enrollment policy is not based solely on geography. Please check the school district website for more information.
Elementary schools
Middle schools
High schools
GreatSchools Summary Rating
4/10
Hoffer Elementary School
Public, K-5
4/10
Hemmerling Elementary School
Public, K-5
3/10
Banning Independent Study School
Public, K-12 • Choice school
3/10
Central Elementary School
Public, K-5
-/10
Renu Hope Preschool
Public, N/A
Only showing 5 of
8 elementary schools.
School data is provided by GreatSchools, a nonprofit organization. Redfin recommends buyers and renters use GreatSchools information and ratings as a first step, and conduct their own investigation to determine their desired schools or school districts, including by contacting and visiting the schools themselves.Redfin does not endorse or guarantee this information. School service boundaries are intended to be used as a reference only; they may change and are not guaranteed to be accurate. To verify school enrollment eligibility, contact the school district directly.
Banning, California boasts a well-structured transportation system, with a variety of options for residents. The city experiences moderate traffic levels, making driving by car a feasible option for most locals. Banning is also serviced by public transportation, including buses, providing an alternative to car travel. Additionally, the city is conveniently located near several major highways and freeways, enhancing its connectivity to other regions. Learn more on our Banning city guide.
What types of properties are available in Banning?
Banning, California offers a variety of single-family home types, including ranch-style homes, contemporary homes, and modern homes, each with their own unique architectural features and designs. These homes can be found throughout the city, in neighborhoods such as Sun Lakes Country Club, Fairway Canyon, and Banning Bench. Most properties in Banning, California feature 2-4 bedrooms and were built within the last 20 years. To explore different property types for sale in Banning, California, use the 'Home type' filter located above the active listings. Customize your search by selecting options like single-family homes, condos, townhomes, and more.
What is life like in Banning?
Banning, California offers a serene environment with picturesque landscapes that showcase the beauty of nature. The region experiences a pleasant Mediterranean climate, characterized by mild winters and warm summers. The local economy provides a range of job opportunities across various industries, ensuring a diverse employment landscape. Residents have access to a variety of recreational activities, including outdoor adventures and cultural experiences, making it an ideal location for those seeking an active and engaging lifestyle. The community fosters a vibrant social scene, with numerous events and gatherings that bring people together.
What are the schools and amenities like in Banning?
Banning, California offers a wealth of public amenities to cater to the needs and interests of its residents. The city boasts a variety of restaurants, serving a wide range of cuisines to satisfy diverse palates. Numerous parks provide spaces for leisure and relaxation, while also serving as venues for community events. Grocery stores are conveniently located throughout the city, ensuring easy access to daily essentials. In addition, Banning hosts several other amenities such as fitness centers, libraries, and retail shops, contributing to a vibrant and convenient living environment.
In the past month, 34 homes have been sold in Banning. In addition to houses in Banning, there were also 11 condos, 1 townhouse, and 6 multi-family units for sale in Banning last month. Banning is a minimally walkable city in Riverside County with a Walk Score of 29. Banning is home to approximately 29,403 people and 4,477 jobs. Find your dream home in Banning using the tools above. Use filters to narrow your search by price, square feet, beds, and baths to find homes that fit your criteria. Our top-rated real estate agents in Banning are local experts and are ready to answer your questions about properties, neighborhoods, schools, and the newest listings for sale in Banning. Our Banning real estate stats and trends will give you more information about home buying and selling trends in Banning. If you're looking to sell your home in the Banning area, our listing agents can help you get the best price. Redfin is redefining real estate and the home buying process in Banning with industry-leading technology, full-service agents, and lower fees that provide a better value for Redfin buyers and sellers.


 REDFIN IS COMMITTED TO AND ABIDES BY THE FAIR HOUSING ACT AND EQUAL OPPORTUNITY ACT. READ REDFIN'S FAIR HOUSING POLICY AND THE NEW YORK STATE FAIR HOUSING NOTICE.
 United States
 Canada