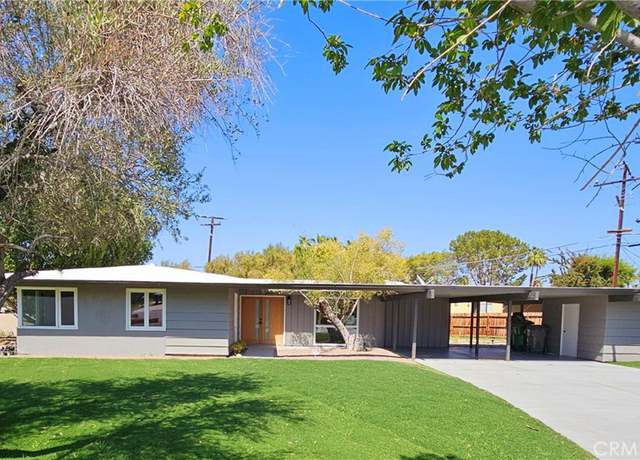
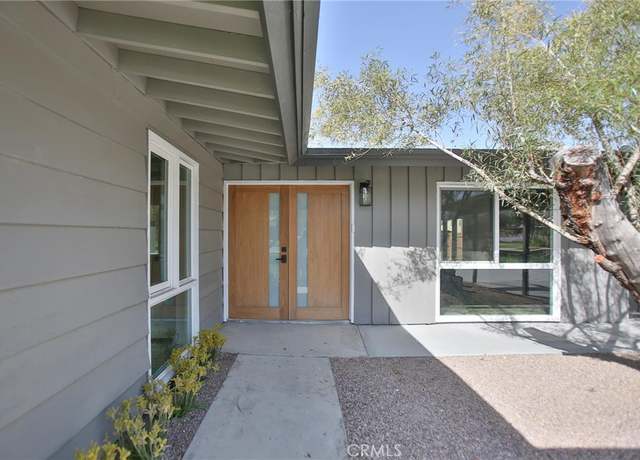
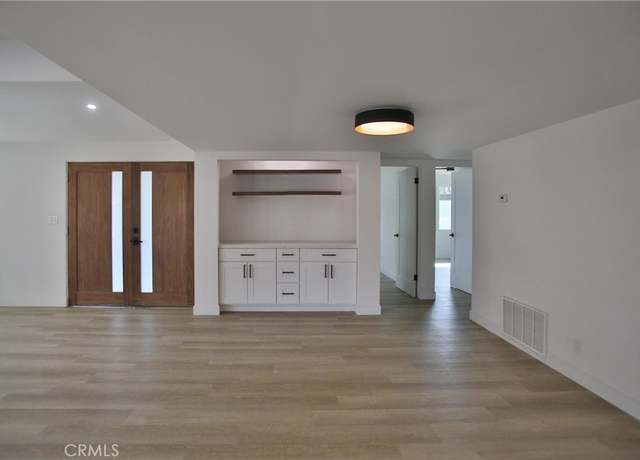
Experience unparalleled luxury living in this newly remodeled mid-century modern home, nestled on the largest lot in the neighborhood. This residence, with 3 bedrooms, 2 bathrooms, offers the ultimate blend of style, sophistication, and convenience. Newly Renovated: Impeccably redesigned with meticulous attention to detail, this home showcases new paved driveway, new front lawn with sprinkler system, new interior/exterior paints, level 4 smooth drywall finish, new waterproof vinyl flooring, new windows and new beautiful front door, remodeled kitchen with quartz countertops, new appliances, remodeled bathrooms, and many more. Premier Location: Enjoy the epitome of convenience with direct acc
Fantastic location near the Mountain View Clubhouse. Nice curb appeal, featuring a gated courtyard providing curb appeal. Popular Orrefors model features 2 bedrooms/2 baths, plantation shutters, tile floors throughout except in the bedrooms. Sitting on a spacious lot, this home has a private rear yard with low maintenance, desert landscaping, an extended patio and alumawood cover. Inside 10ft ceilings, transom windows and rounded hall entry ways provide a light and open environment. A tile trimmed fireplace is in the family room. The kitchen has slab granite counters & backsplash with pullout shelves in the kitchen. The primary suite has crown molding and a walk-in closet with mirrore
INVESTOR'S DREAM! Beautifully updated golf course condo. Lovely views of the Championship course, with distant mountain views from the family room, primary bedroom and rear patio. This 1,343 sq ft, 2 bed, 2 bath Jacaranda model features front courtyard and rear patios. Rich cabinetry with plenty of built ins and wine refrigerator. Newer roof, smooth ceilings, slab granite kitchen counters with outdoor access for easy Al Fresco dining. Baths redone with granite counters. Proudly entertain on the picturesque interlocking brick golf course view patio, or on the private upgraded courtyard patio. Palm Valley Country Club is a guard gated community with the look and feel of a vacation resort. The
This property is a real gem! Its location on the Palm Desert Country Club golf course offers stunning views and a serene atmosphere. The large pool-sized yard with mature landscaping is a perfect oasis for relaxation and entertainment. The upgrades, including the newer HVAC system, water heater, and electric panel, show the home has been well-maintained and modernized for comfort and efficiency. The new master bath with a walk-in shower and updated guest bath adds a touch of luxury. The newer carpet in the bedrooms and all-tile floors in the main living area offer both comfort and easy maintenance. With 2 bedrooms plus a den/bonus room, this home offers versatility for various lifestyle ne
Welcome to The Retreat at Desert Willow, where you can indulge in a breathtaking view, tranquility, and complete privacy. Prepare to be amazed as you step into this modern home and witness the awe-inspiring south facing panorama of the Santa Rosa Mountain range. Start your day with a cup of coffee or unwind with an evening cocktail on your exclusive patio, savoring the picturesque vista. This remarkable Plan 1 (Sanctuary) residence offers 2 bedrooms, a den/office, and 2.5 baths. The great room boasts a gourmet kitchen with a spacious island, Bosch appliances, a walk-in pantry, a dining area, and direct access to the expanded private patio. Custom automatic blinds adorn every window. The exp
Stylishly remodeled Indian Wells home in the gated Colony Cove community. Beautiful 3 bedroom 3 bathroom open floor plan home with a large den/office complete with designer furnishings. This 2,287 square foot home features a remodeled kitchen with newer cabinets, stone counter tops and premium stainless steel appliances, remodeled bathrooms with newer stone counter tops, fixtures and tile showers, newer laminate flooring throughout the main living areas and upgraded carpet in the bedrooms, plantation shutters and designer paint inside and out. The home features two very different outdoor living areas. The south facing front courtyard is an entertainer's delight with stunning views of the Sa
Sun City Palm Desert - Baccarat - 1,836 SF floorplan. This updated newly painted interior & exterior home welcomes you w/ gated courtyard & gorgeous glass double doors. Foyer has dramatic 12-ft coffered ceiling, tile & deluxe vinyl wood plank flooring, taller baseboards & plantation shutters throughout. Elegant lines w/ 10-foot ceilings, transom windows, rounded hall entryways & art niches. With new HVAC, this Spacious 2-Bedroom/2 Bath, plus Bonus Room w/ closet is off main hallway & can be set-up as an office or workout area. Kitchen features beautiful tiled backsplash, stainless appliances, under cabinet lights & nice-sized pantry. Family Room &a
Welcome to your little bungalow within Golden Sun Estates (all ages) in Palm Desert, CA! This charming 2 bed, 2 bath home offers comfort and convenience. Step inside to discover a spacious layout filled with natural light, highlighted by a nice open kitchen and cozy living area with fireplace, perfect for relaxation. The master bedroom with an ensuite bath and double closets offers tranquility, while the second bedroom offers versatility for guests or a home office. Outside, a delightful east-facing patio awaits, promising serene mornings and shaded afternoons. Plus, with a 2-car garage, parking is a breeze. Enjoy resort-style amenities including tennis courts and a sparkling swimming pool
South Palm Desert Rancher! LOCATION + VALUE meets a beautifully UPDATED home near El Paseo which is surrounded by one of the most desirable zip codes in the valley. Flow is another plus with open concept living, dining, and kitchen spilling over to a large family room. Stylish finishes and high gloss European style built-ins set the scene for comfortable entertaining. Patios, both front and back, beautifully frame this 3-bedroom, 2-bath home with 1,807 square feet. Spacious ensuite Primary Bedroom features direct patio access, dual closets, and an updated bath with built-ins. Custom window treatments including shutters and shades are a theme throughout. Guest Bedrooms #2 and #3 are both pos
Step into the to-the-studs renovated modern luxury villa and you're immediately greeted by the expansive open floor plan, accentuated by natural light streaming in through commercial quality floor-to-ceiling glass. The design features sleek lines, minimalist decor, and a neutral color palette with subtle pops of color that add warmth and sophistication. The expansive living area boasts high ceilings and a seamless flow into the dining space and kitchen. The kitchen is a chef's dream, featuring top-of-the-line Sub-Zero, Thermador and Bosch appliances, a large quartz island with bar seating, and custom cabinetry with every imaginable feature. The centerpiece of the home is its jaw-dropping ce
LIGHT & BRIGHT at Del Webb Sun City! The popular Monaco floor plan is a winner, be it full-time or seasonal. 3 bedrooms, 3 bathrooms and 2,323 square feet. Fabulous curb appeal begins to tell the story. Private, north-facing backyard with covered patio framed by mature landscaping. Open concept living allows for effortless flow between living, dining, kitchen, and family room. Tall ceilings and large rooms are a theme. The island-centered chef's kitchen is a delight in terms of scale as it opens to family room + casual dining area. Bedrooms enjoy a nice separation with two ensuite primary bedrooms positioned on opposite ends of the home. A glass slider opens to the patio from the nort
This updated fully furnished home has all the right touches and offers the ultimate in desert luxury with amazing southwest views. The open-concept 2-bedroom, 2 baths with den is an entertainer's dream. The living room has added windows making the room very bright. The remodeled kitchen has stainless-steel appliances and recessed lighting. In addition, the den has skylights for natural light. Highlights include ceiling fans, rolling shutters, vaulted ceilings, and crown molding throughout. The back patio features two seating areas and a fire pit for entertaining family and friends with breathtaking silhouettes of the mountains and palm trees. Enjoy the benefits of being a part of the beauti
Experience luxury living at its finest in this extensively upgraded 4 bedroom home with 4 fireplaces and a 3 car garage! Over the past four years, this home has been meticulously renovated, boasting a custom grand front entrance, new windows, 2 HVAC units with smart thermostats, kitchen with Bosch appliances, a custom eat in nook and wet bar area. The 3 bathrooms have been remodeled with a custom shower in the primary bath. Other upgrades include LED lighting throughout, window treatments, upgraded outlets with dimmers and USB options, new hardware throughout, interior and exterior paint, custom built in cabinets in the garage, EV ready outlet in the garage, new flooring and more! There are
Sun City Palm Desert - San Remo model home located in Sun City Palm Desert, an upscale guard-gated golf course community. The list price of this home reflects the current conditionand it offers the perfect opportunity for investors or homeowners wanting to include their personal touch and style into this home. This 3-bedroom, 2.5-bathroom, 2,432 sq. ft home is located on a corner lot. This home has a large covered patio and private rear yard. Enter this home through a gated front courtyard and double door. Inside, soaring ceilings create an airy, expansive atmosphere, inviting you to unwind and entertain with ease. Enjoy the warmth of the family room's cozy fireplace. The kitchen features C
This one-of-a-kind 2 bedroom, 2 bathroom condo in the heart of South Palm Desert in the Sommerset community features a gorgeously REMODELED kitchen that highlights the quartz countertops, custom-made cabinets, center island with a seating area, top-of-the-line black slate finish appliances, and recessed lighting. The sellers went all out in creating this magnificent kitchen including a wine fridge with 40 bottle capacity. The layout of this home has natural lighting and is spacious which makes it perfect for entertaining guests. This condo also has a private patio that opens up to a beautiful grass area that is maintained by the HOA. In addition, this property has an attached car garage. Th
Don't miss out on this elegantly renovated, turnkey furnished Sandpiper condo. This William Krisel design features classic mid-century modern architectural details that have been enhanced with chic, modern updates! Natural light pours into every room and the beautiful south-facing pool & mountain views bring a sense of calm & serenity. Elegantly reimagined, you'll appreciate the attention to detail in every room, from the Italian porcelain tile floors to recessed lighting throughout. The recently updated kitchen offers a gas range, new cabinets with custom doors, quartz countertops, a slimline microwave/range hood, a counter-depth refrigerator, and a separate beverage fridge. A
With panoramic views of the golf course and mountains beyond, this extensively updated Montego model is a show stopper. Freshly painted both inside and out. Kitchen has new leather look quartz countertops and striking backsplash. New vinyl sliders in great room and guest BR. 5'' baseboards throughout the home. Tile accent wall in entry. Large master BR, walk-in closet and dual vanities in bathroom. Guest BR and 3rd BR/den provide just the right amount of square footage. The south facing orientation provides a light and airy atmosphere. Backyard has a paver patio which seems to go on forever, perfect for a get-together or a huge party. This home is offered turnkey furnished. Everything seen
ONE OF THE BEST LOCATIONS! Set in the crown of Palm Desert walking distance to the MCCallum Theatre, College of the Desert, El Paseo shopping and dining, Whole Foods and Trader Joe's. Too many places to mention and explore. Single family home built in 2005, newly renovated kitchen in 2023. Kitchen was upgraded with beautiful Savannah sand cabinets, with soft close drawers and thought out design. Kitchen is equipped with Zline Autograph edition appliances, fingerprint resistant stainless steel 6 burner front control gas cooktop range, built-in wall oven, built-in combination microwave oven/convection oven, dishwasher to match. Home is set-up with entertainment and hosting in mind. The kitch
Welcome to Chaparral Country Club. This magnificent property is move in ready. Completely remodeled three bedrooms, 2 bathrooms, that shows like new! The kitchen boasts a new center island, with new appliances, and new cabinets. The living room has a stunning fireplace with spectacular south views of the mountains and 18 hole putting green. The bedrooms have new ceiling fans. New luxury vinyl flooring and fresh paint throughout the entire home. The guest bathroom has a new tile shower. The primary bathroom features an expansive, tile shower with sitting bench, new double vanities, and new mirrors. Chaparral Country Club offers 24 hour guard gated security, golf, tennis courts, pickleball co
Large and spacious home located on an inside quiet street. This home features vaulted ceilings throughout the entire home. Has a wonder california room for entertainting your family and friends. Located in Palm Desert Greens, a 55+ community with low HOA dues that include golf, cable TV, WI-FI, and Trash pickup. Clubs for every interest. Tennis courts, Pickleball courts, Bocce Ball, and Indoor Shuffleboard. Come see this home to appreciate.
From the lushly landscaped entry and courtyard through the impeccably appointed and maintained interior, this house is a standout. Lovely living/dining room faces the rear pool/spa, barbecue area, firepit and shade structure. This home is perfect for entertaining inside and out. The renovated kitchen adjacent to family room with cozy tiled fireplace is ideal for our cool desert nights. The principle suite is separated side from the two guest rooms with Jack & Jill bath on the opposite side of the home providing maximum privacy. The double door entry with custom glass leads to the foyer and access to a flexible room currently used as office/den which could serve as a fourth bedroom su
Discover unparalleled luxury living at The Retreat at Desert Falls! This exquisite 3-bedroom, 3-bathroom home spans 2664 sq ft and offers a host of upscale features. A private elevator ensures effortless access, while inside, you'll find a spacious junior suite with a lavish walk-in closet and full private bath, perfect for guests. The chef's kitchen is a culinary masterpiece, boasting beautiful quartz counters, a quartz island with sink, Bosch appliances, and a commanding view of the dining room and great room. With two walls disappearing as you open sliding glass doors, the seamless transition between indoor and outdoor living is simply breathtaking. Step onto the patio from the primary s
Architect Hugh Kaptur's magic touch at South Palm Desert! A RARE elevated setting + mountain VIEWS begin to tell story of this exceptional FURNISHED single level, single story home. Kings Point Villas is the perfect backdrop with its resort-style pools, quiet cul-de-sacs, and proximity to El Paseo. Truly the feel of a single family home where the beautifully landscaped front walkway begins to tell the story. Vaulted ceilings, focal-point fireplace, and clerestory window play beautifully in the living room which opens to a courtyard outfitted with a shade sail. Take the Matterport Virtual Tour for a better sense of the flow. Next up, the stylish kitchen and dining area which enjoy plenty of
A beautiful condo in a great location across from the pool, next to the mailboxes and only a brief walk to the Clubhouse. A freshly painted, remodeled unit with many changes: new kitchen with all new appliances, counters, custom cabinets, lighting. All of the flooring has been replaced up and down stairs. Double pane window and plantation shutters have been put in which reduces any noise. Extra lighting has been added throughout. The atrium has been converted to an office in the family room area. The downstairs master bath has been redone into a lovely shower area. On the exterior, a solid roof for protection of the elements has been added the patio cover. A wonderful place to enjoy cof
Absolutely nothing says "Home" like this beautifully crafted custom built home, every amenity lovingly hand selected and in amazing turn key condition. Appealing to anyone who drives up or knows of this preferred neighborhood . . . just south of Fred Waring Drive. Just inside the Formal Entry is a Private Office and a stunning Formal Dining Room - both with wood flooring. The entry then continues into the Living Room with a fireplace and built in entertainment center - a focal point of every family gathering. A Culinary Dream Kitchen with all the amenities . . . Stainless Steal appliances for the culinary artist, Butler pantry and serving station, Breakfast Bar (chairs included).
$600,000 first trust deed seller financing available at 7% per annum monthly interest only for 3 years & club membership available to buyer with no wait plus Enjoy west panoramic golf course & mountain views from this furnished Acacia 4 model, elevated above Grove #1. Great views from the living room & kitchen both adjacent to the golf course patio. Light & bright with neutral tile and shutters throughout. The spacious and open floor plan includes a great room with fireplace and wet bar, and a separate spacious dining area that looks out to the lush private front courtyard. Kitchen features a breakfast nook that is adjacent to golf course patio. Master suite ope
This adorable home is Located in Sun City Palm Desert, the best 55+ community in the valley. The Villa model has plantation shutters throughout, 1 bedroom, and 1 bathroom. HVAC NEW IN 2017. The large master bedroom has a bay window and a sliding door out to the back patio. The kitchen has plenty of cabinets for storage, room for a kitchenette table and is open to the dining room and living room. The living room has a French door out to the greenbelt, with a nice view out to the south facing greenbelt. The laundry room is inside with cabinets, wire shelving and the hot water tank. Lots of closet and storage areas. The 1 car garage also has room for a golf cart and storage. The sweet north fa
LOCATION, LOCATION. In the much sought-after guard-gated community of Rancho Las Palmas Country Club, this 20 Plan, fully furnished 2-bdrm, 2-bath unit has magnificent views of golf course and mountains. The open floor plan with high ceiling has an abundance of natural lights from every corner of the unit. The bedrooms have great separation for privacy. The open patio seating area with a view of the fairway is ideal for outdoor cooking and entertaining friends and family. The Community pool is within a short walking distance for easy access. The community features three nine-hole layouts, the South, North, and West courses containing six lakes. Homeowners and guests have access to 26 commun
Stunning 2 bedroom + Den with a POOL! The large entry leads to an open concept great room which connects the kitchen, dining room and the living room. Spending time in a kitchen this well designed is a pleasure. With plenty of counter space and an island, cooking, baking and entertaining has never been more fun. A convenient breakfast area is also included in the kitchen for more casual dining. Windows open up to allow beautiful light to fill the entire space. The dining room is large enough for holiday dinners or intimate casual dining. The living room is the perfect combination of comfort and size to relax and unwind. A fireplace creates added ambiance. Open the sliders and this home rea
Incredible opportunity for both permanent or second residency and lucrative vacation rentals in this fun, remodeled Mid Century Modern gem, a block away from the vibrant El Paseo Shopping District. Just outside the iconic Tiffany blue double front doors of this home, fabulous restaurants and premier shopping in the infamous Coachella Valley await. This 3-bedroom, 2-bathroom home has pops of color throughout, stainless steel appliances, sleek glass cabinetry, and Sile-Stone countertops in the kitchen. Entertain effortlessly in the Great Room with 24-inch tile floors and sliding glass doors that open to a private patio oasis complete with a sparkling pool, spa, and barbecue area with three fa
55+ Sun City Palm Desert. Del Webb's Crown Jewel and the ''Best Bang for your Buck'' in the whole Coachella Valley. Fantastic location in the heart of the community between the Mountain View and the Sunset View Clubhouses. Stunning golf course and panoramic mountain views situated high above the fairway. Nice curb appeal, private gated courtyard entry with sitting area to enjoy your morning coffee. This popular Orrefors model features 2 bedrooms/2 baths, plantation shutters, new door hardware, newer HVAC in 2021. Inside, Luxury vinyl throughout except tile in family room and entry, transom windows for extra light and brightness. Kitchen has Corian counters, newer stainless appliances, gas r
Light, Bright, Cozy & Move In Ready! The seller spared no expense on the recent remodel of this unit. Extensive changes, including a reconfigured kitchen with lots of cabinets for storage, stunning kitchen/bathroom slab countertops, fully tiled shower, stainless steel appliances, neutral wood-look tile flooring and so much more. Palm Desert Resort Country Club offers many amenities such as 20 salt water pools & spas, Tennis, Pickleball, Bocce ball plus a Restaurant/Bar at the Clubhouse. Short term rentals allowed. Don't miss your opportunity to call this place home!
PRICED TO SELL! Welcome to your dream oasis in The Courtyards of Desert Falls CC! This sought-after, updated, RARE single-story property boasts two bedrooms and two full baths, strategically positioned on opposite ends of the home for maximum privacy. Enjoy a newly installed HVAC system during those warmer months. As you step inside, you'll be greeted by vaulted ceilings and an abundance of windows that fill the condo with natural light, as well as beautiful, easy-to-maintain, and water-proof luxury vinyl flooring. With only one shared wall, tranquility is guaranteed in this lovely home. Nestled in a sweet cul-de-sac location, the home features a beautifully tiled courtyard entry, offering
Welcome home to these 55 PLUS communities featuring active adult opportunities at Tennis Golf pickle ball resident bar and inside fun and games of billiards shuffleboard and reading room to enjoy. This 2-bedroom triple wide home features master suite and walk in closet, second bedroom, fully tiled mobile home and some upgrades to counters and appliances, inside laundry room and entertainment sitting bar in the living room are added features. situated in close proximity to the pool and additional guest parking and on the fair way with golf course views and majestic views of the mountains this is a community to truly enjoy the inside of your home and to enjoy the outside amenities on the prop
Come see this two-bedroom, one-bathroom condominium in the heart of South Palm Desert. This great property is located in Indian Creek Villas just off of Hwy 74 and surrounded by the Coachella Valley's finest dining and entertainment options near El Paseo. The kitchen and bathroom have been tastefully upgraded. With a low HOA and community pools and spas, this could be your next home or rental.
Delight in your eco-friendly, Scandinavian luxury retreat, nestled in the serene foothills of South Palm Desert only minutes above El Paseo shops & eateries. This meticulously renovated Green Home seamlessly blends modern comfort with natural charm, all while prioritizing sustainability & the property's historic character. Inside you're greeted by the warmth of polished concrete floors, a hallmark of contemporary design & energy efficiency. The interior exudes a relaxed bohemian vibe, carefully curated decor & vibrant accents. This 3-bedroom 2-bath home has been thoughtfully updated with every detail chosen with sustainability in mind & is powered by a rooftop
This charming rare Dallas plan is tucked away on one of the most prestigious streets within The Lakes Country Club! Offering 2 elegant master suites with immense volume in this home boasting almost 2400 SF! Lovely open great room has updated appliances and slab countertops in the Kitchen. Custom paint colors are so soothing especially against the crisp white accents, baseboards and doors. Vast patio has incredible double fairway views with sweeping active lake setting. .. .an amazing place to enjoy morning coffee or afternoon wine. Enormous courtyard entrance offers a sunny southern exposure with enough space to use your imagination to create another living area. A golf cart garage adds a
Welcome to the enchanting Acacia 2 condo nestled inside the prestigious Indian Ridge community. This popular and sought after floor plan includes 2 bedrooms, 2 bathrooms and has an open concept living space. This south-facing residence boasts breathtaking panoramic views of the mountains and the 7th hole of The Grove course. Offering the lowest price point within one of the Coachella Valley's premier country clubs, this home is move-in ready and promises a lifestyle of luxury. Step inside to discover upgraded features including new flooring in the bedrooms, stainless steel kitchen appliances, epoxy flooring in the garage, and plantation shutters throughout the home. The fenced-in rear patio
NEWLY LISTED! Property offers open concept and great touches! New windows, new flooring, new interior and exterior paint. The outdoors offers privacy to entertain family and friends. Whether you are a golfer or simply appreciate the tranquility of living near a golf course, this home provides the perfect retreat close to all area shopping and conveniences. Don't miss the opportunity to make this renovated home in Palm Desert Country your own.
Location, Location, Location!!! Offering a Million Dollar View! It says it all! From the private back patio enjoy a sweeping elevated view of the large water feature on the golf course and of the San Jacinto mountains while watching golfers on the 3rd hole. This Islands 1 model detached home has an open floor plan, a 3-sided fireplace, high ceilings, double doors to the master bedroom, a smart Lenox Thermostats system, newer HVAC, separate laundry room, walk-in closets in both bedrooms, brand new flooring and a 2-car attached garage with golf cart space. Furnishing is negotiable. The Oasis Country Club is a very friendly community of 662 condominium homes immaculately maintained in Palm De
School data is provided by GreatSchools, a nonprofit organization. Redfin recommends buyers and renters use GreatSchools information and ratings as a first step, and conduct their own investigation to determine their desired schools or school districts, including by contacting and visiting the schools themselves.Redfin does not endorse or guarantee this information. School service boundaries are intended to be used as a reference only; they may change and are not guaranteed to be accurate. To verify school enrollment eligibility, contact the school district directly.
Homes for sale in Palm Desert have a median listing price of $649K. Some of these homes are Hot Homes, meaning they're likely to sell quickly.
What are some of the most popular neighborhoods in Palm Desert?
Popular neighborhoods include Indian Ridge Country Club, Palm Valley Country Club, South Palm Desert, The Lakes, Desert Horizons, Indian Ridge Country Club, Palm Desert Greens Country Club, Laguna De La Paz, Ironwood Country Club, and Rancho Las Palmas Country Club.
Palm Desert, California boasts a well-structured transportation system, with a variety of options for residents. The city is served by SunLine Transit Agency, which provides public transportation options including buses. For those who prefer to drive, traffic levels can be moderate to high, especially during peak hours. Additionally, Palm Desert is conveniently located near major highways such as Interstate 10, making it an accessible city for car travel. Learn more on our Palm Desert city guide.
What types of properties are available in Palm Desert?
Palm Desert, California offers a variety of single-family home types, including ranch-style homes, Mediterranean-style homes, and modern-style homes. These homes can be found throughout Palm Desert, with many located in gated communities, golf course communities, and residential neighborhoods. Most properties feature three to five bedrooms and were built in various years. To explore different property types for sale in Palm Desert, California, use the 'Home type' filter located above the active listings. Customize your search by selecting options like single-family homes, condos, townhomes, and more.
What is life like in Palm Desert?
Living in Palm Desert, California offers a unique experience with its stunning landscape featuring breathtaking mountain views and vast expanses of desert. The weather is characterized by long, hot summers and mild winters, allowing for outdoor activities year-round. The region boasts a thriving job market with a variety of employment opportunities across industries such as hospitality, healthcare, and retail. Residents can engage in a wide range of recreational activities, including hiking, golfing, and exploring the numerous parks and nature reserves. Additionally, the city hosts a vibrant arts and culture scene, with art galleries, theaters, and live music venues to enjoy.
What are the schools and amenities like in Palm Desert?
Palm Desert, California, is home to a variety of public amenities that cater to the lifestyle needs of its residents. The city boasts an assortment of restaurants offering diverse culinary experiences. Numerous parks provide spaces for relaxation and recreation, while a selection of grocery stores ensures convenient access to daily necessities. Additional amenities in Palm Desert include fitness centers, libraries, and a thriving arts scene with galleries and theaters. The city also offers medical facilities, educational institutions, and a robust public transportation system.
In the past month, 160 homes have been sold in Palm Desert. In addition to houses in Palm Desert, there were also 369 condos, 3 townhouses, and 2 multi-family units for sale in Palm Desert last month. Palm Desert is a minimally walkable city in Riverside County with a Walk Score of 28. Palm Desert is home to approximately 47,797 people and 27,900 jobs. Find your dream home in Palm Desert using the tools above. Use filters to narrow your search by price, square feet, beds, and baths to find homes that fit your criteria. Our top-rated real estate agents in Palm Desert are local experts and are ready to answer your questions about properties, neighborhoods, schools, and the newest listings for sale in Palm Desert. Our Palm Desert real estate stats and trends will give you more information about home buying and selling trends in Palm Desert. If you're looking to sell your home in the Palm Desert area, our listing agents can help you get the best price. Redfin is redefining real estate and the home buying process in Palm Desert with industry-leading technology, full-service agents, and lower fees that provide a better value for Redfin buyers and sellers.
 REDFIN IS COMMITTED TO AND ABIDES BY THE FAIR HOUSING ACT AND EQUAL OPPORTUNITY ACT. READ REDFIN'S FAIR HOUSING POLICY AND THE NEW YORK STATE FAIR HOUSING NOTICE.
 United States
 Canada