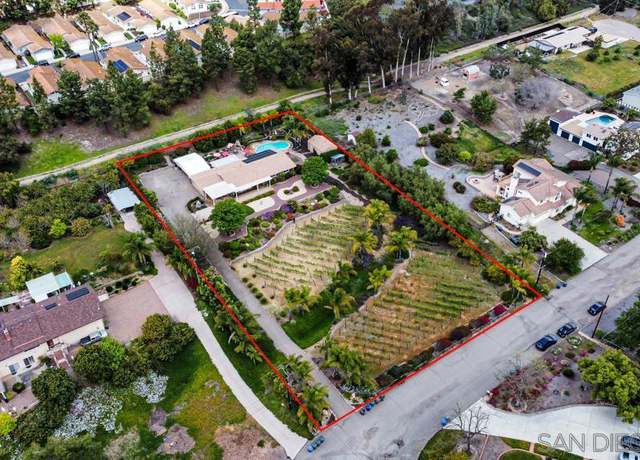
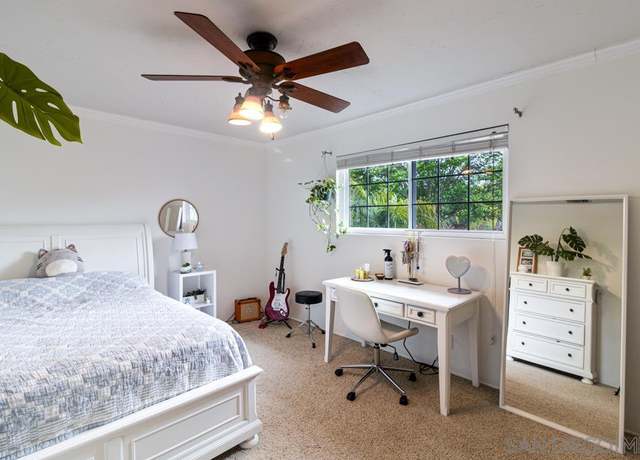
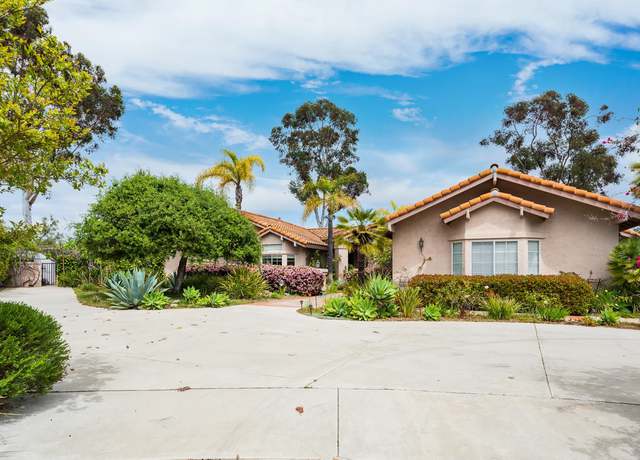
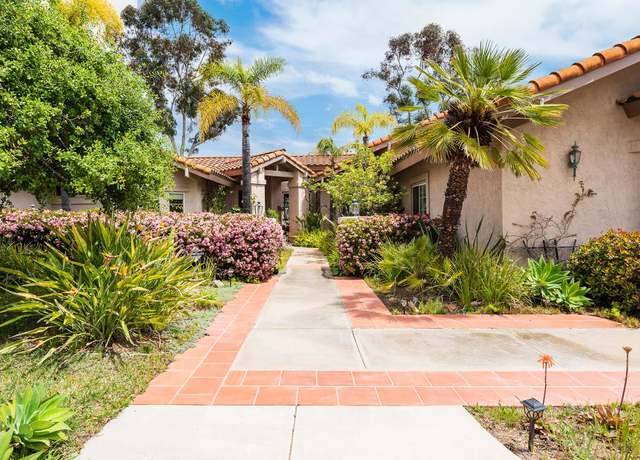
Escape to your Private Oasis—a Secluded 1.39AC Estate nestled amidst it's own vineyard that produces 2- 250 bottles a year. Expansive grounds offer unparalleled Privacy and Luxury. This magnificent home boast impeccable design, and the serene ambiance of peaceful living. With its expansive grounds this property offers ultimate privacy and tranquility. Take a dip or soak in your custom pool/spa and let your worries melt away. The meticulously crafted home features an Updated Kitchen and Bathrooms. Exquisite architectural details include a mid-century inspired pass through fireplace, spacious living areas, and state-of-the-art amenities such as whole house solar w/ home battery and car
MUST SEE!! FEELS LIKE NEW! Upgrades Galore include new modern flooring throughout, fresh paint, beautiful kitchen with stainless steel appliances, 2 full baths have been upgraded AND BRAND NEW multi-zone mini split heating and air system! Located in the desirable Royal Poway Estates! Space rent is $1,393.00/mo, plus electric, gas, water, and sewer are billed based on usage.
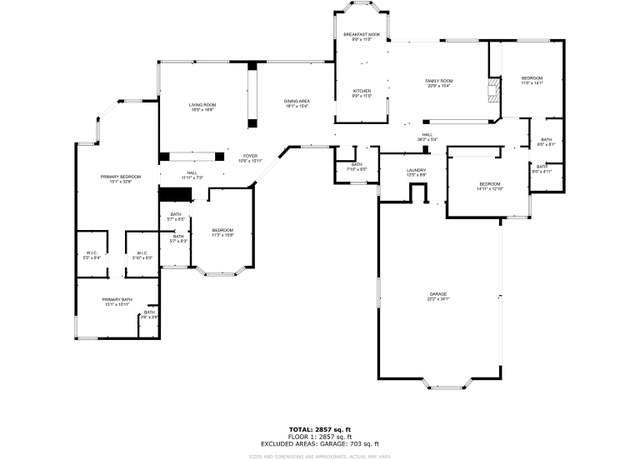
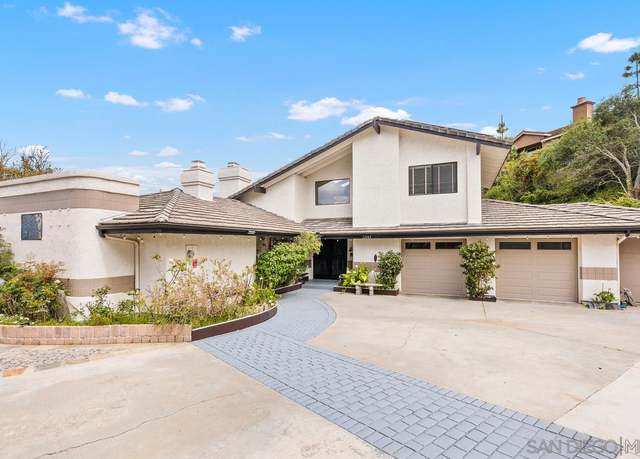
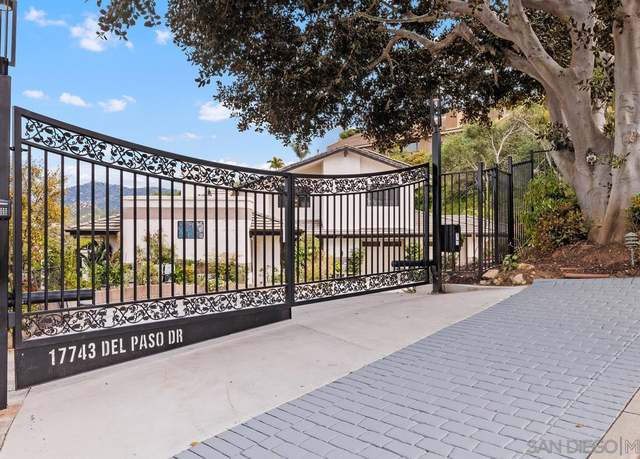
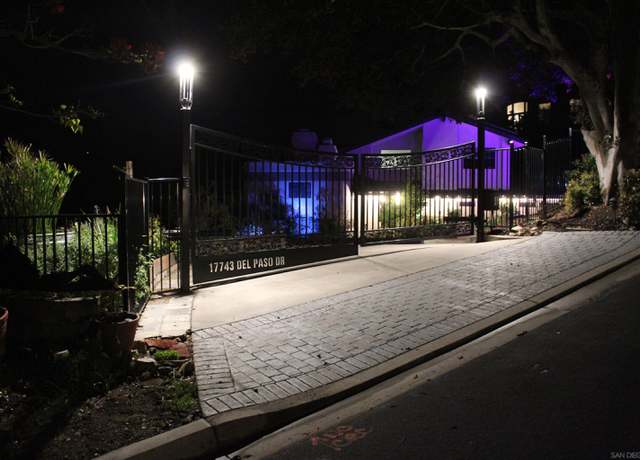
Elegant single-level layout house with panoramic views! The property is on a private cul-de-sac in the sought after community Squire Estates. Spacious master retreat, charming breakfast nook with amazing views is perfect for sipping your morning coffee to start the day. Wood flooring, granite countertops, backyard with BBQ, fire-pit and covered patio for entertaining while enjoying the surrounding hillsides. Welcome home!
Views! Views! Views! Situated in a quiet location overlooking Maderas Golf Course & The Heritage of custom homes, this resident offers some of the best views in North Poway. The primary bedroom is located on the main floor along with a den/office and lots of windows capturing the outdoors. Upstairs offers 2 spacious bedrooms. Gourmet kitchen with granite counter tops and brand new ovens, dishwasher & cooktop. Custom gated driveway with 2 car garage with golf cart area and owned SOLAR. New luxury vinyl plank flooring, central vacuum system and newer paint inside and outside. The backyard view deck is a great place to relax or entertain or if you have a green thumb, this property
Welcome to a masterfully designed, Mediterranean-inspired custom estate situated in Poway's most coveted neighborhood, The Heritage. Perfectly placed on a private cul de sac, this home overlooks the 14th hole of the award-winning Maderas Golf Course including breathtaking views and pastel sunsets from nearly every room. This luxury estate offers five spacious bedrooms, six and one-half bathrooms on 2.69 acres. First-level primary ensuite welcomes you with soaring ceilings, fireplace, expansive closets, dual sinks, dual water closets, spa tub, and designer stone-tiled shower. Additional ensuite bedrooms boast sizeable closets and bathrooms with natural stone exhibiting Tuscan elegance. Livin
Gorgeous single level home with 2 bedroom, 2 full bathrooms, optional room/office, 2 private patios, one at the entrance and one large patio off of the living room overlooking a picturesque green belt. Property also features indoor laundry, central air/heat, gas fireplace, assigned parking, storage, skylights, vaulted ceilings in the living and dining room and newer water heater, HVAC and electrical panel. This is a very special end unit in an excellent Rancho Bernardo location, situated in a quiet and tranquil setting, in the desirable 55+ community of Seven Oaks. Beautifully maintained unit with views from the living room and large patio looking out to trees and lush landscaping. Home is
Welcome to this inviting single-story residence nestled in the tranquil Heritage Hills neighborhood of Poway. Boasting a spacious floor plan, this 3-bedroom, 2-bathroom home offers comfort and versatility. A bonus optional room awaits, perfect for an office, guest bedroom, or playroom, catering to your lifestyle needs. Enjoy the convenience of no HOA or Mello Roos fees on this corner lot, providing privacy and space for outdoor activities on the private patio and expansive side yard. Immerse yourself in the heart of Poway's charm with easy access to new restaurants, shops, entertainment, and hiking trails, all within walking distance. This home features upgrades such as a rebuilt structure
Beautiful single story home on a quiet Cul-De-Sac in Highly sought-after legacy Canon Neighborhood. .Owned Solar panels. High ceiling and Huge private backyard with South/West View of mountains & hills. Wood floors throughout and open floor plan. Lots of built-in custom cabinets in the garage & in computer/office area in primary bedroom that is overlooking the Backyard. Vinyl fence. . Custom shelves in Walk in Master's BR closet. Legacy Canyon known for it's high ranked schools. H. O. A include Tennis court .
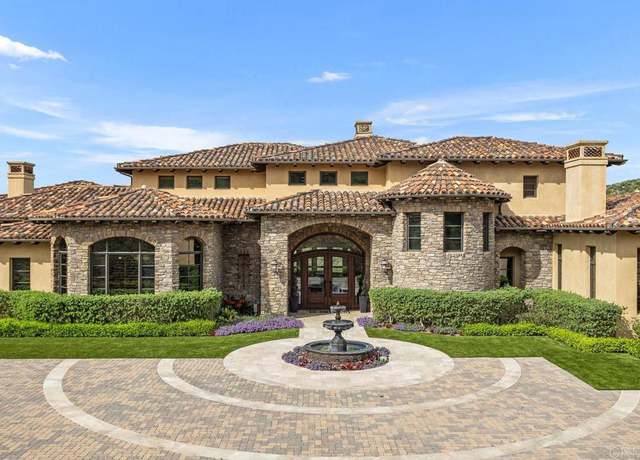
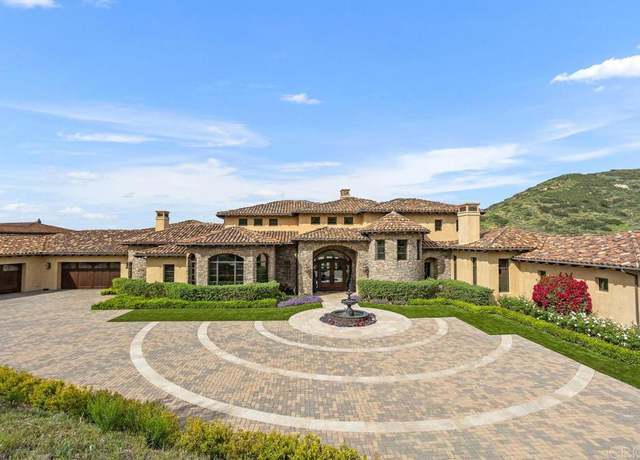
Perched at the apex of The Heritage Estates, this sprawling single-level residence stretches out across 10,527 square feet offering unparalleled views across the San Pasqual Valley and evening sunsets. Set on a 10.15-acre site and constructed by master builder Mark Agee, this home stands as a testament to quality and refinement at the top of one of San Diego’s most exclusive developments and best kept secrets. Known for its proximity to the world-class Maderas Golf Course, The Heritage Estates is a guard-gated community of custom-built homes and often attracts professional athletes, and other high-net worth individuals seeking exclusivity and privacy. Just a short drive to Del Mar bea
Terrific home in the quiet Garden Road area of Poway! The elevated lot provides nice mountain views. This super flexible plan has the Master bedroom downstairs along with 2 additional bedrooms and an additional bathroom. Upstairs there are two bedrooms, one with direct access to the bathroom, and the other with hallway access. Many interior upgrades and remodeling over the last few years including; a bright remolded kitchen, flooring, paint, roof, hot & cold water re-plumb, and heating & air conditioning. The front yard has custom pavers, artificial turf, and a drip system for the plants. The backyard is an entertainer's delight with more custom pavers, artificial turf, BBQ, a f
Welcome to your newly renovated single story home in the coveted Westgate neighborhood of Poway. Prepare to be captivated by the modern elegance, featuring fresh interior and exterior paint alongside updated luxury waterproof laminate flooring and fully owned solar panels, setting the stage for contemporary living. Featuring four spacious bedrooms and two beautifully updated bathrooms, this residence offers comfort and style at every turn. The expansive family room is bathed in natural light from skylights above and vaulted ceilings. Moments away from top-ranked Poway Unified Schools, shopping, restaurants, hiking trails and more! Escape to the sanctuary of the oversized primary bedroom, of
Nestled in a private gated community in Poway, this single-level, custom estate is situated on 13 acres of beautiful land complete with a sparkling pool/spa & incredible views throughout! Built in 2002 by San Diego's premier home builder McCullough Design Development, this home is the only home in The Grove gated community with NO HOA! This home features a spacious 4 car garage, owned solar, space to entertain & relax + a great open floor plan. At 5,500 square feet with 5 bedrooms & 5.5 bathrooms, the interior of this home has been freshly painted & re-carpeted. Opportunity knocks! Do not miss this one-of-a-kind home in an incredible location close to the area's best
Priced from $1,949,000 - $1,999,000. We are thrilled to showcase this beautifully renovated home, boasting elegance and premium finishes at every turn. Step inside to find a spacious 4 bedroom, 3 full bath abode that seamlessly blends functionality with high-end design. Indulge in the comfort of luxury vinyl plank flooring throughout the first floor, setting the stage for a stylish yet durable living space. The heart of this home is undoubtedly the kitchen, equipped with slow close white shaker cabinets and marbled quartz countertops that exude sophistication. Complemented by a soothing forest green backsplash, it’s a culinary dream come to life. Parking is plentiful here, thanks to a
Perched on a quiet street in the Heritage Hills neighborhood of Poway, surrounded by neighbors who share pride of ownership, this fully fenced home features: OWNED SOLAR with 18 panels installed in 2024, new refrigerator, microwave, new vinyl fence, gorgeous fresh landscaping and views of the Poway rolling hills atop the fence line. This single story home features 4 bedrooms, 2 baths, a low maintenance succulent front yard, open concept kitchen, ample parking in the driveway for 3 cars and a smart layout with 3 beds and 1 bath on one side of the home and the primary suite on the other. Bonus: The bedrooms do not share walls with other bedrooms. It truly is the perfect layout. Located in th
Welcome to your dream horse ranch retreat! This stunning property boasts a fully paid off solar system, ensuring energy efficiency, along with a brand-new tankless water heater for added convenience. The property features 10 Horse Corrals, including covered and partially covered options, as well as 2 full-size Horse Washing Stations. The expansive 5-rail Horse Arena is perfect for riding and training, while outbuildings like, Tack Sheds, Tool Shed, and Hay Barn provide ample storage space. Welcome to your dream horse ranch retreat! This stunning property boasts a fully paid off solar system, ensuring energy efficiency, along with a brand-new tankless water heater for added convenience. Situ
Welcome to 12821 Avenida La Valencia! This stunning single-story home has been fully renovated inside and out and is one not to be missed! Featuring four spacious bedrooms, three bathrooms. and an endless amount of upgrades throughout the 2,950 square feet of its open concept living. As you step inside the front door, you are greeted by a massive kitchen with ample counter space, generous storage, upgraded appliances, a view of your sparkling pool, and vaulted ceilings with gorgeous, exposed wood beams. Offering a true entertainer dream home with a separate family room, formal living room, neutral colors, and trendy fixtures. The side-by-side laundry closet is equipped with a brand-new wa
Welcome to your dream gated ranch-style oasis! This stunning home boasts a spacious layout perfect for entertaining. With 1200 sqft of detached garage space, there's ample room for all your toys (Rv, Boat. .. etc) Enjoy peace of mind with a new roof and rain gutters. Step inside to discover the elegance of real wood floors, adding warmth and charm throughout. Experience the upgrades of the interior such as the remodeled kitchen equipped with top of the line appliances (Wolf) and new bathrooms! Delve into relaxation in the recently resurfaced fiberglass pool; and enjoy the relaxing sounds of the waterfall. This property is more than a home; it's a lifestyle upgrade waiting for you. Don't mis
Welcome to this elegant single-level residence located in the heart of Poway, offering a blend of luxury, comfort, and recreational amenities. Situated on a spacious lot, this property features owner owned home/pool solar, custom outdoor living space that combines a built-in BBQ, outdoor dining, split level entertainment space, pool w/ slide, putting green, and combo pickleball/basketball court. This home not only provides a luxurious lifestyle but also affords the convenience of being close to Maderas Golf Course, the Blue Sky hiking trail system, Poway Lake, top-rated schools, shopping, dining, and easy access to freeways. Experience the perfect blend of leisure and convenience – tr
Welcome to 13631 Willow Run Rd, where privacy and serenity meet luxury living in the highly sought-after community of Green Valley. Tucked away from the hustle and bustle, this exceptional residence offers an oasis of tranquility on a sprawling . 73-acre lot on a quiet cul-de-sac street. As you enter through the private driveway, you'll immediately be struck by the landscaped grounds boasting an array of fruit trees, including lemon, orange, grapefruit, clementines, peaches, and passion fruit. The thoughtfully designed hardscape elements create a serene ambiance, with a spacious patio area perfect for al fresco dining, a sparkling pool out front for refreshing dips on warm summer days, and
Nestled within the serene landscapes of the Seven Oaks 55+ Community in Rancho Bernardo, this exquisite property at 16331 Gabarda Rd offers a harmonious blend of easy living and natural beauty. This home presents an unparalleled opportunity for those seeking a quintessential Californian lifestyle. Step inside to discover a spacious and thoughtfully designed floor plan that seamlessly merges sophistication with functionality. The interior boasts an abundance of natural light that floods through expansive windows. The kitchen is nicely appointed and ideal for culinary endeavors and entertaining guests. The property offers multiple living areas, including a living room off the kitchen, a large
Back on market, no fault of property. Well kept home in highly sought after 55+ park. Home is well laid out making it feel larger than the square footage. 2 bedrooms with lots of storage. Expansive living room with separate dining area. Upgrades throughout the years include dual pane windows, vinyl siding, roof overlay, central heat and air conditioning, sky light, ceiling fan, water heater (replaced 6 months ago). Ramp leading to nice sitting area at front of home. Double entry doors. Refrigerator, microwave and washer/dryer included. Easy care yard with gardening areas. Not on property tax rolls, registered annually through HCD which is a huge savings! Great neighborhood! Community center
Fabulous Valle Verde Estates updated home on 0.96 acres with views of Mt. Woodson and surrounding mountains and hills! Beautiful backyard provides privacy and serenity and is perfect for entertainment and a relaxed home lifestyle. Outdoor patios and Trex-built decks provide expansive seating areas around built-in BBQ and nearby firepit. Elegant PebbleTec pool adds to the enjoyment (resurfaced in 2017, new pool heater in 2022). Kitchen has been remodeled with Shaker-style hickory wood custom cabinets, granite stone countertops, stainless steel appliances, gas cooktop, wine fridge, and a beautiful island with ample counter space that accommodates bar seating. Family room, dining area and nea
Stunning home in Poway’s coveted Stoneridge community! Walking through the entry, your eyes are drawn to the 11 ft ceilings, beautiful tile floors, contrasting dark accents and sight lines through the house to the amazing view. Owned Solar. The living room is anchored by a floor to ceiling stone fireplace, has a beamed ceiling and a nearby wall of windows. Moving into the kitchen you appreciate the stainless steel appliances, double dishwasher, generous dark cabinets with contrasting silestone countertops and peninsula seating. Sliding glass doors on each side of the kitchen facilitate easy indoor/outdoor living. The dining area also boasts a beamed ceiling and has a built in wine bar
Beautifully updated single story home in the peaceful 55+ neighborhood of Oaks North Estates is on the golf course. Updates include floors, windows, doors, kitchen, bathrooms, roof and owned solar. Walking through the entry, you experience open sight lines through the home to the 5th fairway of the Oaks North East Golf Course. The well laid out floorplan begins with the stunning living rooms vaulted ceiling, skylight, gas fireplace and french doors to the patio. The dining rooms vaulted ceiling and expansive window create an inviting place to gather. The kitchens white cabinets, complimentary counter tops and garden window combine to make a beautiful and functional workspace. The den is a w
Diamond in the rough! This property presents an exceptional opportunity for those willing to roll up their sleeves. Situated in the coveted 55 yr. + age restricted community of Oaks North in Rancho Bernardo, this upper unit boasts a prime location in a tranquil cul-de-sac with breathtaking views. Ascend to the second floor (please note: stair access only, no elevator) to discover soaring vaulted ceilings in the living room, a cozy fireplace, and panoramic vistas from the balcony patio and every bedroom. A detached one-car garage, conveniently located nearby, offers additional storage space. The option for a third bedroom or office (lacking a closet) further enhances the versatility of this
Rare North Poway near the Heritage, New Single Level Construction. Set on newly created private cul de sac, created by New Pointe Communities, completion June 2024. A stunning enclave of 6 homes feature mid century architectural detail, on half acre plus lots, providing ample room for ADU/Guest Homes and elaborate outdoor living spaces. Milgard windows and custom multi-panel sliding doors, The gourmet kitchens are equipped with Thermador 48 inch gas range, hood, wine chiller and built-in refrigerator with walk in pantries. Covered veranda sitting areas off the great rooms provide a grand entrance to the outdoor space. The primary suites provide a generous walk-in closet, soaking tub and ele
Welcome home to this move in ready upper end unit in 55+ Oaks North with gorgeous views! This home is light and bright with several desirable features including soaring high ceilings which opens up the space, dual paned windows and slider to the view patio, custom built mantel and book case wrapped around the brick fireplace providing an attractive focal point for the family room. The kitchen is nicely renovated including granite countertops, plenty of cabinet space, stainless steel appliances, on demand hot water, recessed lighting, and easy care flooring. There are two spacious bedrooms with arched ceilings and large windows and easy pull shades to let plenty of light in. The primary su
$675,000
2 beds2 baths1,431 sq ft
17423 Plaza Otonal, Rancho Bernardo (san Diego), CA 92128
This extraordinarily elegant home on 2.2 acres boasts the best breathtaking vistas in the highly sought after Old Coach Collection in Poway. Drive through private security gates into an exclusive community that is nestled in peaceful rolling hills. Enter into soaring ceilings and stunning expansive views that stretch as far as the eye can see the moment you step foot inside. The grandeur of the living space envelops you with a sense of elegance and warmth. These original owners built this home with love and attention to detail and have meticulously maintained every aspect from day one. Designer touches grace every corner of this abode, setting it apart from the rest. The kitchen showcases V
Step into contemporary elegance and comfort in this spacious single story home, where every detail exudes luxury and convenience. With a solar-powered energy system illuminating the path to sustainability, a state-of-the-art dual-zone HVAC system ensuring optimal climate control, and recently remodeled kitchen and bathrooms boasting top-of-the-line finishes, this residence sets a new standard for modern living. Nestled on a serene corner lot in a coveted neighborhood known for its tranquility and safety, residents will relish the peaceful ambiance and sense of community. Moreover, being situated within the prestigious Poway Unified School District, families can rest assured knowing their ch
Elegance meets casual in this sprawling 4-bedroom, single-story home located in the highly desirable gated community of The Grove. Indulge in the grandeur of this exquisite executive estate, nestled on 2.49 acres. This home features: 22-panel owned solar, dual-glazed vinyl clad windows and sliders, shutters, newer roof (4 y/o lift and relay)/HVAC system, saltwater pool, an abundance of storage, luxurious travertine tiles with distressed wood inlays/cross hatching, custom-crafted distressed beam work, and rich maple hardwood floors. Enjoy the details of this unparalleled floorplan that shows light and bright. With soaring 12-foot ceilings and elevated Westerly views of the mountains and hill
Price reduction! Country living in the heart of Poway! This gorgeous tree-lined paradise sits central to Poway but feels miles away! Approach along the beautifully landscaped driveway with large lawn area and security gate. Enter this impressive custom home with graceful design accents and lovely spaces. First floor includes 3 large living areas, wonderful entertaining kitchen and amazing backyard sanctuary with "new" pool, walking path down to the creek and fun boulders. Upstairs includes two full bedroom suites with views of Mt Woodson and lush landscaping. Two other large bedrooms complete this wonderful home. One more room downstairs for you to define. .. Gym? Office? Playroom
Sabre Springs-bordering Poway best buy as it's fully remodeled see recent closing in neighborhood. Highly sought after and rarely available model home in Sabre Springs. Vaulted ceilings welcome you in with custom wood floors, open floor plan, custom kitchen cabinets and designer tile fireplaces in living room and family room. Spacious ensuite bathroom with beautiful tub great for relaxing and pampering yourself. The large private backyard is excellent for entertaining, completely private and views of the mountains including the Poway Christmas tree. Leased solar and 30 amp EV charging station in garage.
Welcome to your own private paradise nestled on 8.07 acres of pristine land, where luxury and natural beauty converge to create an unparalleled living experience. This stunning custom-built home boasts over 6000 square feet of lavish living space, meticulously crafted with the finest materials and attention to detail, and meticulously maintained since 2002. Upon entering through the gated entry and meandering along the scenic driveway to the charming courtyard, you'll immediately sense the exclusivity and grandeur of this estate. The homeowner, an engineer, spared no expense in ensuring that every aspect of this home reflects the epitome of luxury living. Step inside to discover a grand fo
Nestled on an expansive and exclusive 1.22-acre lot within the prestigious Old Winery Estates, this remarkable property offers a truly luxurious living experience. Boasting a spacious floor plan of approximately 6,114 square feet, this home features 5 bedrooms, 5.5 bathrooms, an office, and a host of exceptional amenities. As you step through the grand double doors, your attention is immediately drawn to the soaring ceilings, sparkling chandeliers and abundant natural light flooding through the expansive windows. The new gourmet kitchen is a chef's dream, while the luxurious master bedroom suite provides a serene retreat. Multiple French doors seamlessly connect the indoor and outdoor space
PRICE IMPROVEMENT. Charming Single Family Home. Nestled in tranquil Poway, this 1,089 sq ft home offers modern comfort and thoughtful design. With 3 beds and 2 baths, it's a cozy retreat. Natural light fills the open living area, highlighting the tasteful color scheme and stylish finishes. The kitchen, featuring sleek countertops and stainless steel appliances, is perfect for everyday creativity. Step into the enclosed patio "Sun Room" for outdoor enjoyment, complete with southern California charm, with window screens to enjoy fresh breeze. The main suite offers a peaceful retreat with an ensuite bathroom. Two additional bedrooms provide flexibility. Outside, a spacious patio with
Welcome to this charming home that boasts a cozy fireplace, adding warmth and character to the living space. The natural color palette throughout creates a serene and welcoming atmosphere. With additional rooms for flexible living space, this home offers endless possibilities for customization to suit your lifestyle. The primary bathroom features double sinks, perfect for added convenience, along with good under sink storage for all your essentials. Fresh interior paint brightens up the home, while partial flooring replacement in some areas gives a modern touch. Don't miss out on this fantastic opportunity to make this home your own!
Welcome to your breathtaking retreat! Experience unparalleled panoramic views from this extraordinary estate, majestically positioned high above the picturesque valleys below. Upon entering through your private gate, immerse yourself in tranquility across 16 acres complete with a charming guest house. The stunning custom home boasts sweeping vistas from every room, accompanied by expansive wraparound balconies and patios, inviting you to embrace an indoor-outdoor entertainment lifestyle. The main residence, a testament to bespoke craftsmanship with 3170 square feet, offers three bedrooms and three full baths, with the primary suite conveniently located on the main level. Additionally, indul
This is the one you've been waiting for! As you approach the property, you are welcomed by the white picket fence and sitting area, as well as a front porch just waiting for you to sit down and wave to your neighbors! As you enter, you will be blown away by the adorable nautical theme and relaxing color scheme throughout. The open floorplan, dual primary bedrooms, and additional side yard sitting area make this the perfect home for entertaining. Everything has been done, so you can move right in! You do not want to miss this one! Come check it out now! (see supplemental remarks) Matching furniture is negotiable, and might be able to be included in the sale.
This area's enrollment policy is not based solely on geography. Please check the school district website for more information.
Elementary schools
Middle schools
High schools
GreatSchools Summary Rating
9/10
Scripps Elementary School
Public, K-5
9/10
Painted Rock Elementary School
Public, K-5
8/10
Chaparral Elementary School
Public, K-5
8/10
Creekside Elementary School
Public, K-5
7/10
Tierra Bonita Elementary School
Public, K-5
Only showing 5 of
13 elementary schools.
School data is provided by GreatSchools, a nonprofit organization. Redfin recommends buyers and renters use GreatSchools information and ratings as a first step, and conduct their own investigation to determine their desired schools or school districts, including by contacting and visiting the schools themselves.Redfin does not endorse or guarantee this information. School service boundaries are intended to be used as a reference only; they may change and are not guaranteed to be accurate. To verify school enrollment eligibility, contact the school district directly.
Homes for sale in Poway have a median listing price of $1.37M. Some of these homes are Hot Homes, meaning they're likely to sell quickly.
What are some of the most popular neighborhoods in Poway?
Popular neighborhoods include Sabre Springs, Rancho Bernardo, San Pasqual, Oaks North, and Scripps Miramar Ranch.
How often does Redfin update their new listings?
Most of our new listings in Poway are updated every 5 minutes so you can see new homes as soon as they come on the market. Learn more
What is transportation like in Poway?
In Poway, California, residents enjoy a variety of transportation options. The city is well-served by roads, with traffic levels ranging from light to moderate, making driving a car a convenient choice for many. Public transportation is also available, with the Metropolitan Transit System providing bus services throughout the city. Additionally, Poway is conveniently located near several major highways and freeways, including the Interstate 15 and State Route 67, offering easy access to surrounding areas. Learn more on our Poway city guide.
What types of properties are available in Poway?
Poway, California offers a variety of single-family home types, including ranch-style homes, contemporary homes, and modern homes, among others. These homes can be found throughout Poway, California, with some located in established neighborhoods and others in newer developments. Most properties feature three to five bedrooms and were built within the past 20 years. To explore different property types for sale in Poway, California, use the 'Home type' filter located above the active listings. Customize your search by selecting options like single-family homes, condos, townhomes, and more.
What is life like in Poway?
Poway, California offers a serene living experience with its picturesque landscape featuring rolling hills, stunning views, and a tranquil atmosphere. The region boasts a pleasant Mediterranean climate characterized by mild winters and warm summers, perfect for outdoor activities year-round. The city provides a range of employment opportunities across various industries, ensuring a diverse job market for residents. With numerous recreational options available, residents can enjoy hiking and biking trails, engaging in water sports, or exploring the local parks and open spaces. Additionally, Poway offers a vibrant community with a variety of cultural events and activities for residents to partake in.
What are the schools and amenities like in Poway?
Poway, California offers a variety of public amenities for its residents to enjoy. This includes a number of well-stocked grocery stores for all your shopping needs. Dining options are plentiful with a wide range of restaurants to choose from. For those who enjoy the outdoors, Poway boasts numerous parks for leisure and recreation. Additionally, more amenities such as schools, libraries, and healthcare facilities are readily available within the city limits.
In the past month, 27 homes have been sold in Poway. In addition to houses in Poway, there were also 2 condos, 2 townhouses, and 0 multi-family units for sale in Poway last month. Poway is a minimally walkable city in San Diego County with a Walk Score of 30. Poway is home to approximately 47,986 people and 24,483 jobs. Find your dream home in Poway using the tools above. Use filters to narrow your search by price, square feet, beds, and baths to find homes that fit your criteria. Our top-rated real estate agents in Poway are local experts and are ready to answer your questions about properties, neighborhoods, schools, and the newest listings for sale in Poway. Our Poway real estate stats and trends will give you more information about home buying and selling trends in Poway. If you're looking to sell your home in the Poway area, our listing agents can help you get the best price. Redfin is redefining real estate and the home buying process in Poway with industry-leading technology, full-service agents, and lower fees that provide a better value for Redfin buyers and sellers.


 REDFIN IS COMMITTED TO AND ABIDES BY THE FAIR HOUSING ACT AND EQUAL OPPORTUNITY ACT. READ REDFIN'S FAIR HOUSING POLICY AND THE NEW YORK STATE FAIR HOUSING NOTICE.
 United States
 Canada