Warm, peaceful, and relaxing ranch-style 3-bedroom home with mountain views on a Spacious lot. Welcome to this beautiful home, which offers a harmonious blend of modern amenities and serene surroundings. Nestled on a generous lot, this property boasts ample outdoor space and breathtaking views that will make you feel like you're on a permanent vacation. As you step inside, a bright and open floor plan creates a seamless flow from room to room. The upgraded kitchen is a chef's dream, featuring sleek quartz countertops, custom cabinetry, and stainless steel appliances. The adjacent dining area provides a lovely spot for family meals and entertaining guests. The living room is spacious and inv
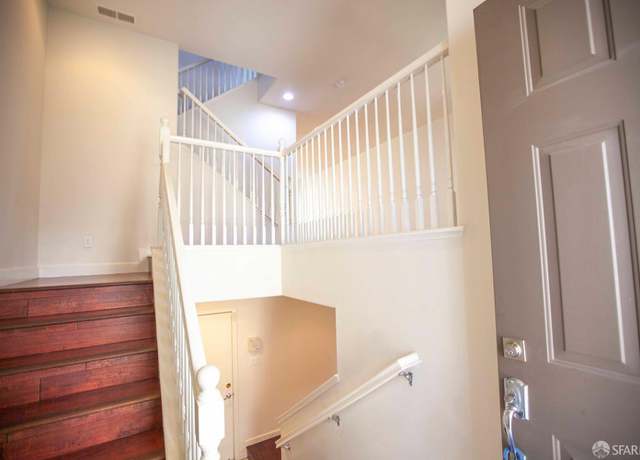
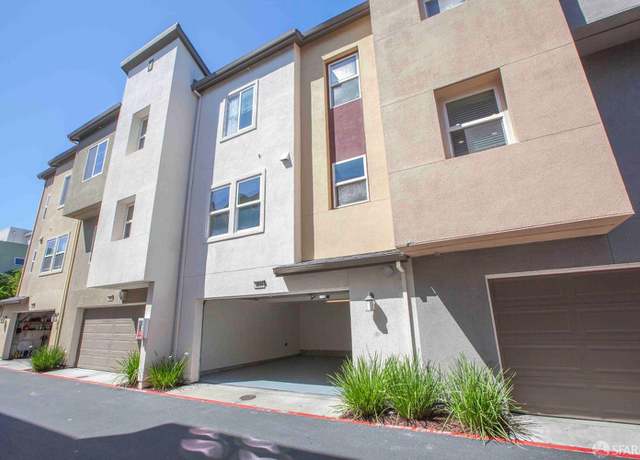
Beautiful tri-level, 3 bedrooms 2.5 baths and 2-car garage townhome. Ground floor includes a den which can turn into a home office, gym, additional living room, or even a guest room space. Main floor offers spacious great room with open kitchen and a half bath. Top floor has 3 bedrooms, a guest full bath, and laundry closet. Newly painted and double-pane windows throughout. Other highlights include high ceilings, central air/heat, laminate flooring, master bed with separate tub/shower, front door porch area. Move-in ready condition. Conveniently located near to schools, public transportation, shopping, and freeways. A must see!
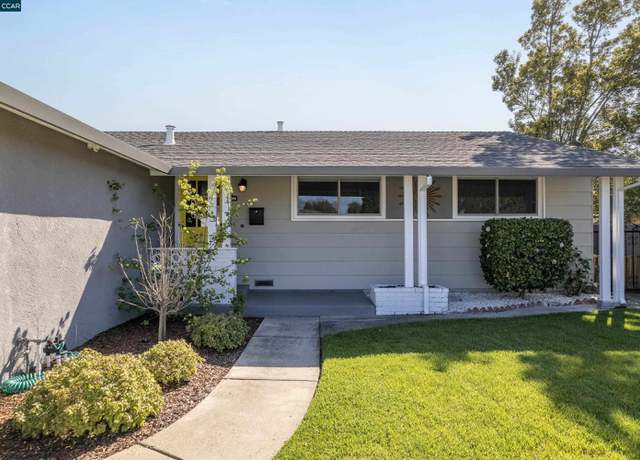
Ready , Set, Go !!! Meticulously maintained Tara Hills rancher boasting four spacious bedrooms and two full baths. The open floor plan has gleaming hardwood floors, updated kitchen and baths, dual paned windows, new central A/C and heat installed in 2021, fireplace, can lighting, refinished stucco, dimensional comp roof and RV parking. Open the French doors off of the living area and immediately enjoy indoor/outdoor living in the professionally landscaped yard featuring large patio area, custom stucco walls and automatic irrigation. Easy access to 1-80, Richmond Parkway. Conveniently located to shopping and Pinole Kaiser. Nothing to do here but unpack and enjoy! http://www. 2617kenneydr.com
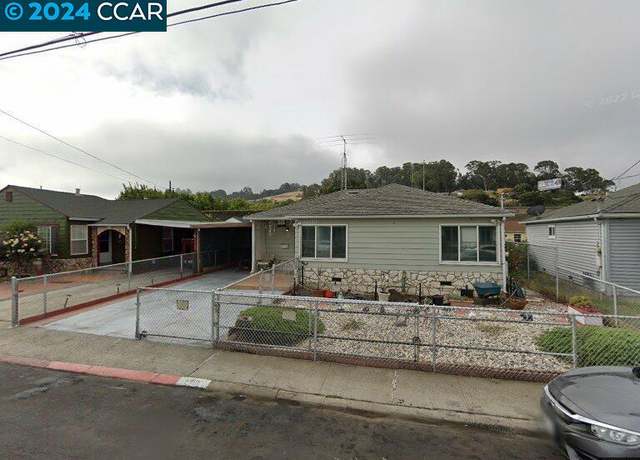
Welcome to 1341 Madeline Road!! Take advantage of this great opportunity to own two units in one. The main house features 3 bedrooms and 1 bathroom. One of the bedrooms has been expanded to provide extra space for perhaps an office or a dressing room. The main house has a fresh coat of interior paint and has an extra-large laundry room. The ADU features a modernly built 1 bedroom and 1 bath with a separate entrance and its own backyard. Live in one and rent the other to offset costs; the possibilities are endless!!! This home is conveniently located near major freeways and popular hiking trails.
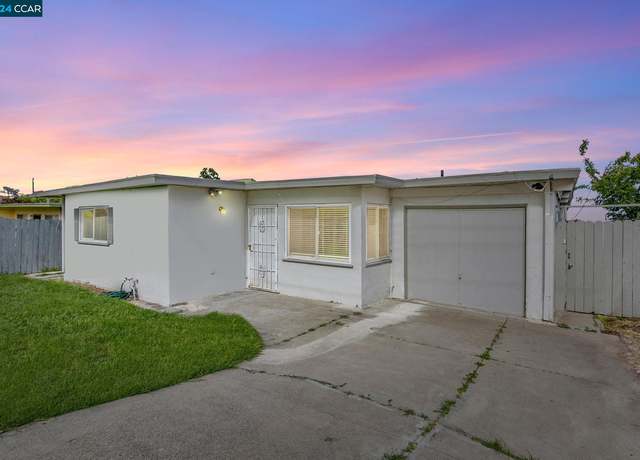
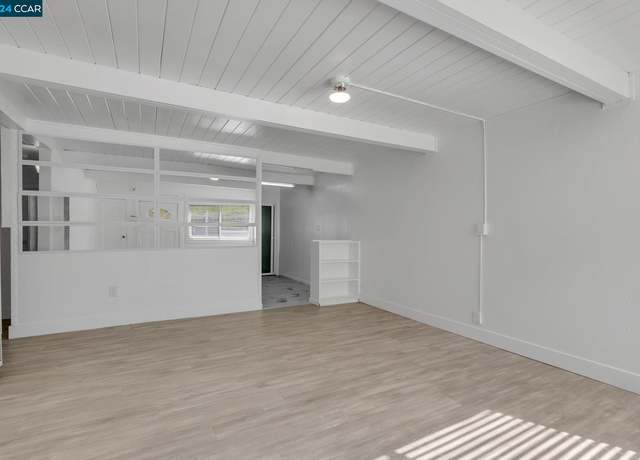
Discover an incredible opportunity to own a beautiful 3-bedroom, 1-bathroom home in the desirable Rollingwood neighborhood at a GREAT price! Features: 3 bedrooms perfect for families or guests Bright and airy living space Functional kitchen Cozy dining area for intimate meals Low-maintenance yards for easy upkeep Upgraded electrical panel Tesla Solar ADU potential Conveniently located in the sought-after Rollingwood neighborhood Below market rate pricing, offering incredible value! This is a rare opportunity to own a home in Rollingwood at an unbeatable price. Whether you're a first-time buyer, investor, or looking to downsize, this home has everything you need and more. Due to the hi
Introducing this exquisite condo nestled in the "Evergreen Terrace" Community! Recently remodeled and upgraded with over $35,000 in improvements, this top corner unit exudes sophistication and charm. Step inside to discover laminate flooring, tasteful artistic paint, and a sleek kitchen bathed in natural light, creating a contemporary and inviting living space. Featuring brand-new appliances including a range, range hood, and dishwasher, this unit comes fully equipped with a washer and dryer for added convenience. The impressive layout of this condo offers ample space for two families or individuals to coexist harmoniously, each enjoying their own private quarters. Whether accommo
Wonderful opportunity to own most affordable beautiful Townhouse style Two Story 2 Bed, 2 Bath Condo in a most vibrant City of San Pablo with close from Major East Bay Attractions. With 1198 Sq Ft of spacious living space 2 story condo offers tons of natural lights, ample space, Washer/Dryer with Patio to Relax or Barbecue. Upon entry on main floor, you will be greeted with open concept kitchen with Stone Counter, Dining space, Maple wood Flooring, Huge living room with fireplace and 1 Bed 1 Bath. Additional 1 Bed 1 Bath is upstairs providing tons of privacy. HOA amenities includes Clubhouse, trail, Community Pool, Spa, Tennis Court, Water, Garbage, Building Insurance, Common area Maintenan
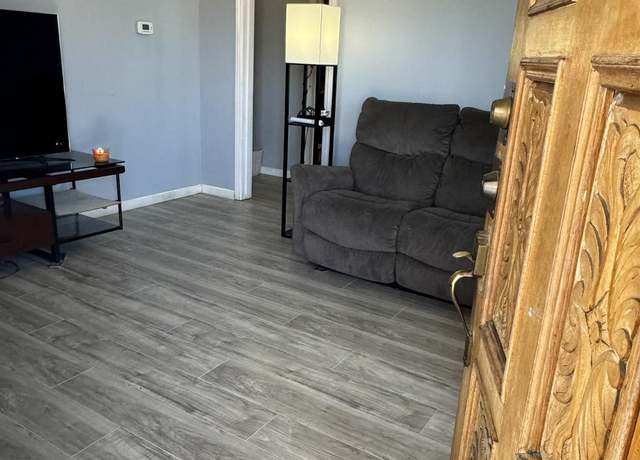
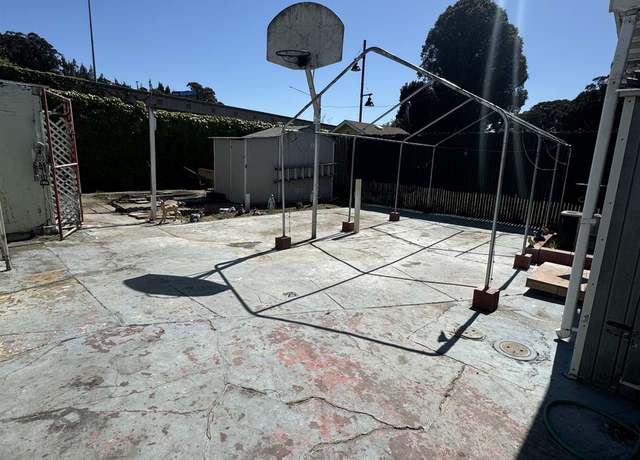
Located on this incredible corner lot in an area with access to everything, close to the freeway and close to all the shops, this beautiful house offers 3 bedrooms and 2 bathrooms with a huge family room, bamboo floors on most of the house, this cutie is ready to receive its new owners, 2 Car garage with a designated laundry area . Concrete all around the back yard which makes it low maintenance. The back yard counts with several mature fruit trees and a 12x10 tool shed to store everything you need, a beautiful garden in the front yard to beautify your home and a metal fence all around for privacy. Don't miss this sweet place out !!
Welcome to this charming residence nestled in the heart of San Pablo. Step into a light-filled living space that exudes warmth and comfort, inviting you to relax and unwind. The recently renovated kitchen is a chef's dream, featuring modern upgrades such as a stunning stone countertops with a matching backsplash, custom cabinets, offering ample storage, stainless steel appliances, and charming bay windows that bathe the area in natural light. This home offers a fantastic layout with spacious bedrooms and well-appointed bathrooms throughout, providing both privacy and comfort. What sets this property apart is the additional square footage of living space, offering endless possibilities for c
Nice condo perfect for 1st time buyers, students or investors. This 1 bedroom 1 bath 691sqft unit features laminate flooring, maple cabinets, granite countertops and stainless steel appliances. The updated bathroom has tile floors and shower walls with unique tile inlays. This unit's balcony overlooks the greenbelt and gardens at the rear of the property. The parking space for this unit is inside the parking garage and the parking lot is gated. The building is secured and has an intercom/door release system. There are laundry rooms conveniently located on each floor of the building. Close to schools and shopping with easy access to I-80, Richmond Parkway, I-580 and BART, this could be an ea
Beautiful, well-maintained, and move-in ready townhome in sought-after gated community Campo Verde neighborhood. This townhouse is situated in the best location in the community. With its own serene private side yard, perfect for family get-togethers, gardening, and relaxing while enjoying the calm setting. Fresh paint throughout. This townhouse features functional floor plan. Dining and living room flow with spacious and bright kitchen with stainless steel appliances. Downstair half bathroom with cabinets offers plentiful storage spaces. New laminate flooring on stairs and upstairs bedrooms. Delightful master suite featuring a walk-in closet, en-suite bathroom and plentiful natural light.
Great price on this conveniently located San Pablo condo! Well maintained 1bed 1bath unit in a secured building, gated parking unit w/ balcony, spacious living room and bedroom, close to laundry & elevator. Shopping and dining are a few blocks away.
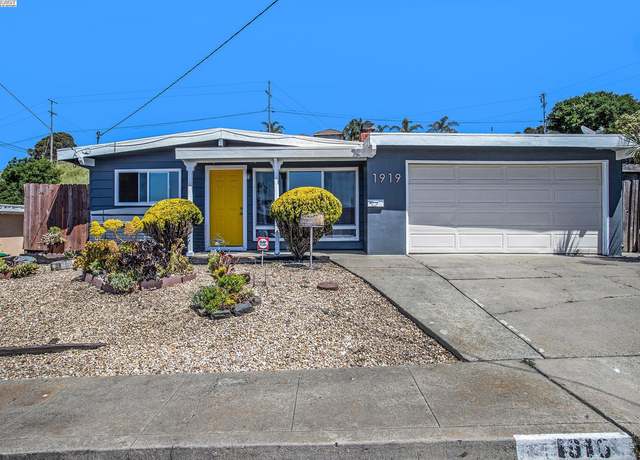
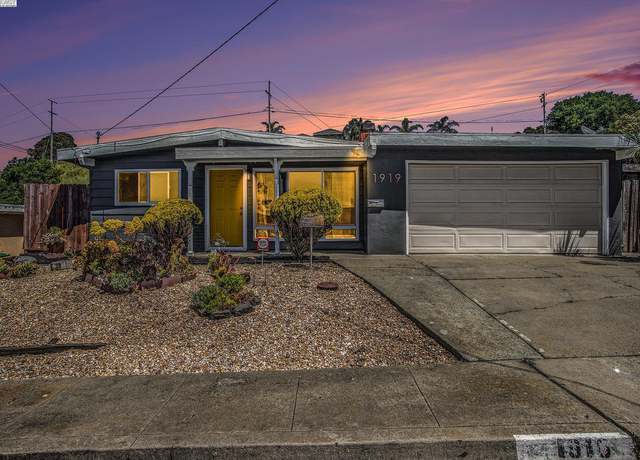
HOMES ARE HAPPIER IN TARA HILLS, Gorgeous Tara Hills remodeled rancher better than brand new, Features newly remodeled kitchen with all new cabinets and quartz countertop all stainless finishes and appliances, 2 new bathrooms with tile and quartz shower walls, luxury vinyl plank throughout, New electrical service with plugs and switches, All new doors and mirrored closet doors, New hardy backer siding in front, dual pane windows, new front door and exterior side doors, Freshly painted inside and out, nice quiet street, large view lot with off street parking and views of the bay from the backyard, close to everything shopping, transportation, schools. Don't let this one slip away, come by a
Condo is located in a nice gated Abella community Townhouse style complex. A two-story townhouse style w/ 2 bedrooms / 3 bathrooms ( 2/1 ) 2 car tandem garage, year built in 2008, 1286 sq ft, kitchen w/ granite countertop / oak cabinets. All hardwood floorings and recessed lightings throughout, washer / dryer inside the unit. nice, sunny and spacious kitchen, living room dining area and 1/2 bath located at the lower level. Both levels have a balcony deck. The upper level has 2 bedrooms, (1 master's bedroom w/ large walk-in closet ) and 2 full baths. Condo is ready for move, very well maintained by the owner. Easy access to H-80 and walking distance to Contra Costa College and Helms Middle S
This double wide 2 bedroom, 2 bathroom (+ an office) Mobile Home sits in the Tara Hills Mobile Manor 55+ community in San Pablo. Built in 2004, this spacious mobile home boasts a large kitchen containing a dining area, an island with a breakfast bar, and vaulted ceilings which opens up to the even larger living room. With plenty of cabinet and cooking space, you'll be exited to have the grandchildren over. The living room and halls have newer laminate flooring, with new carpet in the bedrooms. The interior was also freshly painted late in 2023. The large primary bathroom has an easy access shower stall and large vanity. The primary bedroom offers vaulted ceilings w/ ceiling fan and double s
Here's A Great Opportunity Now on the Market. A 2 Bedroom/2 Bath 2005 Palm Harbor! Priced aggressively at $179.500.00! Located in a Wonderful Senior Mobile Home Community by San Pablo Bay! It has a Unique Architectural Design with High Ceilings and Dormer Windows, a Den that may serve as an office or 3rd Bedroom, a Master Bath with a Soaking Tub and Separate Shower Stall! All the appliances are included! Close to the Community Pool and Clubhouse! Make an appointment to view it this week!
Welcome to your new haven on 22nd Street in the heart of San Pablo! This charming residence offers a perfect blend of comfort and convenience, making it an ideal place to call home. This central location is steps away from Contra Costa College, supermarkets, and so much more! Call today to view this amazing property! Whether 22nd Street will be your first home or added to your portfolio, this property is astonishing.
Welcome Home! Located in one of San Pablos most desirable neighborhoods. This ranch style home has been renovated with an open kitchen concept, quartz countertops and all stainless steel appliances, huge backyard where you can easily entertain your guests, updated bathrooms with tile, laminate flooring throughout. The primary suite offers its own bathroom for added privacy and convenience. Easy access to freeway & shopping centers. Come by and see, this one wont last.
Unlock the potential of enchanting 2651 Vale Road, a spacious residence nestled on a quiet, majestic road on a corner lot. This 4-bed, 2.5-bath home presents a rare opportunity to revitalize an original home into your dream oasis. Stepping inside, you'll find a layout that includes charm and character, showcasing the craftsmanship of its era. The kitchen, though original, awaits your personal touch to transform it. With a bit of creativity and vision, this space can be customized to suit your unique style and preferences. Upstairs, you'll find four bedrooms, providing ample room for family members, guests, or the flexibility to create a home office or hobby space. Outside, the property feat
Enjoy this beautiful 4 bedroom 2 bathroom home that has been well taken care of and recently updated in bathroom and kitchen areas with new tile flooring and new cabinetry. This two story house offers two bedroom one bathroom on one side of the home and a separate two bedroom one bathroom on the other side which have been separated accordingly. This layout is perfect for larger families or an opportunity to rent out a room that is separate from the rest of the house. The backyard has a garden and fruit baring trees and the front yard is fully enclosed with a gate and driveway leading to the 2 car garage (tandem). The seller is highly motivated. All offers are welcome and will be reviewed as
Contractors special! This property offers the chance to completly rehab the existing structure, or knock it down and create your own home design. San Pablo offers lots of restaurants, a community college and easy access to BART and to freeways!
Price reduced for quick sale, tenant occoupied needs 24 hours notice. Gated community of Westpark in San Pablo, this townhouse with a serene private backyard has been well maintained. Located in San Pablo, restaurant, shopping, schools Bart 580,80.
Rare 64-unit development opportunity in San Pablo planning approval. The 1.04 acre parcel is entitled for 50 1bd/1bth and 2bd/2bth units, six 3bd/2bth affordable housing units, and eight studio units. This is an excellent opportunity for a developer to capitalize on an established San Pablo market near Contra Contra Costa College, College Center, and popular Lytton Casino. Annual income for the property once fully leased should be approximately $1,694,640 making this a safe and profitable investment. Seller financing is available with excellent terms. There is a structure currently on the property so utilities are already on-site. Attractive San Pablo location surrounded by residential home
A super big lot located in the bay area. Calling all Investors, Developers, and the people who want to build a dream home. A great opportunity to develop, and build your dream. Over 3 Acres of prime property with a great view of the bay. Close to shopping, I-80 & I-580 freeway and more.
Attention contractors, builders, developers! Here is a chance to own two lots(Subdivided) in San Pablo! Total 9748 sq. ft. (per public records). Plans call for pier foundation. Sewer is in the middle of and electrical is on right side of street. Foundation grading has been completed(Step Level). Easy access to freeway 80, shopping and restaurants.
5000 SQFT OF LAND IN BACK OF 1911 MINER IS FOR SALE. LOCATED ON MESA BUENA. Spectacular view of San Francisco, Mt Tam and the Bay. Owner is selling 5000 sqft of land on the upslope of her property. Buyer has to make all investigations and due diligence as to suitability to build as well as for soil testing, survey of land and any all permits from the City of San Pablo. Buyer to bear all costs. Rare find in San Pablo.
This area's enrollment policy is not based solely on geography. Please check the school district website for more information.
Elementary schools
Middle schools
High schools
GreatSchools Summary Rating
4/10
Riverside Elementary School
Public, K-6
3/10
Lake Elementary School
Public, K-6
3/10
Vista High (alternative) School
Public, K-12 • Choice school
3/10
Highland Elementary School
Public, K-6
3/10
Edward M. Downer Elementary School
Public, K-6
Only showing 5 of
8 elementary schools.
School data is provided by GreatSchools, a nonprofit organization. Redfin recommends buyers and renters use GreatSchools information and ratings as a first step, and conduct their own investigation to determine their desired schools or school districts, including by contacting and visiting the schools themselves.Redfin does not endorse or guarantee this information. School service boundaries are intended to be used as a reference only; they may change and are not guaranteed to be accurate. To verify school enrollment eligibility, contact the school district directly.
San Pablo, California, offers a range of transportation options to cater to the needs of its residents. The city experiences moderate traffic levels, making driving by car a convenient option for many. Public transportation is also available, with regular bus services providing connectivity throughout the city. Additionally, San Pablo is conveniently located near major highways and freeways, offering easy access to neighboring cities and regions.
What types of properties are available in San Pablo?
San Pablo, California offers a variety of single-family home types, including ranch-style homes, contemporary homes, and modern homes, among others. These homes can be found throughout the city, with some located in established neighborhoods and others in newer developments. Most properties feature 2-4 bedrooms and were built within the past few decades. To explore different property types for sale in San Pablo, California, use the 'Home type' filter located above the active listings. Customize your search by selecting options like single-family homes, condos, townhomes, and more.
What is life like in San Pablo?
San Pablo, California offers a unique living experience with its diverse range of landscapes, including rolling hills, parks, and waterfront areas. The region experiences a moderate Mediterranean climate, characterized by mild winters and warm summers. The city provides a variety of job opportunities, with a focus on industries such as healthcare, education, and manufacturing. Residents can engage in a wide array of activities, including exploring nature trails, participating in community events, and enjoying local cuisine. The city fosters a strong sense of community, promoting engagement through various cultural and recreational activities.
What are the schools and amenities like in San Pablo?
San Pablo, California offers a variety of public amenities to its residents. You can find numerous restaurants serving a wide range of cuisines to satiate your taste buds. The city is home to several parks, providing an ideal setting for relaxation and leisure. Grocery stores are easily accessible throughout the city, ensuring that your daily needs are met conveniently. Additionally, San Pablo boasts other amenities such as libraries, fitness centers, and community centers to cater to diverse interests and needs.
In the past month, 8 homes have been sold in San Pablo. In addition to houses in San Pablo, there were also 8 condos, 4 townhouses, and 1 multi-family unit for sale in San Pablo last month. San Pablo is a fairly walkable city in Contra Costa County with a Walk Score of 73. San Pablo is home to approximately 28,934 people and 5,490 jobs. Find your dream home in San Pablo using the tools above. Use filters to narrow your search by price, square feet, beds, and baths to find homes that fit your criteria. Our top-rated real estate agents in San Pablo are local experts and are ready to answer your questions about properties, neighborhoods, schools, and the newest listings for sale in San Pablo. Our San Pablo real estate stats and trends will give you more information about home buying and selling trends in San Pablo. If you're looking to sell your home in the San Pablo area, our listing agents can help you get the best price. Redfin is redefining real estate and the home buying process in San Pablo with industry-leading technology, full-service agents, and lower fees that provide a better value for Redfin buyers and sellers.


 REDFIN IS COMMITTED TO AND ABIDES BY THE FAIR HOUSING ACT AND EQUAL OPPORTUNITY ACT. READ REDFIN'S FAIR HOUSING POLICY AND THE NEW YORK STATE FAIR HOUSING NOTICE.
 United States
 Canada