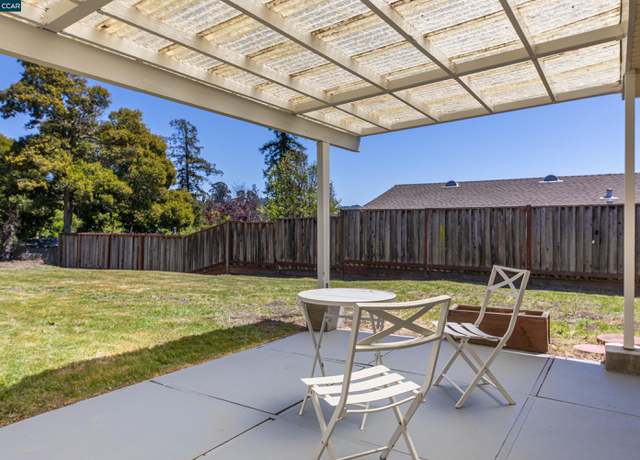
Open House Sunday 5th 1-4 pm. Charming home! Quiet neighborhood, secluded, private, LEVEL, large backyard. Fruit trees, raised beds for growing vegetables & gorgeous Redwood forest, Fully Fenced with a VIEW of San Pablo Bay. Conveniently located near schools, transportation & shopping. Wonderful Light and Bright! Spacious! High vaulted ceilings, Large picture window, Dual Pane windows, New resilient luxury vinyl flooring & New carpet, Just painted, New Appliances, stove, dishwasher, refrigerator and large pantry. ALL new plumbing & water fixtures, new shower enclosure, sewer lateral replaced, Hot Tub electric prepped in covered patio, Single car garage-workshop with
Welcome to 554 Rincon Road - Located in the Heart of El Sobrante, a Fantastic Opportunity Awaits! This charming home boasts a bright and inviting open floor plan, perfect for comfortable living and entertaining. Featuring: 3 Bedrooms, Providing ample space for relaxation and privacy. 1 Full Bathroom, updated for modern convenience. Updated Kitchen, A culinary enthusiast's delight, equipped with modern amenities. A large living room, enhanced by a cozy fireplace, creating a warm ambiance. New Engineered Flooring, enhancing both aesthetics and durability. Freshly Painted, offering a clean and contemporary look throughout. Updated Windows, Maximizing natural light and energy efficiency. 1 car
This beautiful townhome is nestled in a peaceful gated community, where you can relish in the serene hillside views. Access the outdoor spaces from the kitchen and dining room. Outside, the inviting deck area sets the scene for leisurely moments. The living room is replete with vaulted ceilings and a fireplace if you wish to take your leisure time back inside. Park with ease in the two-car attached garage, and take advantage of the community playground and the convenience of this location, just minutes away from Interstate 80 and Pinole Vista Shopping Center. With Richmond BART a mere 12-minute drive away, this move-in-ready home is perfect for homeowners seeking space, comfort and convenie
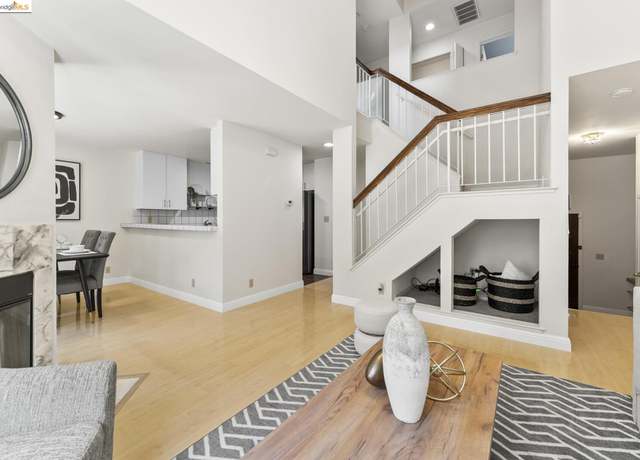
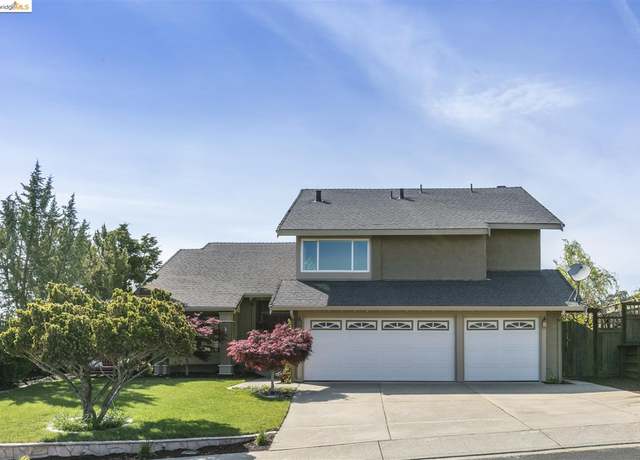
Pride of ownership is evident everywhere in this thoughtfully updated and beautifully maintained Richmond/El Sobrante Hills home offering exceptional square footage, privacy, and stunning, panoramic SF Bay and Mt Tam/Marin views from nearly every room in the house. Located in El Sobrante's desirable May Valley neighborhood, this spacious contemporary home features 4+BR, 2.5 BA, an open living/dining room, a kitchen/great room combination, a large home office/playroom (potential 5th BR), a laundry room & 3-car garage. The extensive list of owner upgrades/remodels includes custom maple kitchen/great room cabinets, granite counters, custom great room shelving & a recently remodeled
On a sleepy cul-de-sac there lies a serene one level mid-century retreat awaiting you. Perhaps you’d like to putter in the garden pruning the mature bonsai trees? Or possibly tend the vegetable garden in the raised planter boxes? When you’re done, why not enjoy a soak in the jacuzzi tub? This expansive home offers so much with 4 beds, 3 baths, a large open kitchen/dining/living room, a separate formal dining room, and a huge family room all on one level with beautiful bamboo flooring throughout. Most of the original mid-century details have been preserved including matching cabinets and wood doors. Plenty of parking with a 2 car garage and a large parking pad on both ends. Fruit
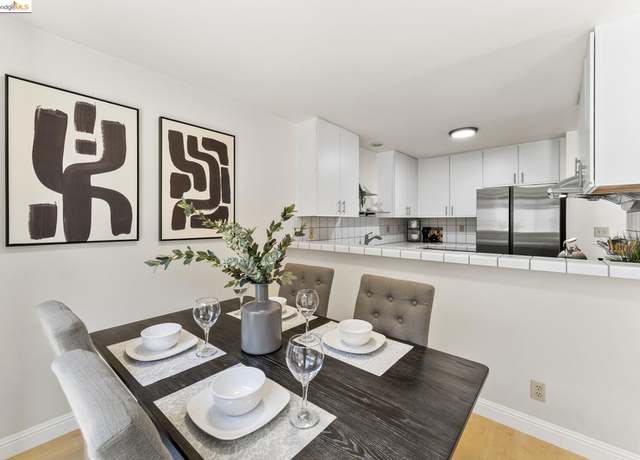
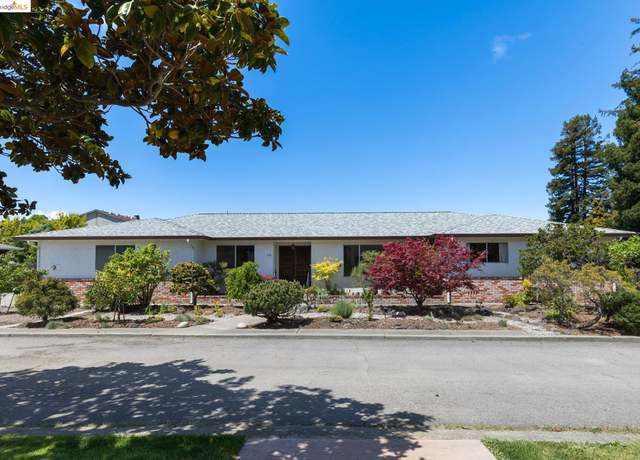
Explore this well-maintained property featuring six bedrooms and four and a half bathrooms * . Sellers used as a multi-generational compound with two separate large three-bedroom, two-bathroom spaces * . This home offers a great balance of private and shared spaces, with functional and aesthetic upkeep evident throughout. The exterior presents a clean, landscaped front with a wide driveway leading to a two-car garage. Inside, each separate living space is bright with spacious rooms. The living areas are comfortable, with stone fireplaces and large windows allowing plenty of natural light. Both living spaces feature modern kitchens with stone countertops, updated appliances, and ample cabine
Nestled in the heart of El Sobrante, CA, discover your dream retreat at 753 Alhambra Rd. This newly remodeled gem offers 2 bedrooms, 1 bath, and a spacious 1-car garage on an expansive 6,538 sqft lot. Step inside to find a haven of modern comfort, featuring dual pane windows, a remodeled kitchen boasting stainless steel appliances and quartz countertops, and a luxurious remodeled bath. Experience year-round comfort with central A/C and heating, while the sizable backyard beckons with the potential for an ADU amidst mature trees. Enjoy the tranquility of no rear neighbors in this peaceful enclave, conveniently located near freeway access, dining options, coffee shops, and major retail stores
Discover your personal retreat on this highly sought-after investment opportunity in Mid-El Sobrante Valley. This almost 2 acre property, currently zoned R-7, features a charming 3 bdm 2 bth vintage farmhouse on a creekside setting, showcasing a large kitchen with vaulted ceilings that meld modern functionality with classic farmhouse charm. The single level main residence features a spacious 3 bdm 2 bth open floor plan layout, and it enjoys a spectacular large swimming pool, on a huge deck, great for family gatherings and summer parties. There's also a huge oversized workshop/ garage on site. This property is an ideal multi-generational compound or shared retreat, blending endless opportun
Step into your single-story sanctuary in El Sobrante! This charming single-family home boasts an open floor plan and a cozy electric fireplace in the family room. The updated kitchen features granite countertops, stainless steel appliances, gas range, while two renovated bathrooms add modern convenience. Enjoy the warmth of original hardwood flooring throughout. A newer, energy-efficient roof and dual-pane windows enhance comfort and sustainability. Outside, the 8,400 sq ft lot offers a private backyard oasis with a hot tub and patio. Plus, indulge in the convenience of a slider door off the master bedroom. Located near Highway 80 and shopping amenities, this 1,080 sq ft home also includes
Beautiful 4BD/2BA home in a nice and quiet neighborhood. New carpet and paint in bedrooms, large living room with fireplace, open kitchen, dining area, 2-car garage. Close to school, transportation and shopping.
Welcome to Westwood Oaks, Nestled in the lush hillside of El Sobrante. This cozy 1 bedroom, 1 bathroom condo sits on the top floor overlooking the manicured community pool and hillside in the distance. Upgraded with new carpet and paint, this condo is sure to welcome you in and make you feel right at home. Enjoy your days lounging by the well maintained community pool, or play a game of tennis with a friend on the private tennis courts. If you are an outdoor enthusiasts, this condo is situated near many hiking trails such as Sobrante Ridge Trail, Kennedy Creek, Oak Trail, and the Manzita Loop Trail. Whether you enjoy a refreshing swim, a competitive game of tennis, or a leisurely hike in na
Welcome to this beautiful home! You will love this fully renovated home with tons of light and fresh air. Right when you walk in, front door that leads you to the main living room, beautiful open kitchen floor plan. 3 beds, 2 baths. This home is 1440 sqft in a HUGE lot in a highly desirable quiet neighborhood. Brand new stove & refrigerator, stone countertops, and a cozy breakfast area. Come see for youself! You will love it.
Price Reduction and all new carpet throughout bedrooms and downstairs. Welcome to 1800 Dalessi Lane! A stunning townhome nestled in the heart of Pinole, California. This contemporary abode offers a perfect blend of comfort, convenience, and style, making it an ideal place to call home. Step inside to discover a spacious layout flooded with natural light, enhancing the airy ambiance throughout. The main level boasts an inviting living area, perfect for relaxing or entertaining guests. A modern kitchen awaits, complete with sleek countertops, appliances, and ample cabinet space, catering to all your culinary needs. Downstairs, you'll find two generously sized bedrooms, each offering comfort a
Two bedroom lower level condo. Living room with sliding door to rear patio. Dining area. Kitchen with appliances. Bedroom with walk in closet. Swim pool and tennis court. Close to transportation.
Great Opportunity!! Come see this updated home, the possibilites! 3 Bedroom 1 baths with on over 1/2 acre (. 55 sq ft lot)! Big enough for a boat, a semi or possible to build ( Buyer to verify with City Building) Close to shopping, hwys and more, Come before its' gone!
Opportunity knocks!! Come see this home, lots of potential here. 3 Bedroom 3 baths with over 17,000 sq ft Lot! Spacious lot big enough for a boat, a semi or possible to build ( Buyer to verify with City Building) Close to shopping, hwys and more, Come before its' gone!
Just steps away from the pool, this ground floor 1 bedroom 1 bath unit has unlimited possibilities. Close to parks, schools, and shopping and the freeway making daily life more convenient. Take a morning coffee walk and view the hills and wildlife or start your day with a dip in the pool. Relax on your private balcony . Assigned covered carport and plenty of guest parking. Grab your tennis shoes and challenge a friend and get your workout in on the tennis court. The home has been virtually staged.
Welcome to your dream home nestled in Richmond, CA. This magnificent 3256 sq ft residence is an end unit that offers privacy and beautiful canyon views. As you step into the upper level, you're greeted by a formal entrance and a spacious living room with high ceilings and plenty of natural light. Adjacent to this is a spacious dining area, and an open kitchen. This level also offers a master bedroom, one regular bedroom, and 2 storage rooms. The lower level offers a cozy family room, one master bedroom, and 4 regular bedrooms. The backyard offers a good entertainment space for friends and family as well as room for gardening. This is a MUST SEE!
This delightful El Sobrante condo is enveloped by lush trees and meticulously maintained landscaping. The property boasts a two-level floor plan that offers privacy with no neighboring unit above or below. The generous layout features two good-size bedrooms and 1.5 bathrooms. Among the notable upgrades are Milgard energy-efficient windows, attic insulation and ceiling fans. The Levolor cellular shades provide versatility by allowing for adjustable light control, privacy, and the opportunity to admire the scenic skyline and serene tree-filled surroundings. Enjoy your favorite beverage on the patio while soaking in the picturesque view of the San Pablo Ridge greenbelt or cool off in the pool
Here's your Country Castle!!!! Includes adjacent parcel totaling . 54 acre. Nestled in beautiful wooded setting 2 bedroom, 1 bath, gorgeous Knotty Pine throughout, fireplaces, dining, skylights, decks, bay views, hardwood, fans, basement, attached garage, central heat, detached barn style building for artists, hobbyists, storage, lots of off street parking. Awesome unique property. New central heat, and new flooring throughout. There is a large unfinished basement. RV and/or boat off street parking. Beautiful private yard in a peaceful setting. All furnishings and appliances are included in the sale. Barn could also be used for animals. OPEN HOUSE SUN 5/3 FROM 1-4PM.
Welcome to this amazing 2 Bed 1 Bath located in a highly sought-after El Sobrante Valley! Located on the top floor features an open floor plan with a bright living room, optional eat-in kitchen, and a large deck offering beautiful amenities views. Westwood Oaks complex features a community pool, tennis court, and a laundry facility. Conveniently located around school, shopping, dining, BART, and freeways. Don't miss the opportunity!
One of the last Large parcels available in El Sobrante over 8.54 acres. Nice Farmhouse with 3 Bedrooms, 1 Bath, 1386 sq ft, Big Detached Garage, Barn and several detached Sheds on the property, Fantastic location about 7 miles to Orinda, Development potential, PLEASE DO NOT DISTRUB OCCUPANTS/TENANTS.
Possibilities abound! Property has been used as a car dealership, real estate office and most recently, rented to several church groups. Plans and permits for grocery store with hot food area (restaurant). Plumbing and some electrical has been completed. Large open space with initial buildouts for bathrooms, walk-in refrigerator and walk-in freezer. New roof done within the last year.
Endless possibilities! Nestled in the desirable neighborhood, with over an acre of land, this fixer upper is waiting for your imagination and creativities. Enjoy the spectacular sunset and views of mountains in the heart of El Sobrante, with easy access to freeway, shopping, parks, and schools.
This is one of the kind big two story house located at the end of the private road. Huge living room and dinning room combo. Patio around the upper level for sunshine and fresh air. 3 bed rooms on upper level with sliding door going out to patio. Master room with large walk-in closet. There are big entertainment room and bar downstairs. Side yard and front yard provide more than 15 cars parking space.
This is a rare chance to build an awesome home from the ground up in the wonderful city of El Sobrante! The owner has agreed to let a 3rd party, BuildCasa, perform an urban lot split and subdivide the property into two separate parcels as authorized by SB9. Developable assumptions for this site include a 4 bedroom, 3 bathroom, 1,700 SF SFR. Optional design and permitting services are available from BuildCasa with a separate agreement. Buyer to verify all uses of the land, size of the land, utilities, etc with the city. The listed lot size is an estimate. Don't miss this opportunity to build a home you love!
33106 square foot residential vacant land is located between 4259 San Pablo Dam Road (a multi-unit apartment) and 4275 San Pablo Dam Road (a single family home). Cross street is Milton Drive. Seller has no reports. Buyer is encouraged to check with Contra Costa County for the highest and best use of the lot. Please be mindful not to cross 4275 right hand side neighbor's property line. Thank you.
The Land is centrally located in Unincorporated El Sobrante. Land is Surveyed. Lot located along a small rural like COURT Street (No thru traffic). yet close to Bay Area Amenities nearby Regional Parks, Shorelines, Shopping, Schools. Seller has topographical and boundary, survey, arborist & soils analysis & engineering plans for a very cool container home on the property. Call agent for more questions.
Attention contractors, builders, developers! Here is a chance to own two lots(Subdivided) in San Pablo! Total 9748 sq. ft. (per public records). Plans call for pier foundation. Sewer is in the middle of and electrical is on right side of street. Foundation grading has been completed(Step Level). Easy access to freeway 80, shopping and restaurants.
DEVELOPMENT OPPORTUNITY! This property comes with an approved tentative map for 7 residential units ( Since Expired. Expired 11/23 ). Possible to get more units approved per owner. This is 2.57 acres of prime buildable land. See disclosures for the 'Improvement Plans for San Pablo Estates'. Nearby development ( built-in 2001, has homes selling for over $1 million. ) Easy access to major freeways, shopping, and schools conveniently close, and San Pablo Dam is right down the street as well as outdoor activities opportunities thru EBMUD and EBRPD parklands.
New Price $240,000. Bring your offer. Picture this: A stunning lot, nestled right off Castro Ranch Road and Hillside Drive, where you can build a dream home—and more! With breathtaking views and an fabulous location, Hillside Drive is truly one of the East Bays best-kept secrets. Here, you'll find a no-through road that leads you straight to the Kennedy Grove Recreational Area, offering endless hours of hiking, picnicking, and water sports fun. Talk about convenience - this gem is minutes to Orinda, San Pablo Reservoir, and convenient to Freeway 580 and shops. The lot is zoned R15, and all utilities extend to the edge of the property line. Tavaszi Terrace is a private road that also p
Per the Pinole Planning Division the property is zoned mixed use - Residential/ mixed use/Rural. If Residential at least 51% of area must be residential. If commerical cannot exceed 45% of area. To access property enter driveway between 2643 & 2649 Appian Way. Subject Property is located on the right side of the end of the driveway.
Investor or builder, build your luxurious dream home here on 2.74 acres, To be Bought with adjoining Lot # 7 Abbie Lane. \ of app 1.16 acre total of app 3.7 acres. Build Possible 4 homes on these 2 lots. Or main House and ADU. Drawings of over 4000 sq ft homes Plus AN ADU possible Close to approvals. Sits on top of Hill with Valley Views. Price is for BOTH LOTS #7 and #15 Abbie lane, to be sold together. Possibility of 4 Gorgeous homes on 4 lots. Walk to Kennedy Grove, near Outdoor Reservoir and open space. Price is for BOTH LOTS #7 and #15 Abbie lane, to be sold together. (equal approximately only $225000 per lot ) and approximately 3/4 acre each lot. after subdivided.
Build Gorgeous custom homes with up to 4000 sq feet of Living space on 1.16 acres and can build additional ADU on Property. Also #15 Abbie Lane comes with Project of approx. 3.7 acres and can Build House plus ADU. Close to having Approval. Read disclosures and letters from County. See disclosures and Artists rendering. Surveys , Soils reports, Engineering complete and drawings. Homes in area like this well selling in millions. Possibility of 4 Gorgeous homes on 4 lots. Walk to Kennedy Grove, near Outdoor Reservoir and open space. Price is for BOTH LOTS #7 and #15 Abbie lane, to be sold together.
This area's enrollment policy is not based solely on geography. Please check the school district website for more information.
Elementary schools
Middle schools
High schools
GreatSchools Summary Rating
6/10
Olinda Elementary School
Public, K-6
4/10
Ellerhorst Elementary School
Public, K-6
4/10
Valley View Elementary School
Public, K-6
3/10
Murphy Elementary School
Public, K-6
3/10
Sheldon Elementary School
Public, K-6
Only showing 5 of
8 elementary schools.
School data is provided by GreatSchools, a nonprofit organization. Redfin recommends buyers and renters use GreatSchools information and ratings as a first step, and conduct their own investigation to determine their desired schools or school districts, including by contacting and visiting the schools themselves.Redfin does not endorse or guarantee this information. School service boundaries are intended to be used as a reference only; they may change and are not guaranteed to be accurate. To verify school enrollment eligibility, contact the school district directly.
El Sobrante, California, offers a variety of transportation options, including public transit and car travel. The area is served by several AC Transit bus lines, providing residents with a viable alternative to driving. For those who prefer to travel by car, traffic levels in El Sobrante are generally moderate, although peak hours can see an increase in congestion. The region also boasts easy access to major highways, including Interstate 80 and State Route 4, facilitating efficient travel to surrounding areas.
What types of properties are available in El Sobrante?
El Sobrante, California offers a variety of single-family home types, including ranch-style homes, contemporary homes, and modern homes, among others. These homes can be found throughout El Sobrante, California, with many located in established neighborhoods and newer developments. Most properties feature two to five bedrooms and were built in various years. To explore different property types for sale in El Sobrante, California, use the 'Home type' filter located above the active listings. Customize your search by selecting options like single-family homes, condos, townhomes, and more.
What is life like in El Sobrante?
El Sobrante, California offers a unique living experience with its picturesque landscape surrounded by rolling hills and lush greenery. The weather in El Sobrante is characterized by mild winters and warm summers, allowing residents to enjoy a variety of outdoor activities throughout the year. The town provides a range of job opportunities, from local businesses to larger corporations, ensuring residents have access to diverse employment options. With its proximity to the San Francisco Bay Area, residents can easily explore nearby cities for entertainment, dining, and cultural experiences. El Sobrante also boasts numerous parks and recreational areas, offering residents ample opportunities for outdoor recreation and relaxation.
What are the schools and amenities like in El Sobrante?
El Sobrante, California offers a variety of public amenities to its residents. The town boasts a number of restaurants, providing a wide range of culinary experiences. For those who enjoy the outdoors, there are several parks available for leisure and recreation. Grocery stores are also present, offering convenient access to daily necessities. Additionally, other amenities such as schools, libraries, and fitness centers are part of the community infrastructure in El Sobrante, California.
In the past month, 7 homes have been sold in El Sobrante. In addition to houses in El Sobrante, there were also 7 condos, 1 townhouse, and 1 multi-family unit for sale in El Sobrante last month. Find your dream home in El Sobrante using the tools above. Use filters to narrow your search by price, square feet, beds, and baths to find homes that fit your criteria. Our top-rated real estate agents in El Sobrante are local experts and are ready to answer your questions about properties, neighborhoods, schools, and the newest listings for sale in El Sobrante. Our El Sobrante real estate stats and trends will give you more information about home buying and selling trends in El Sobrante. If you're looking to sell your home in the El Sobrante area, our listing agents can help you get the best price. Redfin is redefining real estate and the home buying process in El Sobrante with industry-leading technology, full-service agents, and lower fees that provide a better value for Redfin buyers and sellers.


 REDFIN IS COMMITTED TO AND ABIDES BY THE FAIR HOUSING ACT AND EQUAL OPPORTUNITY ACT. READ REDFIN'S FAIR HOUSING POLICY AND THE NEW YORK STATE FAIR HOUSING NOTICE.
 United States
 Canada