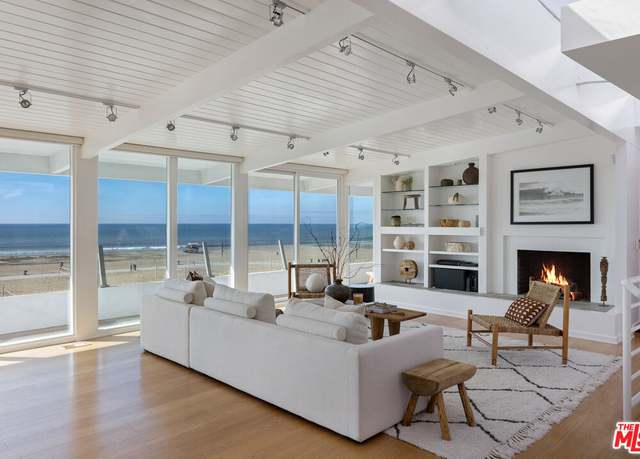
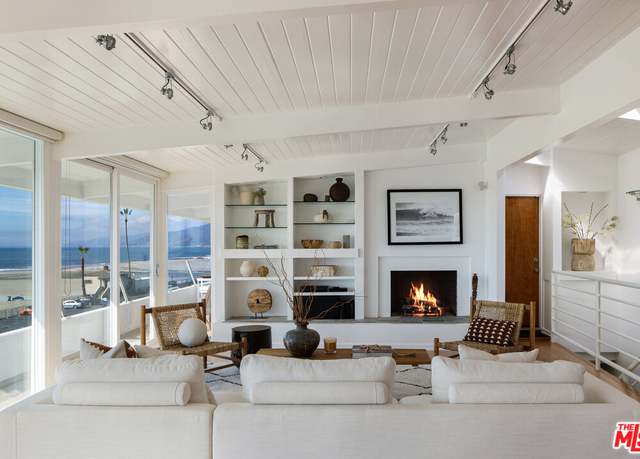
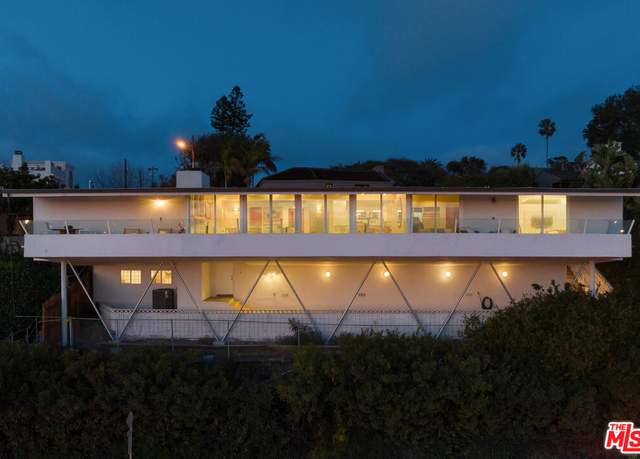
Perched on the bluffs of the highly-coveted Santa Monica Canyon, this iconic oceanfront gem boasts arguably the best ocean views on the Westside. Jim Charlton AIA, an apprentice of Frank Lloyd Wright and who also worked with John Lautner, designed this mid-century modern stunner. This bright and airy home offers 3 bedrooms, 2.5 bathrooms, wall-to-walls of glass, and impeccable design throughout. The open floor-plan features the spacious living room with a fireplace, dining area, and the well-appointed kitchen with a breakfast bar. Panoramic sliding glass doors span the main living space and seamlessly open onto the covered balcony that showcases breathtaking coastline views. The main level
Lovely 2 bedroom, 1.75 bath condo located on a beautiful tree-lined street in the heart of Santa Monica. Flooded with natural light, the unit boasts a spacious living room with dining area and patio. Both bedrooms are generous in size with ample closet space. Newer floors throughout, low HOA, in-unit washer/dryer and one carport parking space with extra storage. With its prime location just south of Santa Monica Blvd, you are minutes away from countless shops, restaurants, and modern conveniences.
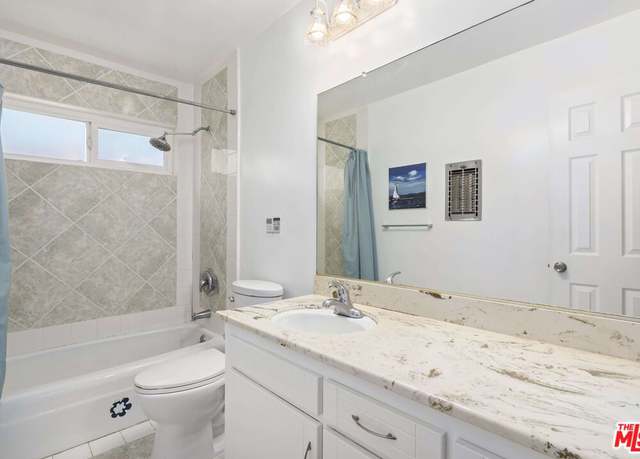
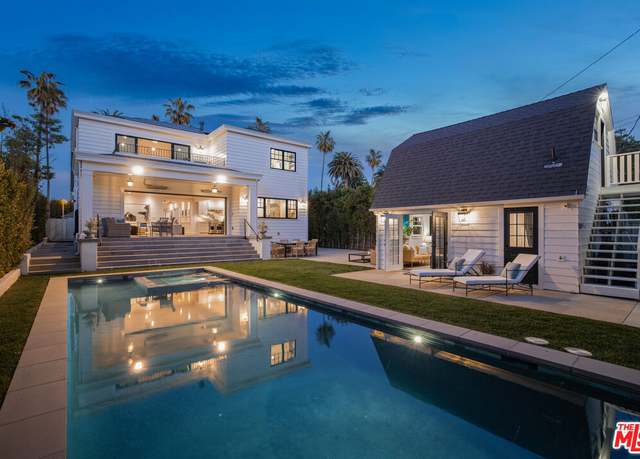
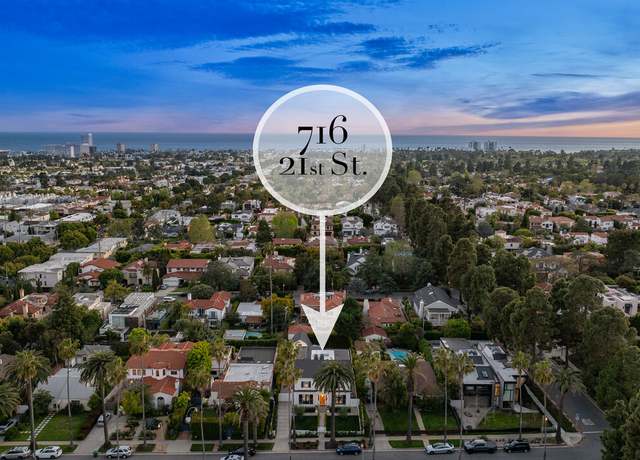
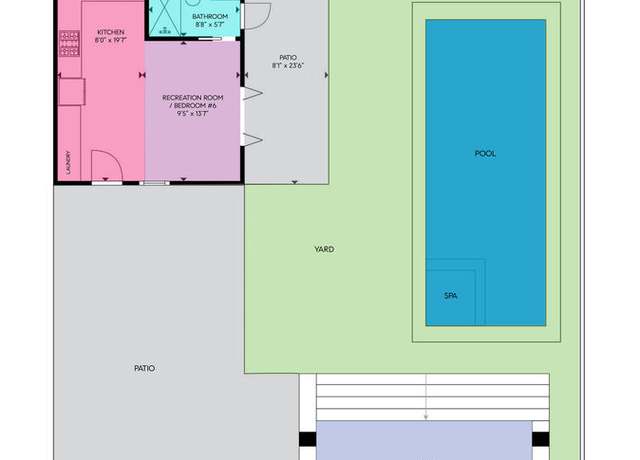
Introducing this authentic and fully renovated 1928 Dutch colonial revival home, designed by famed local Santa Monica architect, Henry C. Hollwedel. Adorned with Hollwedel's accented signature "crescent moon" embossed window shutters, this classic property was reimagined and fully remodeled with extensive square footage added in 2022. The restoration commenced with a "down to the studs" re-build that painstakingly blended the home's historical hallmark features while seamlessly blending in contemporary finishes consistent with the design trends of the 1920's. This two story main house and detached guest house now total almost 4,500 square feet of luxury coastal living wi
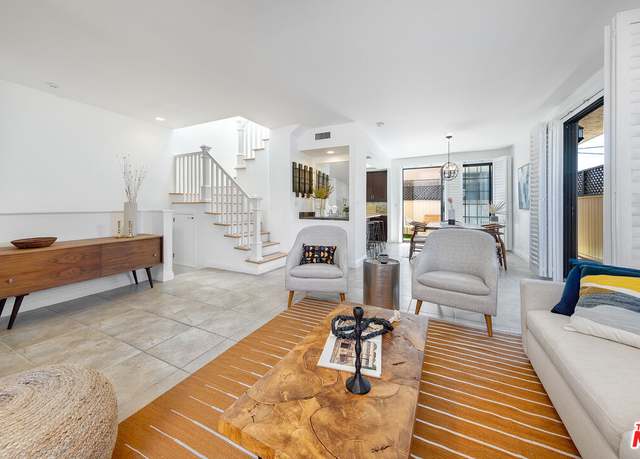
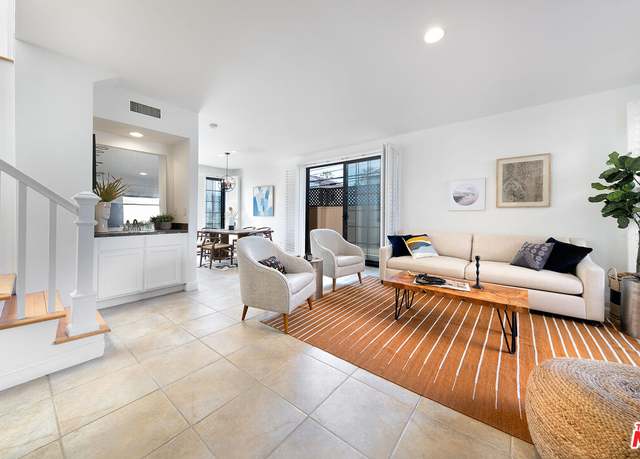
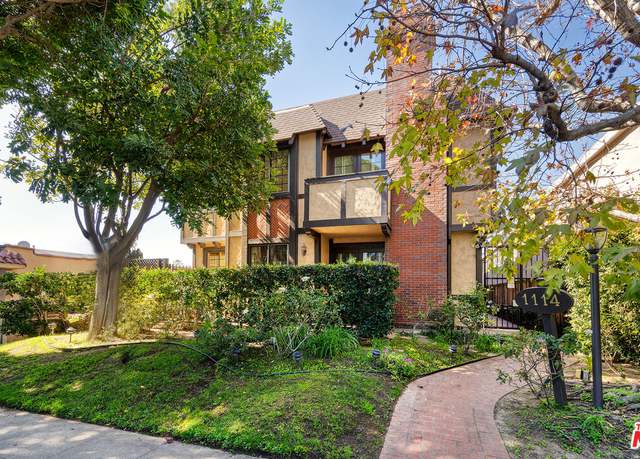
Welcome to 1114 20th Street #6, Santa Monica, CA A Gem in the Heart of Wilshire/Montana - Nestled in the sought-after Wilshire/Montana neighborhood of Santa Monica, this exquisite 2-bedroom, 2.5-bathroom end unit townhome is a testament to pride of ownership. As part of a tranquil 6-unit complex, this west-facing residence boasts a generous wrap-around patio on the first level, offering an idyllic outdoor retreat. The open floor plan seamlessly integrates living, dining, and kitchen areas, creating an inviting atmosphere for both relaxation and entertainment. High ceilings and skylights flood the space with natural light, enhancing the sense of openness and comfort. The updated kitchen, fe
Welcome to your dream beachside retreat in the coveted Ocean Park neighborhood, just 120 steps away from the glistening sands and soothing waves. This indoor-outdoor designed beach house offers the epitome of coastal luxury living. Ascend to your private rooftop deck, where panoramic ocean views and a bubbling spa await, offering the perfect sanctuary to unwind and savor breathtaking sunsets. Inside, revel in the spacious loft-style layout, adorned with premium amenities and designed for both relaxation and creativity. Central to the world-famous Santa Monica Pier and Main St. restaurants, this residence offers the ideal blend of tranquility and convenience. Indulge in the ultimate entertai
Enjoy the dramatic sunsets and ocean views from this spacious and bright unit in the Boca Monica, one of the most desirable buildings on Santa Monica's prestigious Ocean Ave. Across the street from Palisades Park and the beach, this expansive and bright unit with 2 bedroom, 2.5 bath plus den/office (could be 3rd bedroom) will satisfy the most discriminating buyer. Living room w/ fireplace opening to inviting patio. Eat-in kitchen has newer stainless steel appliances and ample cabinet space. The exceptionally spacious primary bedroom features an abundance of closet space, along with dual vanities in the adjoining en-suite bath, with a separate tub and shower. Second bedroom also has en-suite
Absolutely charming single level 3-bedroom and 3-bathroom traditional home in idyllic North of Montana! Offered for the first time in over 50 years, this lovingly maintained home is nearly 2150 sqft and situated on a nearly 9250sq. ft sunny, flat lot whose frontage is approx. 61'. This rarely offered charming starter home is prime for a remodel or expand/rebuild amongst some of Santa Monica's most sought after and celebrated real estate. Inside, awaits a floorplan that is not only spaciously accommodating, but truly lends itself to a more contemporary reimagination. The courtyard configuration allows for French doors to step onto decks and into a private and lush yard that affords entering
Luxury costal living at its finest, welcome to Sea Colony III. Located across the street from the beach and one block to Main Street is a move-in two bedroom and two bath unit overlooking the pool and spa. As you enter one is greeted by freshly done hardwood floors and new paint creating a tranquil space. The open living and dining room features a wood burning fireplace and access to the large patio overlooking the pool. The kitchen has been updated with Caesar stone counters, stainless steel appliances and a wonderful breakfast/office space. The primary suite is a lovely retreat with a beautifully updated bath with dual sinks and a separate tub and shower, a large walk-in closet and acces
Stunning architectural end unit townhouse style condo in Prime Santa Monica! Enjoy amazing light and a wide-open floorplan with 2 story high ceilings and tons of West facing windows. This unique property is designed by the award-winning local architect Michael Folonis, who’s known for his popular modern architectural style. An ideal layout offers 2 large bedrooms plus an airy loft, 3 bathrooms, balcony off the kitchen and a hard to beat roof top deck with amazing views. Take advantage of the desirable location, close to the beach, Main Street, Downtown SM and trendy restaurants, bars and shops nearby in Venice. No need to drive around when you’re so close to everything, park you
Property consists of two separate structures, a double-car garage plus eight open parking spaces serviced by a rear alley. The front building has five units including one 3 BD/1 & 1/2 BA unit and four 2BD/1BA units. The rear building is a 2 BD/1 BA single family house. Great rent income upside on tenant turnover.
We are proud to present 1311 Euclid Street, a 11 unit multifamily property in Santa Monica, CA. Built in 1968, this 10,384 square foot property sits on a 0.17 acre lot and it boasts a strong unit mix of three 1 bed/1 bath, two 2 bed/1 bath, two 2 bed/2 bath, and three 3 bed/2 bath units. The subject property resides less than one and a half miles from the beaches of Santa Monica and hubs for shopping, entertainment, restaurants, and nightlife for beach city locals. The property offers ample carport parking at the rear alley and side of the building. To enhance the quality of living for residents, the property features a smoke-free environment, security systems, cable ready, storage spaces,
Charming home on a large corner lot in prime Santa Monica! This charming single family home offers a thoughtfully designed floor plan, featuring a spacious living room bathed in natural light, a formal dining room that sets the stage for memorable gatherings, and a generous kitchen with stainless steel appliances, ensuring both functionality and comfort. Escape to the enchanting private backyard oasis that provides the perfect backdrop for alfresco dining, leisurely afternoons, and year-round California living at its finest. Located just moments away from LA's vibrant dining, shopping, Farmers Markets, and grocery stores like Erewhon, Whole Foods, Trader Joes, and Bristol Farms, every conve
Welcome to 201 Ocean Ave. , #403B, where breathtaking views of the Santa Monica Pier and city skyline await you. This stunning one-bedroom, one-bath residence boasts turn-key condition and features a private balcony overlooking the mesmerizing ocean and sparkling pool below. Situated in the Incredible Ocean Towers, a full-service building, residents enjoy a wealth of amenities including a pool, spa, world class fitness room with sauna, meeting facilities, and the convenience of 24-hour concierge and security services. Additional luxuries include valet parking and optional maid service, ensuring a lifestyle of comfort and ease. Located just steps from the vibrant Santa Monica Beach, resident
Welcome to your new cozy sanctuary nestled in the heart of Santa Monica's enchanting Sunset Park neighborhood! This cherished 3-bedroom, 2-bathroom home, complete with a detached garage converted into an apartment-style space, exudes a timeless charm that has been adored for years. Set on a peaceful, tree-lined street, this residence offers a harmonious blend of tranquility and convenience. As you step inside, you'll be greeted by airy and light-filled rooms that create an inviting ambiance throughout. The layout includes a formal living room, a dining area, and a spacious kitchen, perfectly suited for both everyday living and entertaining. All three bedrooms including an en-suite are strat
Beautiful warm contemporary 2 bedroom + Den condo offers the perfect blend of style and comfort in beautiful Santa Monica. Two full bathrooms, outdoor living space, and in-unit laundry makes this an extremely desirable home. Lots of natural lighting in the open floor plan, recessed lighting throughout, a living room with a gas fireplace and sliding glass door that leads to the patio with a a fire pit & ambience string lights. The ocean breeze flows through the windows into the bedrooms, dining room and the modern kitchen with stainless steel appliances. The delightful building (with elevator) boasts a gym, bike room, a large storage room, security door with intercom, and meticulously
Welcome to Santa Monica's best oceanfront residence adjacent to the iconic Santa Monica Beach and Palisades Park. Offering not just a home but a lifestyle experience, this unit blends resort-style amenities with high-end urban living. Enjoy beautiful Santa Monica Mountain Views from this back facing 11th floor unit. With exclusive features like a state-of-the-art fitness center with sauna, a pool and spa, 24-hour concierge and security, valet parking, and optional maid service, convenience and luxury are at your fingertips. Situated steps away from Santa Monica's finest dining on Montana Avenue, Third Street Promenade, and Ocean Avenue, culinary adventures await you. The unit itself boasts
Welcome to Santa Monica's best oceanfront residence adjacent to the iconic Santa Monica Beach and Palisades Park. Offering not just a home but a lifestyle experience, this unit blends resort-style amenities with high-end urban living. Enjoy sunets over the Malibu Coastline views in this 18th level 1 bed | 1 bath unit. You won't want to leave this cozy unit. With exclusive features like a state-of-the-art fitness center with sauna, a pool and spa, 24-hour concierge and security, valet parking, and optional maid service, convenience and luxury are at your fingertips. Situated steps away from Santa Monica's finest dining on Montana Avenue, Third Street Promenade, and Ocean Avenue, culinary adv
Affordable Santa Monica Beach location and Promenade lifestyle. Walking distance south to the beach and 3rd Street Promenade or north to the Community College. Lower level single story unit is good for all ages. Lovely quiet neighborhood. Prime location within gated beautifully landscaped and spacious courtyard makes it child and pet friendly. Tucked in one corner of the community for quiet peaceful living. Window views are of the courtyards. Close access to remote gated parking area, with TWO dedicated or assigned parking spots #28 and #2 is covered with your own small extra storage area. Two clean laundry rooms each with two sets of washers and dryers for the complex. Close knit family co
Amazing opportunity to own property in Santa Monica! - Located on a nice tree lined street, this charming Spanish style home is looking for its next owner to give it their TLC! With huge windows and tall ceilings, the home is very bright with natural light pouring in! The backyard is tranquil and landscaped. The two car garage is detached and at the rear with alley access and may be an excellent ADU project. Just a block outside of "Sunset Park" with great shops, restaurants, coffee, and parks nearby.
Introducing an exceptional offering within Santa Monica's premier condominium community, The Sechelle. This LEED Silver Certified building was designed by Clodagh Design International and features stunning interior finishes, landscape design by Mia Lehrer & Associates, and a host of luxury amenities including a rooftop pool, spa, lounge, and outdoor kitchen, a 24-hour attended lobby with concierge, a fitness center with yoga/pilates studio, pet spa, personal storage, gated subterranean parking, and more! Inside the unit, discover warm, inviting living spaces spanning 1,400 square-feet with 2-bedrooms and 2-bathrooms. An abundance of natural light and ocean breezes flow into the home t
Back on the market with an attractive price adjustment, $50K lower! Welcome to your dream coastal oasis! This charming small courtyard townhome has undergone a complete and exquisite remodel, offering an ideal blend of sophistication and beachside serenity. Nestled just 15 blocks from the sparkling shores, this residence boasts a prime location for those seeking a perfect balance between urban convenience and seaside tranquility. As you step through the front gate, you are greeted by a delightful courtyard that sets the tone for the entire property. Upon entering the townhome, you'll be greeted by an abundance of natural light that floods the space, creating a warm and inviting ambiance. Th
Revel in spectacular ocean views from this coastal gem within Santa Monica's coveted Ocean Park neighborhood west of Lincoln Blvd. Tucked along a wide, quiet residential street and set behind a gated courtyard, the two-story home spans 2,138 square-feet of light-filled living space. The inviting main level is supremely appointed for convenient everyday living and effortless entertaining, with a living room and separate family room that is open to the kitchen and dining area. The stylish kitchen has a view out to the backyard and features a center island, bright white cabinetry up to the ceiling, stone countertops, and stainless steel appliances. Also on the main level is a laundry room, ful
Welcome to a one-in-a-lifetime opportunity to bring your finishing touches and creative ideas to one of the rarest properties that you'll have a chance to experience. Designed by the world-renowned architects Saota & Woods+Dangaran, and constructed by Luxury Home Builder, Dugally Oberfeld, is this masterpiece of unique and thoughtful design. The property boasts over a flat acre of head-on ocean views, consisting of a combined six lots. You will be mesmerized by the views of the ocean, crashing waves, sand, and surrounding canyon. The location is superb, just a short distance from the beach and in close proximity to Palisades Village. The property will offer 8 bedrooms and 16 bathrooms
Welcome to 24 Sea Colony, an incredible opportunity to own one of the best units in this 24-hour guard gated complex. This rear three-level townhouse has great white water ocean views from most rooms and nice coastal views with incredible sunsets. Currently a blank canvas, this contemporary-style home allows a buyer to move in as-is or customize for one's taste, elevating the unit to the highest standards. The home features a spacious primary bedroom complete with a large walk-in closet and a sizable bathroom, positioned separately from the guest bedroom for maximum privacy. The beautiful living room, along with a separate den area that could serve as flex space, is flooded with natural lig
Experience the perfect blend of coastal living and urban convenience in this charming two-bedroom, one and a half bath condo just two blocks from vibrant Montana Avenue in Santa Monica. Situated only 16 blocks from the beach, this single level Spanish style condo offers easy access to the best of both worlds. Step inside to discover beautifully restored original hardwood floors, arched storybook windows and a classic clawfoot tub. While natural light and ocean breezes grace this unit, central a/c, updated lighting and in-unit washer/dryer will provide you with comfort year round. The condo is brimming with charm and is thoughtfully designed to offer a serene retreat. The back porch leads t
Enjoy the prestigious lifestyle in one of the most favorable beachfront locations living with ocean, Santa Monica pier, boardwalk, and mesmerizing views and sunset. It is located next to Santa Monica beach with activities all year around, parks, volleyball courts, walking and biking paths, grass areas for picnics and romantic strolls with breathtaking views and close proximity to high end shops and restaurants on Third Street Promenade and Ocean Ave. Spacious extensively fully remodeled with high end finishes with a great for entertaining floor plan, brand new double pane windows and sliding doors, living and dining area with updated handsome wood flooring & a large balcony with views
Welcome to your new home, nestled in the heart of Santa Monica. Unique to condo living, this 2-story space has four nicely sized bedrooms and two full bathrooms across almost 1,200 square foot. The upstairs hosts three bedrooms and the fourth bedroom, located downstairs, would be perfect as a home office, home gym or guest room. The sunlit living room transitions smoothly into the galley kitchen, a combination of modern function and sleek aesthetics with nearly 2 story tall ceilings. Located on a tree lined corner lot in a residential area, this home has been attentively maintained and cherished, manifesting in its overall durability and appeal. Of special note are the two tandem parking sp
A unique opportunity to own this beautiful home. Locate just a few properties from the ocean. A short distance from the pier, shops, and restaurants. The home has 3 bedrooms, every bedroom has its own private bathroom, and a half bathroom. A room to keep your favorite wine. A deck-patio with an ocean view. Remodeled kitchen features hardwood flooring and granite counter top with granite back-splash. Stainless steel appliances, built-in Sub-Zero refrigerator/freezer. Custom hardwood cabinetry and recessed lighting. City of Santa Monica designate this property as a city Landmark.
Experience coastal luxury at 222 7th Street, where this 3 Bed, 2.5 Bath top floor corner unit epitomizes Santa Monica living at its finest. Nestled in the highly coveted North of Montana neighborhood, this residence seamlessly blends comfort and elegance. The spacious layout features a sunlit living room opening to a private patio with lush views over San Vicente Boulevard. Bright kitchen opens up to large dining area with corner windows overlooking the mature palm and pine trees lining the property. The layout is perfect for both entertaining and relaxing, with ample space for guests to enjoy. Tucked away from the rest of the unit, the primary bedroom makes for an ideal retreat, with large
Don't miss this rare top-floor, west facing, Ocean Park beach pad with lots of natural light, just blocks to hip Main Street shops, restaurants, cafes and Santa Monica beach . This property features an updated kitchen, updated bathroom, open floor plan and long west facing covered patio facing the park with peak-a-boo ocean and mountain views. The primary bedroom has an oversized closet. Enjoy the ocean breezes while sipping coffee in the morning, or opt for a beautiful sunset while having an evening cocktail. The unit is uniquely positioned where you can keep your front door open, while remaining private and creating amazing airflow. The complex features a community gym, pool, bike storage
Welcome to this fully updated residence, a sanctuary of bespoke elegance and comfort. From its custom finishes to its expansive yard, every detail of this 2 bedroom 2 bathroom Main House, and a separate Guest House, has been curated to offer a unique indoor-outdoor experience. Beautiful white oak floors lead you into the heart of the home where an abundance of natural light fills the spaces with warmth and serenity. Designed with entertaining in mind, the open kitchen is a culinary masterpiece, boasting custom cabinetry, and luxurious finishes that exude sophistication. With its expansive windows overlooking the beautiful gardens, the primary suite is a sanctuary of serenity, inviting you t
Gorgeous condo in one of Santa Monica's most desirable areas. Light, bright & spacious, this one bedroom, one bath unit was taken down to the studs several years ago and completely re-imagined. Features include: open spacious floor plan w/ an amazing patio off the living room, stainless steel appliances, granite countertops, bamboo wood floors, central heat & air, large closets, recessed lighting, in-unit laundry, community roof deck w/ views for miles & a gated and secured building w/ gated subterranean parking. All this just moments from the beach and in close proximity to the best shops & restaurants on Montana Ave. , the Santa Monica Pier and Third Street Promena
Price Reduced by $750,000 100% Vacant—The property was vacated utilizing the Ellis Act guidelines in 2019, providing new ownership multiple investment strategies. Potential Redevelopment Site— 210 California provides a wide range of investment strategies for new owners, including renovating the current building or redeveloping the site. Santa Monica, which was granted a prohousing designation by the Governor in February of this year, has made its development process more efficient. This allows for the possibility of receiving additional funding and faster approval for new housing developments. Walkable, Vibrant and Highly Amenitized Neighborhood— Santa Monica offers a pic
In 1948, the Sun & Sea Motel was built nestled at the base of the iconic Santa Monica Pier. Today, you have the extraordinary opportunity to purchase 1661 Appian Way. This beachside oasis offers 12 units, each with breathtaking ocean and pier views, plus 8 private garages and extra spaces, ensuring convenient parking for residents. The building has an expansive, zen backyard that includes areas for sun lounging and al fresco dining, perfect for savoring warm coastal evenings. Originally constructed in 1948 as 6 apartments and 6 guest rooms, public records indicate the Land Use as "Motel" and County Use as "Motel Under 50 Units". Prospective buyers are encouraged to
On a rear flag lot, this property comprises four units, each featuring one bedroom and one bathroom. Two units are 500 square feet, while the other two are slightly larger at 625 square feet. All units are updated and equipped with hardwood floors, separate bedrooms and kitchens, washer and dryers in unit. Parking is provided with four garages and one carport on-site. Three garages and the carport are rented separately for extra income. Street parking is ample. ADU Plans are underway to convert the garages into an additional unit. Please note, the front parcel is NOT included in the sale. Unit A is vacant and may be shown by request Please drive by only, do not disturb tenants.
$2,000,000 ASSUMABLE LOAN. 4% interest only until 2029 for qualified buyer (private 3rd party lender) . Two blocks from Snapchat. Very well maintained building with character. 6 charming, one bedroom units located on quiet tree-lined street in Sunset Park. Backs to single family residential. All units have patios. Front unit has patio with fireplace. Certain units have been nicely upgraded with stone counters, stainless appliances and some, if not all, with in-unit laundry. Garage income of approximately $1,150/month from offsite renters (included in gross rent subject to verification). 5 total one car garages for possible future ADU conversion. Very close proximity to trendy eateries and o
Nestled in the sought-after enclave of Rustic Canyon, this architectural gem was artfully crafted by acclaimed architect Michael Kovac. The home embodies completely custom, timeless design ensuring quality in every corner. Step inside to discover a formal yet relaxed living room effortlessly flowing to an additional open-concept living and dining space. Artistically framed floor-to-ceiling windows flood the rooms with natural light complimenting the warmth and richness of the hardwood accents while allowing the polished cement floors, and Boffi kitchen with Gaggenau appliances, to add a touch of modern sophistication. Ascend the exquisitely designed staircase to reveal a luxurious primary s
Behold, a rare haven in the heart of sun-soaked Santa Monica! This two-level, 3-bed, 2.5-bath townhome, nestled in the coveted prime corner spot of the impressive luxury Woods community, asserts its presence with unmatched grace. Step inside to discover a harmonious blend of modern elegance and timeless charm. You'll be greeted by an inviting living area, a large fully equipped kitchen featuring Alder wood custom cabinets, complete with pull out pantry, a grand dining room, and your own private patio where ocean breezes mingle with sunny skies. Custom shutters, dimmable recessed lighting, a laundry closet with a newer washer/dryer, and hardwood-look tile flooring add an ambiance of modern a
First time on the market for this quintessential Sunset Park bungalow, built in 1941 and lovingly preserved. With Ocean view potential from a second story or roof top deck, you may chose to build a new home or expand on the existing. In the meantime this could be a great starter home, downsizing home or condo alternative, offering plenty of storage space for a modestly sized 2 bedroom 1 bathroom home and a generously sized lot with room to grow! There is potential to convert the existing garage into and ADU, or build a separate ADU on the property, the possibilities are endless. Original features such as the wainscoting, wood paneled closet doors and original floors add to the charm of thi
Exceptional opportunity in the coveted Santa Monica location! This incredible gem is on the market for the first time in 50+ years - perfect for owners/users, developers, and investors alike - bring your vision to create the home of your dreams! Situated on a sprawling 8,300 sqft corner lot, this quintessential home w/ a detached rec room offers you incredible potential and a canvas of possibilities. Tucked in on a beautiful treelined street, this cheery jewel box is wrapped in mature greenery and exudes original charm, details, and a light-infused space. Featuring 3 Bdrms/2 Baths in the primary residence and a spacious detached rec room w/ a loft that offers added comfort and versatility,
This area's enrollment policy is not based solely on geography. Please check the school district website for more information.
Elementary schools
Middle schools
High schools
GreatSchools Summary Rating
9/10
Edison Elementary School
Public, K-5
9/10
Grant Elementary School
Public, K-5
8/10
Franklin Elementary School
Public, K-5
8/10
McKinley Elementary School
Public, K-5
8/10
Roosevelt Elementary School
Public, K-5
Only showing 5 of
16 elementary schools.
School data is provided by GreatSchools, a nonprofit organization. Redfin recommends buyers and renters use GreatSchools information and ratings as a first step, and conduct their own investigation to determine their desired schools or school districts, including by contacting and visiting the schools themselves.Redfin does not endorse or guarantee this information. School service boundaries are intended to be used as a reference only; they may change and are not guaranteed to be accurate. To verify school enrollment eligibility, contact the school district directly.
Homes for sale in Santa Monica have a median listing price of $2.15M. Some of these homes are Hot Homes, meaning they're likely to sell quickly.
What are some of the most popular neighborhoods in Santa Monica?
Popular neighborhoods include Pacific Palisades, Brentwood, Westside LA, Mar Vista, Rustic Canyon, Venice, Ocean Park, Venice Beach, North of Montana, and Sawtelle.
Santa Monica, California boasts a robust transportation system with numerous options for residents. The city is served by the Big Blue Bus public transportation system, providing convenient access to various parts of the city. However, traffic levels can be high, particularly during peak hours, making driving a car a potentially time-consuming endeavor. For those preferring to drive, Santa Monica is conveniently located near several major highways and freeways, including the Pacific Coast Highway and the Santa Monica Freeway. Learn more on our Santa Monica city guide.
What types of properties are available in Santa Monica?
Santa Monica, California offers a variety of single-family home types, including ranch-style homes, contemporary homes, and modern homes with sleek designs and open floor plans. These homes can be found throughout the city, from the tree-lined streets of the North of Montana neighborhood to the vibrant Ocean Park area. Most properties feature 3-5 bedrooms and were built in the 1950s to present day. To explore different property types for sale in Santa Monica, California, use the 'Home type' filter located above the active listings. Customize your search by selecting options like single-family homes, condos, townhomes, and more.
What is life like in Santa Monica?
Living in Santa Monica, California offers a unique experience with its beautiful coastal landscape. The city enjoys a pleasant Mediterranean climate with mild winters and warm summers. Job opportunities in Santa Monica are abundant, particularly in the tech and entertainment industries. Residents can enjoy a variety of activities, including outdoor sports, cultural events, and a vibrant nightlife. The city also offers a range of dining options, shopping districts, and access to nearby parks and beaches.
What are the schools and amenities like in Santa Monica?
Santa Monica, California, boasts a wealth of public amenities for all residents to enjoy. This vibrant city is home to an array of restaurants, offering a diverse selection of cuisines to satisfy any palate. Numerous parks are scattered throughout the city, providing open spaces for relaxation and recreation. Grocery stores are conveniently located across Santa Monica, ensuring residents have easy access to daily necessities. Additionally, Santa Monica offers a variety of other amenities such as fitness centers, libraries, and shopping centers, making it a dynamic place to live.
In the past month, 40 homes have been sold in Santa Monica. In addition to houses in Santa Monica, there were also 114 condos, 31 townhouses, and 19 multi-family units for sale in Santa Monica last month. Santa Monica is a fairly walkable city in Los Angeles County with a Walk Score of 83. Santa Monica is home to approximately 89,618 people and 80,311 jobs. Find your dream home in Santa Monica using the tools above. Use filters to narrow your search by price, square feet, beds, and baths to find homes that fit your criteria. Our top-rated real estate agents in Santa Monica are local experts and are ready to answer your questions about properties, neighborhoods, schools, and the newest listings for sale in Santa Monica. Our Santa Monica real estate stats and trends will give you more information about home buying and selling trends in Santa Monica. If you're looking to sell your home in the Santa Monica area, our listing agents can help you get the best price. Redfin is redefining real estate and the home buying process in Santa Monica with industry-leading technology, full-service agents, and lower fees that provide a better value for Redfin buyers and sellers.


 REDFIN IS COMMITTED TO AND ABIDES BY THE FAIR HOUSING ACT AND EQUAL OPPORTUNITY ACT. READ REDFIN'S FAIR HOUSING POLICY AND THE NEW YORK STATE FAIR HOUSING NOTICE.
 United States
 Canada