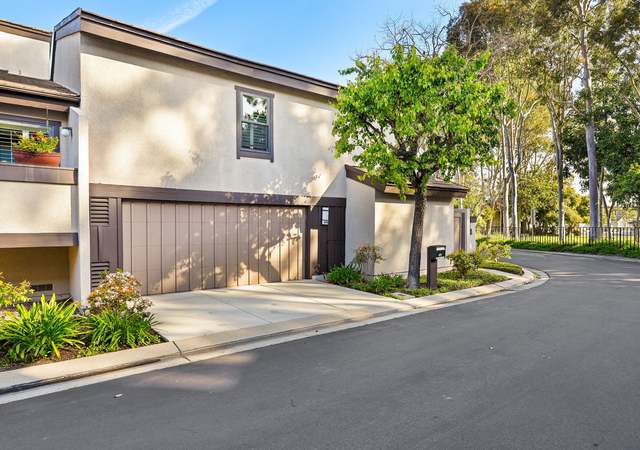
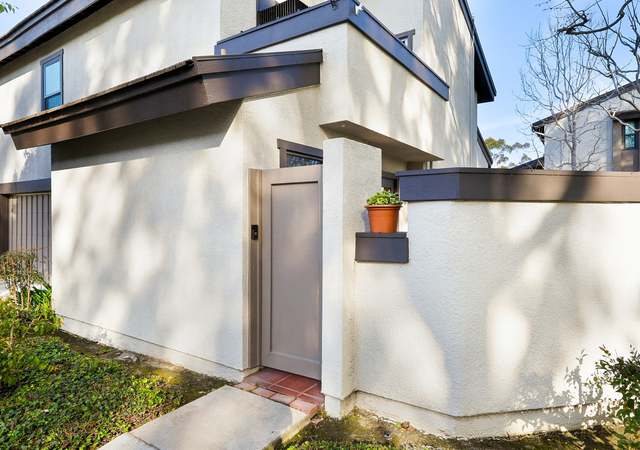
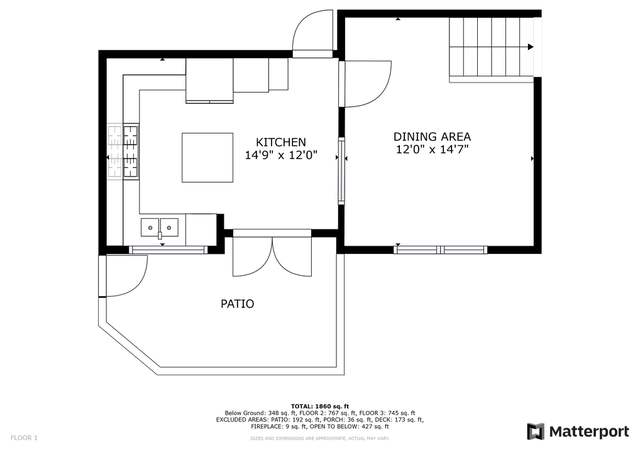
Don't miss out on this charming 2 bedroom, 2 bathroom tri-level condo nestled in the desirable community of Old Ranch Townhomes. Situated away from main roads, this interior end unit offers serene living with only 1 shared wall. The first level welcomes you with a spacious two-car garage featuring laundry. Step into the kitchen, complete with a convenient butcher block island and a window above the sink. French doors lead to the side patio with access to the interior road. Adjacent is the dining area, providing tranquil views of the park through its windows. On the second level, you'll find the heart of the home. The inviting living room boasts a built-in fireplace, soaring ceilings, and a
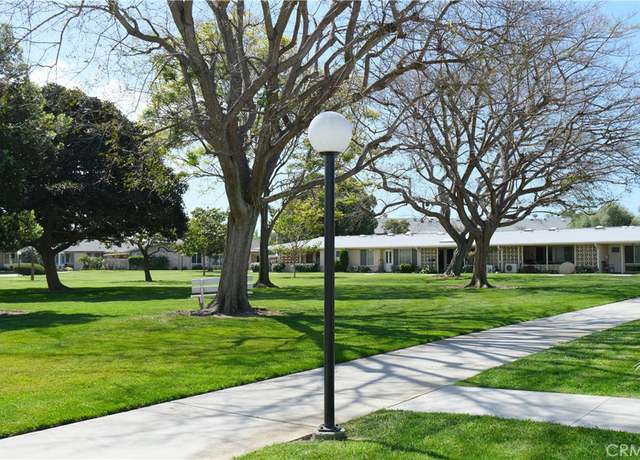
Come and see this lovely house that will become your new home in Seal Beach Leisure World. ~ Mutual 16-51H. . It is located on a beautiful greenbelt with trees and a view ~ 1 bedroom, 1 bath ~ Light & bright and move-in ready with some great features: openable skylights in kithcen and bathroom for more light and air, carpet in livingroom and bedroom, laminate flooring in kitchen and bathroom. The bedroom has a mirrored wardrobe closet and white vinyl custom sliding glass door, leading out to the patio, where you can enjoy the evening sunsets and beach breezes. The livingroom has white vinyl custom windows and oval leaded glass entry door. The kitchen includes a Leisure World laminate
1/34
$255,000
1 bed1 bath609 sq ft
13140 Del Monte Dr Unit 51H M16, Seal Beach, CA 90740
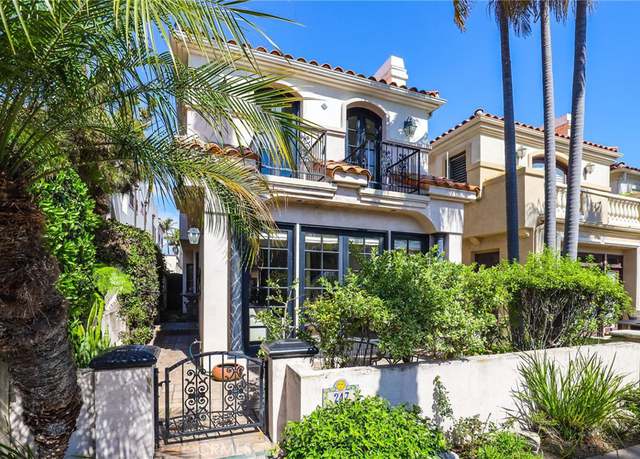
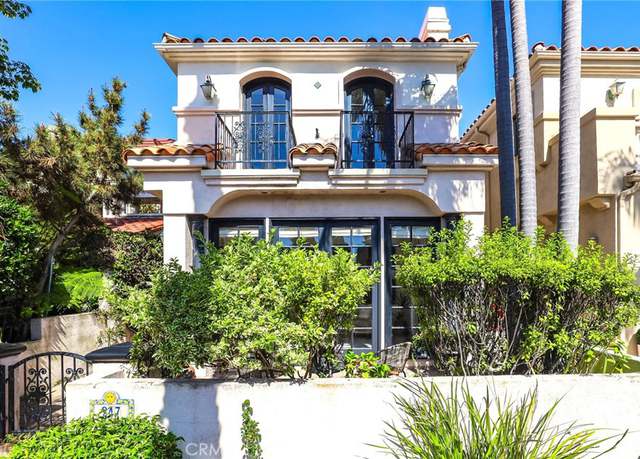
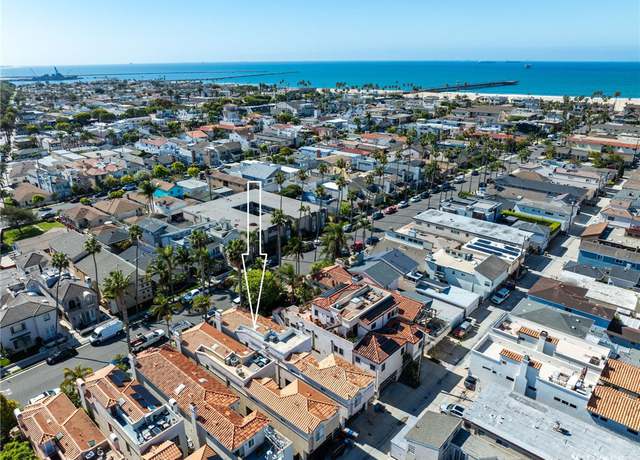
Coastal living at its finest…. Beach cruisers, Lemonade stands, Ocean breezes and the wonderful sounds of laughter from your friends and family as you enjoy the Seal Beach lifestyle. Step in this spacious Mediterranean style 2 story home. Located just one block from the sandy shores of the Pacific Ocean and Situated on one if the finest streets in Old Town, renowned for its wider expanse and serene ambiance. Presenting a canvas primed for personalization, awaiting the discerning touch of its new owner. Comprised of four bedrooms and three-and-a-half baths, Family room, office area and roof top deck. This residence blends timeless charm with an outstanding location. Step into the marb
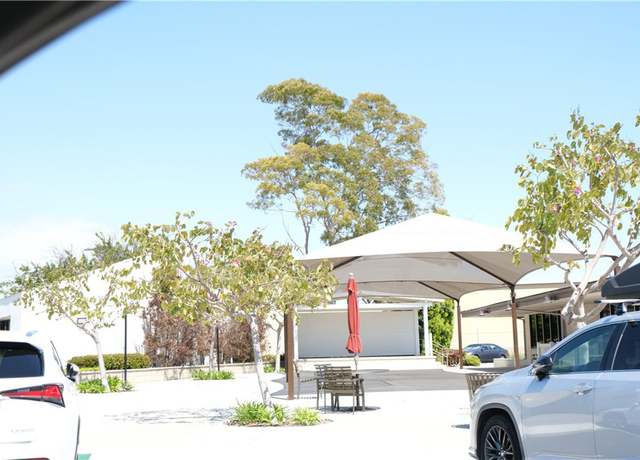
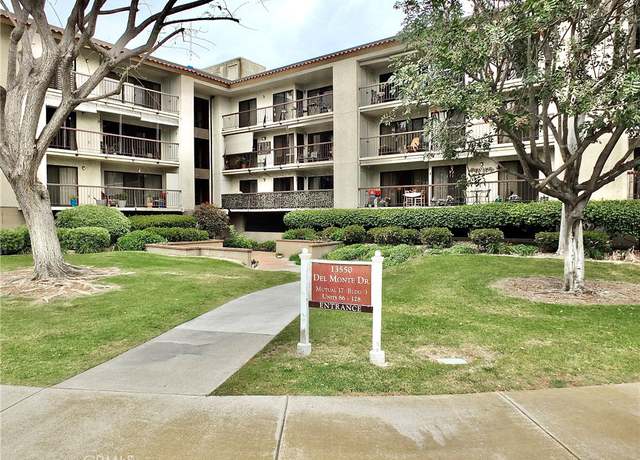
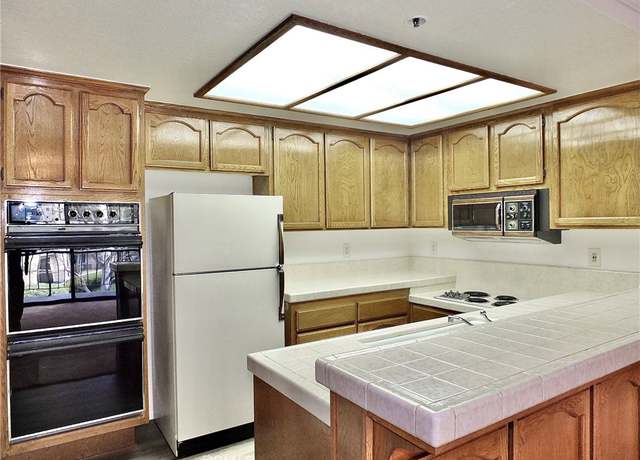
This captivating end-unit condo in Mutual 17 at Leisure World with great views of the greenbelt, located on the 2nd floor, features 2 bedrooms and 2 baths and is ready for you to move in. This freshly painted and newly carpeted, the living space is bright and airy, with scenic views of the greenbelt areas from the living room and both bedrooms, each with ample closet space. The all-electric kitchen is well-equipped with a spacious pantry, double ovens, and an electric cooktop. As a resident, you'll have access to an array of amenities, including a par 3 golf course, swimming pool and spa, state of the art gym, BBQ and picnic areas, clubhouse, and more. Leisure World is a 55+Senior community
1/30
$450,000
2 beds2 baths986 sq ft
13550 Del Monte Dr Unit B111, Seal Beach, CA 90740
Mutual 14 29F (Carport Building 155 Space 2). Must see! The unit is fully extended, 2 bedrooms, 1 and half bathroom. Beautiful, light and bright. Located at quiet, neat neighborhood, near main gate, conveneint area and in a desirable mutual location. 5 skylights, The living room has been expanded for large gathering area with a skylight and the dedicate dining room with a skylight. kitchen features a large skylight, combo washer/dryer for your conveinience, with door to be closed. Parquet flooring throughout, excluding kitchen and bath. Recessed lights on living room and kitchen. Half bathroom is in the 2nd bedroom. Expanded master bedroom has a large walk in closet. Wood blinds to be separ
1/19
$445,000
2 beds1.5 baths1,150 sq ft
1870 Sunningdale Rd Unit 29F, Seal Beach, CA 90740
Rare 6 unit apartment building with separate individual patios, laundry room, 5 parking spaces in rear of building with alley access (each unit except studio gets one parking space). Located on one of the prime locations in Seal Beach--across the street from parks, a few blocks to beach and Main Street shopping, Dining and Seal Beach Pier. Surrounded by custom homes provides the tenants in this building with high end Seal Beach living. Separate meters for the apartments with all remodeled units with laminated flooring, newer paint, kitchens opened up to living rooms, with tenants staying long terms. Long terms pride of ownership and condition makes this worth considering.
Mutual 11-284E is a partially expanded unit with drive-up convenience, west facing. The unit features a custom entry door into the high side expansion, all newer windows, sliders from to living room and from the bedroom to the patio. 5 skylights, kitchen, bath, dining room and two on the patio. Carpet in the LVR and BDRs, vinyl in the kitchen and bah and hardwood tiles in the dining room/expansion. The bathroom has a walk-in shower and a hi-boy toilet. There is a large storage closet on the patio. There is a wall A/C in the expansion. Parking is in Bldg 133 space 26:. .. .. .Leisure World is a 55+ Senior community. Resort like, guard Gated with lots of free amenities, par 3 golf, pool, stat
$350,000
2 beds1 bath950 sq ft
12141 Del Monte Dr Unit 284E M11, Seal Beach, CA 90740
Nestled between Seal Beach and Sunset Beach, Surfside is an exclusive gated community in Orange County renowned for its luxurious coastal living. The historic Surfside Colony features an array of properties, from quaint older single-story cottages to striking modern multi-level homes, each just a short stroll from the beach. The community also offers amenities like its own post office, a charming library, and a children's play area. 55 B Surfside Ave spans 2,077 square feet and features four bedrooms and four bathrooms distributed over three meticulously designed levels, each offering views of the ocean. The renovated ground floor includes a cozy living room with a fireplace and skylights,
PERFECT LOCATION! DUAL PANE WINDOWS, HEAT PUMP, VINYL PLANK FLOORS, SKYLIGHTS, AND A VIEW OF THE GORGEOUS GREENBELT! This unit has lots of upgrades and is one you do not want to miss! Located in Mutual 1, this unit faces North/West and overlooks a huge greenbelt with lots of mature trees. As you walk up to the unit there is a cute little white gate allowing you privacy on your patio, and a small garden expertly maintained with succulents. The patio itself was re-poured a few years ago, and looks great! There is also a huge storage unit with shelving, perfect for storing your gardening tools and whatnot. The front door features a phantom screen that retracts so you can allow the beautiful br
$255,500
1 bed1 bath600 sq ft
13730 Annandale Unit 31H - M1, Seal Beach, CA 90740
(Mutual 8-182-H) One bedroom on a pretty spot with close parking and laundry! New paint, freshly cleaned carpet, covered patio to enjoy! Heat-pump and a cut-down shower and added storage on the patio. This good feel unit is waiting for you to make it your own with all of your added touches. Just out the door and to the right is a beautiful green to take a stroll and enjoy this fabulous community. Leisure World Seal Beach is a 55+ Resort Style Community with over 200 clubs and activities that include FREE GOLF, FREE POOL/SPA, FREE GYM and so much more! On assigned carport in Building #101; Space #2
$229,000
1 bed1 bath560 sq ft
13221 N Fairfield Ln Unit 182-H, Seal Beach, CA 90740
(Mutual 4-46-F) Catch the wonderful ocean breeze! Expanded two bedroom CORNER nestled nicely between a green/courtyard to the front and a pretty greenbelt area to the side! Just the right amount of interior space has been added giving the unit that open feel - with plenty of room to entertain, and a covered patio to enjoy your surroundings. The master bedroom has been converted to an office with built-in work station and a slider out to the patio. Rich looking floors, dual pane windows/sliders, cedar-lined closet in the office/bedroom, cut-down shower, breakfast bar, central heat/air, and a stackable washer/dryer. Leisure World Seal Beach is a 55+ Resort Style Community with over 200 Club
Welcome home to 4357 Elder Avenue in beautiful College Park East, Seal Beach. This meticulous 4 bed/2bath Princeton model S & S home, is a single level pool home & boasts 1,914 sq ft of living space with a open floor plan & amenities including: sparkling pool w/ spa and fire pit, engineered hardwood flooring, tile flooring, crown moulding, modern baseboards, freshly painted interior, recessed lighting, ceiling fans, smooth ceilings, central AC & heating, & updated fireplace in living room. The exterior has vinyl siding & boxed eaves. The remodeled modern kitchen has double oven, potfiller over stove, newer stainless steel appliances. With a center of tract l
Expanded one bedroom in Mutual 8. Through the bedroom or from the patio you will enter the expansion which could be used as an office, craft room, or extra space. The kitchen has a skylight and a ceiling fan, The bathroom has tiled bath and floor. Double pane windows and solid core entry door. This home has easy drive up parking for convenient unloading groceries. Also small garden and green belt as well as cinder-block wall for privacy. Recent new paint throughout the home.
$275,000
1 bed1 bath698 sq ft
13341 N Fairfield Ln Unit 181H, Seal Beach, CA 90740
Rare 3rd floor penthouse condo in Seal Beach! Very quiet location, Completely remodeled, this sophisticated unit with the largest floor plan in the building has Two bedrooms, two baths; large living room with balcony; formal dining room; large master bedroom with an ensuite bathroom with tub and shower; 2nd bath has walk-in shower; central air/heat; Tons of storage space with two outside storage closets, large closet by living room and large closet downstairs by your assigned space in the subterranean parking. Great location next to to free 5 washer/dryer laundry room. (Mutual 17, unit 37C) Located in Leisure World 55+ community in Seal Beach, California
CHARMING fully expanded 1 bedroom, 1 bath unit with built-out patio on greenbelt. Looking for the most space allowable for a 1 bedroom then you have found it. Brand new luxury laminate floors throughout. Unit has just been freshly painted with brand new pulls on all cabinets. 2 large expanded skylights with custom exposed beams plus and additional 2 skylights (total of 4 skylights) for tons of natural light. Plantation shutters, cut down shower, mutual appliances and AC heat pump. Master suite has been expanded and includes a large walk-in closet. Quite greenbelt area. (CARPORT 57, SPACE 61) SENIOR COMMUNITY-OFFERS THE FOLLOWING AMENITIES: 9 Hole Golf Course, Swimming Pool, Jacuzzi, Gym, T
Gorgeous pool lot home located in a sought after area in Seal Beach, College Park Community. This is the perfect family home for entertaining family and friends. Features are 4 bedrooms, 1 room converted into a 5th bedroom, large kitchen, with granite countertops, hardwood and tile flooring throughout, custom ceiling fixtures, recessed lighting, large family room, 3 fireplaces, French doors leads out to the patio where you see the pool/spa and nice yard with privacy.
The only 3 Bedroom, 2 Bed/Office unit on the market in Leisure World. Dive into the coastal lifestyle of Seal Beach's Leisure World (55+ Community). This meticulously maintained, fully remodeled and new appliances which is located on the most desirable South East facing corner, offering the ideal mix of comfort and convenience. Revel in resort-style amenities like golf, swimming, and fitness facilities, while nearby shops and dining add to the daily groove. Serene outdoor spaces and 24-hour security, close parking, this dreamy simple living promises worry-free living. Let the good times roll and schedule your showing before you miss out again.
$579,000
2 beds1 bath1,100 sq ft
13280 St. Andrews Unit 256-A, Seal Beach, CA 90740
(Mutual 12, Unit 65B, Carport 135, Space 8) Welcome to Leisure World Seal Beach is a seaside community!!! This 55 yr or older community has it all. All units in this building are corners overlooking a beautiful greenbelt, steps to your carport. The unit features many deluxe custom features such as two built-in desks and bookcases. The wood give gives the home a homey feel Wood flooring, dishwasher, built-in microwave, large skylights, 3 bay windows, plantation shutters. The main bedroom features a large walk-in closet plus lots of storage and closet space through out the home facing east getting morning sun. The community has buses to take you shopping, amphitheater, post office, health
(M4-86E) (Crpt 55, Sp. 02) One bedroom unit with enclosed patio area. 1 year new carpet, paint, split system AC. drapery, Close to parking and carport. Patio has walk-in storage room. Original cabinets, heat pump, Formica countertops, carpet and vinyl flooring. Mutual 4 is the only Mutual with possibility to add electrical car charger. SENIOR COMMUNITY OFFERS THE FOLLOWING AMENITIES: 9 Hole Golf Course, Swimming Pool, Jacuzzi, Gym, Table Tennis, Shuffleboard, Billiards, Pickle Ball and Bocce Ball courts. Amphitheater, 6 Club houses featuring: Exercise Gym, Art Room, Sewing, Crafts, Woodshops, Lapidary, Pool tables; Over 200 Clubs, LWSB is a Security-Guard-Gated Community. Also, Library, Fri
Charming and well loved is the best description of this home! From the designer paint colors to the updated vinyl plank flooring, the tiled kitchen and bathroom flooring plus the fabulous carpeting in one of the bedrooms. .. this home has style, class and personality! A brand new heat pump was installed in the past year, keeping you cool in the summer and warm in the winter! The water heater was replaced approximately 1 year ago by a larger tank, also a dishwasher was added during that time. In addition a beautiful glass doored cabinet was added in the kitchen, with a light to display some of your favorite things! This home has beautiful shutters on all of the windows, allowing as much priv
$369,000
2 beds1 bath718 sq ft
13400 El Dorado Dr Unit 198H, Seal Beach, CA 90740
Highly Coveted remodeled CORNER unit condo in the prestigious community of Portofino Cove in Huntington Harbour. with a private 45’ x 16’ boat slip, (#A-6 will accommodate a 50 ft yacht). With 2 bedrooms and 2 bathrooms, this model is one of the largest floor plans with 1243 feet of living space. This stunning property has been impressively renovated with upgrades including: laminate vinyl waterproof flooring, fresh paint throughout, recessed lighting, new slider doors, double pane windows, quartz countertops in kitchen, soft closing kitchen cabinets, recently installed microwave and stove, completely remodeled bathrooms with light up mirrors, upgraded shower/bath with backsplas
$1,390,000
2 beds2 baths1,243 sq ft
16291 Countess Dr #117, Huntington Beach, CA 92649
Welcome to this beautiful expanded Corner Unit in Mutual 5 with great curb appeal, front patio with seating area, lots of privacy and gorgeous greenbelt views from all around the home! This spacious and light filled 2 bedroom, 1 bath home features a quiet location with nearby drive up parking in addition to the nearby carport parking space. The home has everything you will need, including spacious kitchen with microwave, dishwasher, skylight and additional countertop facing the living room, large living room, separate dining room, Vinyl dual pane windows, Central Air/Heat, Plantation Shutters, Washer/Dryer, Storage Closet in the entry and Phantom retractable screen front door screen to enjo
(M12-11A)(Carport bldg 140-Space 8) East facing luxury corner home in an upscale area near the golf course with opportunity to add a patio with board approval! Enjoy upgraded appliances and lighting and a washer and dryer in this 2 bedroom 2 bath fully expanded gem. Kitchen boasts custom cabinets with features like Lazy Susan, island with pull-out hidden trash bins, added storage and broom closet. Thoughtfully placed pocket door in kitchen separates living area from main bedroom and bathroom. Dining room with fabulous chandelier is right next to the kitchen. Both bathrooms have added linen closets. Main bath has a step-in shower, 2nd bathroom has a tub/shower. Freshly painted with rich lo
$615,000
2 beds2 baths1,125 sq ft
1701 Tam Oshanter Rd., M12-11A, Seal Beach, CA 90740
Brand new custom built house in idyllic Seal Beach just steps away from the beach and only 4 blocks from the pier and Main Street shops, restaurants, etc. This newly constructed, never lived in four bedroom, four and one-half bath home was built by local luxury contractor, Jim Haskett, Construction. The modern coastal home features a sought after downstairs en-suite bedroom, elevator, tongue and groove ceilings, commercial grade Thermador appliances, La Cantina bi-folding doors, and many more high-end finishes. Enjoy beautiful Seal Beach to Catalina Island views from the rooftop deck or relax outside on the pretty paver lined front patio.
(M9-228J)(Carport building 109, Space 22) Move-in ready, east facing home has all new paint, cabinet hinges and hardware, and new waterproof vinyl plank flooring. Enjoy upgrades like heat/air conditioning at the touch of a remote in living room and dual pane windows, including a sliding door in the main bedroom. Storage room on patio with light. Tile on front patio, indoor outdoor carpeting on gated patio section near front door. Upgraded front door has a nice screen door on it. Step-in shower with seat. Wonderful private location across from landscaped wall provides a beautiful view from all rooms. Skylights in kitchen and bathroom open. Double skylight on patio near front door. High boy t
Slice of Heaven end unit on Central Park of M-7 with expansion build out with every amenity; central air/heat, washer/dryer, upgraded kitchen appliances w/ granite counter tops, 3/4 guest bathroom, office area, plantation shudders, dual pain windows, sky lights, walk-in closet, smooth ceilings, upgrades to master bathroom and shower. Unit ideally faces South West Sunshine and North West shade. Carport #31
Great 2-bedroom unit with a large wraparound patio in desirable Mutual 7. The unit has new carpet and has been recently painted. Central heat and air. Double pane windows with vertical blinds. Granite countertops and skylights in both the kitchen and bathroom. Organizations, groups and activities in this gated community leave little to be desired. The community includes a gym, pool, golf, pickle ball, billiards and crafts etc. It provides a post office, health care center and so much more. The community is freeway close and only 1.5 miles to Seal Beach shopping and dining, Belmont Shore activities and the local beach is within 2 miles.
$350,000
2 beds1 bath750 sq ft
1260 Northwood Rd Unit 164 I, Seal Beach, CA 90740
Awesome Mutual 9 Location. Leisure World is a 55+ Senior Gated Community, Pool, 3 Par Golf, Amphitheater, 200 Clubs, Billiards Room, Multiple Clubhouses, Pickleball, Library, RV Parking, Medical Facilities and Pharmacy. Local Transportation, 1.5 miles to the beach. Close to great restaurants and shopping. Includes a carport space and additional parking.
Come home to this lovely West facing fully expanded 1 bedroom 1 bath unit! At the front door, there is a golf cart pad with a exterior electrical outlet for easy charging. The double paned tinted vinyl windows with plantation shutters bring the light in and look onto the large greenbelt. Once you enter, you notice the smooth ceilings, living room recessed lighting and crown and base molding, along with the newly installed high-end laminate flooring throughout. You'll see the living room and bedroom have in-wall wiring to mount flat screen TV's. The counter to cabinet ceramic backsplash and quartz counter top draw you to the kitchen which is filled with light from the skylight which has moi
Enjoy this lovely expanded two-bedroom, one-bathroom, formal dining room home. This home has been newly painted throughout and features a spacious living room with double pane windows, heat pump, and is adjacent to the formal dining room which has a convenient entry closet for additional storage. The kitchen has Leisure World appliances including a built-in stove, oven, refrigerator, and has a skylight and ceiling fan. The main bedroom has double pane sliding glass doors that lead to the front patio. The bathroom has a skylight and cut down shower for walk-in convenience. The second room has a Murphy bed and built in wall unit. The living room, dining room, and both bedrooms are carpeted. T
Enjoy the Harbour resort-life style living year round in this stunning contemporary off-water home in the highly sought after SeaBridge gated community. This Sun kissed home is on a larger corner lot with mountain & water views from one of the three decks. Easy access to the ocean & main channel. Move in Ready. All bathrooms have been tastefully updated. Great use of ceiling fans in all three bedrooms & living room. You will love how light & bright this two story home is. Great open floor plan for entertaining. The kitchen has been completely remodeled, including Gas Stove. Beautiful engineered wood flooring, recessed lighting, great use of granite. Stacked brick fir
This spacious 2 bedroom/1 bath home is centrally located in Leisure World in one of the best Mutual “12” with its greenbelts and well-manicured landscaping! This extended model provides the perfect space for downsizing and enjoying retirement. Enter your new home through a private sitting covered porch with custom designed brick, a beautiful custom wood entry door with side panels and etched glass, and retractable screen to let in the ocean breezes. The unit is light and bright, with Dual Pane windows, and skylights for additional natural light. Your open floor plan boasts light wood-toned laminate flooring throughout, custom window coverings and a Central Heat/Air System. Kitch
$395,000
2 beds1 bath1,100 sq ft
1560 Interlachen Rd Unit 66I, Seal Beach, CA 90740
Welcome to Mutual 9 Oak Hills Drive, which is located right off of Northwood Rd! This one-bedroom one-bathroom unit features gorgeous brown wooden cabinets in the kitchen. The bathroom is pristine and has an upgraded walk-in shower. The bedroom has sliding white wooden closet doors and a sliding door entry to the patio. Kary's Carpet installed the outdoor blue patio carpet. The custom-made roll-down shades surround the patio exterior, and there is massive storage available with two enclosed storage cabinets built into each side of the patio. In carport #8, you will find additional storage cabinets. The brown oven, white refrigerator, and white stove with smart burners are owned by M9 and av
$225,000
1 bed1 bath800 sq ft
13100 Oak Hills Dr Unit 231D, Seal Beach, CA 90740
(CARPORT 55, SPACE 27) Completely modernized and luxurious at every finish in this completely reimagined property in Mutual 4! Fantastic U-shape remodel with enlarged and inviting tile patio overlooking an expansive green belt. Step in through the custom entryway with bay window and custom light fixture accompanied by the fireplace with mantle. Step further to the living room and experience the light and bright feel with double-pane windows and sliding glass doors along with recessed lighting accompanied by the shiplap wall. From there you see the large luminous chef's kitchen with oversized skylight, quartz countertops, new dual tone cabinetry, all new stainless steel appliances, chic pend
Welcome to your dream home! This stunning property boasts top-of-the-line features and diligent upgrades throughout, ensuring luxury and comfort at every turn. Situated in the desirable neighborhood of Los Alamitos, this home offers the perfect blend of modern sophistication and timeless charm. Key Features:Neolith Countertops: Exquisite and durable surfaces that elevate the kitchen to a new level of elegance. Upgraded HVAC Ductwork: Enjoy optimal comfort and efficiency with all-new HVAC ductwork. Upgraded Electrical: Peace of mind and reliability ensured with a comprehensive electrical upgrade. New Roofing: Protection and longevity provided by brand-new roofing materials. New Water Heater:
This lovely expanded two bedroom one-and three-quarter bathroom home is light, bright, and ready to move in. The spacious living room has an adjoining formal dining area. An added room that adjoins the living room may serve as a den, office, or bonus room, and features a picture window in addition to double pane windows that overlook a lovely Greenbelt. The kitchen has built-in appliances including a stove top, oven, refrigerator and provides a tremendous amount of cupboard and counter space. The main bedroom suite has a separate closet, dressing area, full bathroom with shower, and double pane windows that overlook a Greenbelt with an abundance and variety of trees. The main bathroom has a
(Mutual 10-248-I) Sitting on a courtyard with beautiful trees and just steps away from an open greenbelt area is this lovely home! The living room and master bedroom have been expanded, newer paint, front door, and gorgeous laminate floors, dual pane windows, and smooth ceilings thru-out, cut-down shower, skylights and. .. new kitchen and bathroom countertops will be installed during escrow - you will have a choice of 3 colors to choose from! Plenty of storage with the huge walk-in closet in the master bedroom, a wardrobe closet in the 2nd bedroom, a storage cabinet on your private tiled side patio, and large cabinets in the carport area - you will have plenty of room for your treasures!
(Mutual 6 - 136I)(Carport building 81, space 16) Fully expanded two-bedroom, one bath unit in lovely spot; close to parking; close to laundry; COULD EASILY BE A THREE BEDROOM UNIT; Has brand new carpeting and in great location. This is a 55+ community with requirements to live here. All co-op units are cash purchase only and are subject to a pre-listing inspection that must be reviewed and approved and signed by both the seller and buyer of the unit. Listing information is deemed reliable, but not guaranteed by On-Site Home Sales or its agents. Any and all information that is important to the buyer should be verified by the buyer or buyer’s agent.
Home is located in the wonderful Leisure World Senior Living. It is fully livable at this time. The bed room needs new carpet and the seller will provide the buyer with $3,000 for flooring. The closet space is large and will make you happy. The bed room sliding door allows you access to the front porch. Leisure World provides many items for your benefit. Even golf. One owner must be 55 years old.
School data is provided by GreatSchools, a nonprofit organization. Redfin recommends buyers and renters use GreatSchools information and ratings as a first step, and conduct their own investigation to determine their desired schools or school districts, including by contacting and visiting the schools themselves.Redfin does not endorse or guarantee this information. School service boundaries are intended to be used as a reference only; they may change and are not guaranteed to be accurate. To verify school enrollment eligibility, contact the school district directly.
Homes for sale in Seal Beach have a median listing price of $429K. Some of these homes are Hot Homes, meaning they're likely to sell quickly.
What are some of the most popular neighborhoods in Seal Beach?
Popular neighborhoods include University Park Estates, Marina Pacifica, Peninsula, College Park East, Leisure World, Naples, Surfside, Naples Island, East End, and Huntington Harbour.
Seal Beach, California boasts a well-connected transportation network, making it convenient for residents to commute by car. The city experiences moderate traffic levels, ensuring a relatively smooth driving experience. Public transportation is available, with bus services providing connectivity within the city and to neighboring areas. Furthermore, Seal Beach is conveniently located near major highways and freeways, including the Pacific Coast Highway and Interstate 405, facilitating easy access for car travel. Learn more on our Seal Beach city guide.
What types of properties are available in Seal Beach?
Seal Beach, California offers a variety of single-family home types, including ranch-style homes, contemporary homes, and modern homes with open floor plans and ample natural light, all built between the 1950s and present day; you can find these different types of homes throughout the city, from the charming Old Town area to the more suburban neighborhoods near the coast and the Naval Weapons Station, providing a range of options for buyers looking for 2-5 bedroom homes built between the 1950s and present day; To explore different property types for sale in Seal Beach, California, use the 'Home type' filter located above the active listings. Customize your search by selecting options like single-family homes, condos, townhomes, and more.
What is life like in Seal Beach?
Seal Beach, California offers a unique coastal living experience with its picturesque landscape. The city boasts a pleasant Mediterranean climate, characterized by mild winters and warm summers. Job opportunities are abundant, with a thriving local economy that includes a variety of industries. Residents can enjoy a range of recreational activities, such as exploring the beautiful beaches, engaging in water sports, or taking leisurely walks along the charming streets. The city also offers a vibrant arts and culture scene, with numerous galleries and events to inspire and entertain.
What are the schools and amenities like in Seal Beach?
Seal Beach, California, offers a variety of public amenities for its residents. You can enjoy a meal at one of the many restaurants available in the area. For outdoor enthusiasts, there are numerous parks to explore and appreciate the natural beauty of the region. Daily necessities can be easily procured from the local grocery stores. Additionally, Seal Beach provides other amenities such as schools, libraries, and fitness centers for the convenience and enrichment of its residents.
In the past month, 33 homes have been sold in Seal Beach. In addition to houses in Seal Beach, there were also 114 condos, 3 townhouses, and 4 multi-family units for sale in Seal Beach last month. Seal Beach is a minimally walkable city in Orange County with a Walk Score of 41. Seal Beach is home to approximately 24,316 people and 9,386 jobs. Find your dream home in Seal Beach using the tools above. Use filters to narrow your search by price, square feet, beds, and baths to find homes that fit your criteria. Our top-rated real estate agents in Seal Beach are local experts and are ready to answer your questions about properties, neighborhoods, schools, and the newest listings for sale in Seal Beach. Our Seal Beach real estate stats and trends will give you more information about home buying and selling trends in Seal Beach. If you're looking to sell your home in the Seal Beach area, our listing agents can help you get the best price. Redfin is redefining real estate and the home buying process in Seal Beach with industry-leading technology, full-service agents, and lower fees that provide a better value for Redfin buyers and sellers.


 REDFIN IS COMMITTED TO AND ABIDES BY THE FAIR HOUSING ACT AND EQUAL OPPORTUNITY ACT. READ REDFIN'S FAIR HOUSING POLICY AND THE NEW YORK STATE FAIR HOUSING NOTICE.
 United States
 Canada