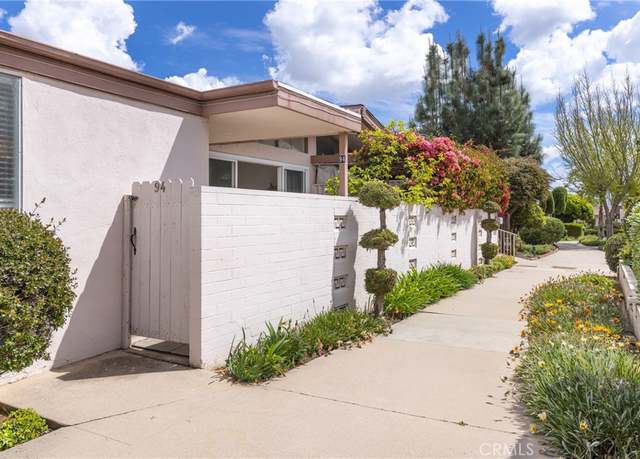
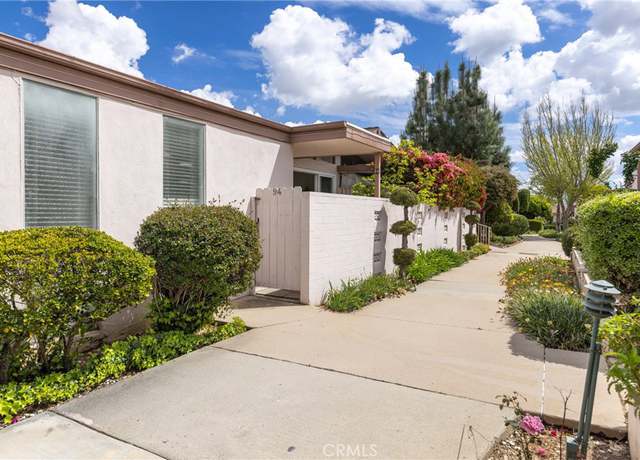
Experience the charm of this freshly updated, single-level condo nestled in the much sought-after Alhambra Village Green 55+ Community at the heart of Alhambra. Located off of Almansor Ave. closest to the detached garage, the unit is situated in the most convenient corner spot within the community. This tastefully updated, turnkey single-level home features two bedrooms and two full bathrooms, designed for seamless living with abundant natural light flowing from the sunlit patio into the spacious high ceiling living room. The immaculate complex features a beautiful landscaped community park, perfect for morning strolls, as well as a sparkling pool, jacuzzi, and clubhouse for hosting gatheri
Don't miss out on this incredible opportunity to own a charming 2-unit building. Situated in the highly desirable neighborhood of North Alhambra, just steps away from South Pasadena, this property offers unparalleled convenience. With schools, parks, shopping, and public transportation within walking distance, and a quick 20-minute commute to Downtown Los Angeles, the location couldn't be more ideal. Each of the spacious units features an inviting layout with abundant windows flooding the interiors with natural light. The generously sized bedrooms offer comfort and privacy, while the well-appointed kitchens boasts a perfect blend of style and functionality. Don't let this gem slip through y
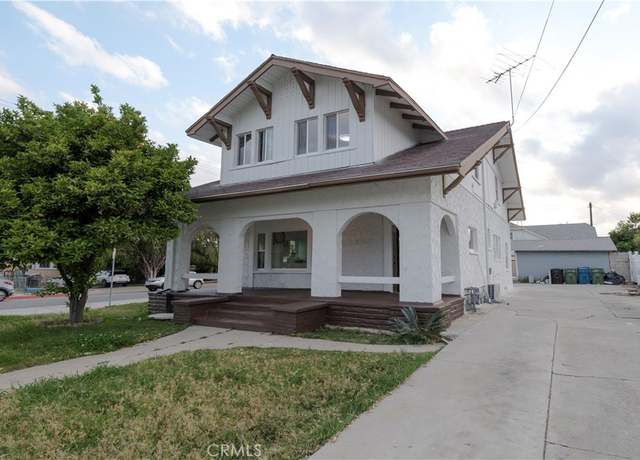
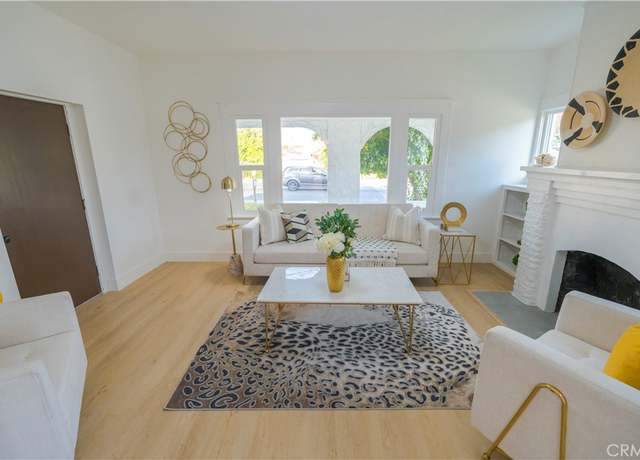
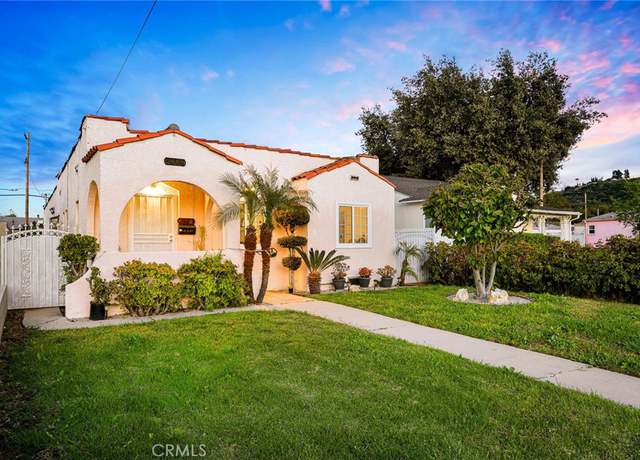
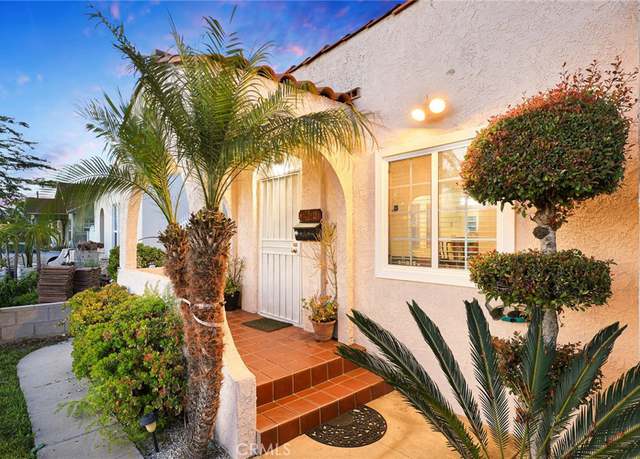
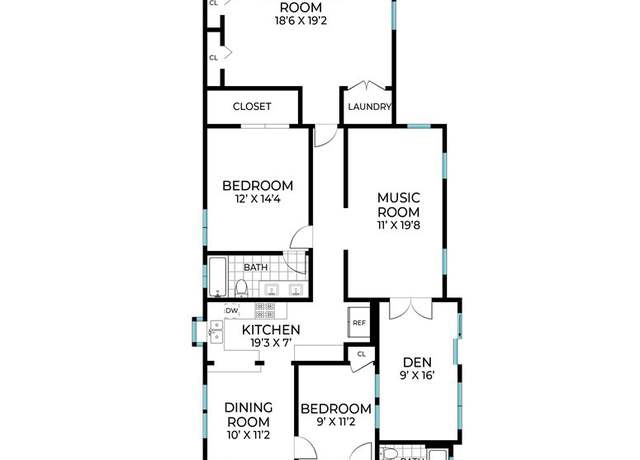
The well-maintained House is Located at Granada Park Alhambra Historical Neighborhood. It Features 3 Bedrooms and 2 bathrooms plus a Den and a Music Room. Nice Curb Appeal with Spanish Red Tile Roof. Front Porch Adds Charming Character to this Cozy House. Inviting Bright Living Room is Highlighted by Hardwood Flooring, a Handsome Fireplace, and double-paned windows. Formal Dining Room Connects to the Living Room is Next to the Kitchen. The Open Kitchen offers breakfast Bars, Granite Countertops, Stainless Appliances and Plenty of Cabinets. The Primary Suite has a Large Closet and a Private Bathroom. Two General Size Bedrooms Share a Bathroom. An Open Multifunction Room Connects to a den and
Charming home with hardwood floors and excellent curb appeal. Cozy living room entrance with bedrooms located in the back. Cozy dining room with built in cabinets. New electrical panel. It is located in one of the most desirable neighborhoods in the San Gabriel Valley. This neighborhood has plenty of shopping and restaurants nearby. Perfect for first time buyers. Garage has been converted into a third bedroom with bathroom, perfect for an extended family or home office.
Welcome to your dream home in the heart of Alhambra! This exquisite 4-bedroom, 4-bathroom residence boasts unparalleled views from its expansive balcony, where you can unwind and soak in breathtaking sunsets every evening. Step inside to discover a spacious kitchen, perfect for culinary adventures and entertaining guests. Equipped with solar panels, this home offers eco-friendly living and reduced energy costs. Recently painted and updated, it exudes modern charm and sophistication. But the luxury doesn't end there. Descend into the depths of indulgence with your very own underground wine/party room, ideal for hosting unforgettable gatherings or enjoying quiet moments of relaxation. Need a
Discover this delightful 2-bedroom end unit condo nestled in North Alhambra. Its open floor plan is bathed in natural light, featuring a cozy fireplace in the spacious living room. The kitchen has been tastefully remodeled with quartz countertops, ample cabinets, recessed lighting, and modern stainless-steel appliances. Throughout the home, beautiful laminate hardwood flooring combines style with durability. Stay comfortable year-round with central A/C. The generously sized rooms and updated bathrooms add to its allure, with the master bedroom boasting a walk-in closet. Fresh paint and designer fixtures give a touch of modernity, ensuring it's move-in ready. Location is key, with easy acces
Welcome to your beautifully updated and remodeled townhome nestled in the heart of Alhambra. This charming residence boasts 3 bedrooms, 2.5 bathrooms, and spans across a generous 1672 square feet, offering ample space for comfortable living. Upon entering, you are greeted by a private front yard, providing a serene oasis to unwind and enjoy outdoor moments. Step inside to discover a thoughtfully designed interior featuring modern finishes and abundant natural light throughout. The main level showcases a spacious living area, perfect for relaxation and entertaining, seamlessly flowing into the dining area and kitchen. The kitchen is a culinary delight, equipped with sleek appliances, ample c
Development Opportunity | 2424 W Grand Avenue is an eight plus one non-conforming unit multifamily property comprised of six separate buildings totaling 6,552 on an oversized 20,006 R3 lot. Mostly bungalow style, the property is separately metered for gas and electric, and offers seven carport spaces with storage bins. 2424 W Grand Avenue boasts a excellent unit mix of one non-conforming studio/one-bathroom unit, four one-bedroom/one-bathroom units, and four two-bedroom/one-bathroom units. Units offer individual water heaters, dual entrances, washer and dryer hookups, unexposed hardwood floors, wall units for heating and cooling, and a gas stove. The units are distinct as they are mostly bu
Welcome to this nicely renovated home, where modern updates and functionality take center stage. Renovated just seven years ago and as you enter, you'll be greeted by an open living space with updated finishes, including hardwood floors, and recessed lighting. The open-concept layout seamlessly connects the living room to the dining area and renovated kitchen, creating a perfect flow for daily living and entertaining. The renovated kitchen includes white cabinetry, quartz countertops, stainless steel appliances, and bar counter seating, making it a focal point for gatherings. The primary suite, part of the renovation, offers a private retreat with an upgraded en-suite bathroom showcasing co
This is a charming and specious ranch style home at a quiet neighborhood of Alhambra. It has 3 bedrooms, 1.75 bath, and 1 spacious living room and dinning area and open floorplan to kitchen. Huge back yard with potential for new ADU project. This recently remodeled home is move-in ready with recent upgrades that include fresh interior paint, newer block walls, newer AC in the dining area, and a newer water heater. Laundry area off kitchen. You will be greeted by the bright and airy floor plan, Professionally landscaped. A spacious backyard with an abundant lawn & fire pit area is perfect for gatherings. Just minutes away from shopping centers and the 210 freeway, this is a must-see!
This triplex property is conveniently located in Alhambra (close by Atlantic Avenue and Valley Blvd. ) within walking distance to markets, restaurants, and shops. Property consists of 2860 sq ft living area and sits on an 8016 sq ft lot. 1525 9th St (1 Bed, 1 Bath), 901 Norwood Pl (2 Bed, 1 Bath), 903 Norwood Pl (2 Bed, 1 Bath). Some recent upgrades include electrical panels for 1525 9th Street and 901 Norwood Pl (August 2018), replaced with copper plumbing for all 3 units (February 2013), replaced all the rain gutters (August 2018), replaced all 3 units water heaters within the past few years, repainted the apartment (August 2018). Each unit has their own electric and gas meters, a garage
Presenting an exceptional investment opportunity, this meticulously maintained five-unit property, under family ownership for over 30 years, enters the market for the first time. Boasting a stable tenant history and strategically located in North Alhambra, mere blocks away from major retail outlets, restaurants, and public transportation, this property offers both convenience and reliability. With ample parking, carports, and a separate community on-site laundry room, tenants enjoy added comfort and ease. The property's prime location, alongside its potential for consistent rental income and long-term appreciation, makes it an enticing prospect for seasoned investors and newcomers alike. Do
Welcome to this charming, beautiful home tastefully designed throughout. Recently remodeled and expanded into a spacious 3 bedroom (one is a master bedroom) and 2 ½ bath house, and a 1 bedroom and 1 bath with kitchen ADU in 2023 (unpermitted). ADU was converted from the 2 car garage. Remodel includes completely new roof, wiring, interior wall, ceiling, floors, recess lights, paint inside and out, appliances in kitchen, counter top, cabinet, double pane windows, bathrooms, and driveway. Backyard features mature fruit trees. Easy access to all the amenities the area has to offer, including walking distance to one of the most popular stretches of Valley Boulevard featuring some of the b
Great location in northern part of Alhambra. Spacious 3 bedroom, 3 bathroom condominium located near the conveniences of Main Street. Large living room with fireplace near dining area. Kitchen with plenty of cabinets and counter space. Three bedrooms located upstairs. Master bedrooms with walk-in closet and two sinks. Laundry located in attached garage. Convenient to Alhambra place shopping areas, Edward Theater, and School.
Beautiful two story remodeled 3 bed, 2.5 bath condo located in the quiet Ramona Estates Gated Community. This unit features a spacious living room with its own fireplace, remodeled kitchen with new cabinetry & Calcutta stone counter tops and private dining area. The main bedroom features a private balcony, connecting bathroom, walk in closet, grand bathtub and shower. The additional bedrooms also have direct access to a spacious second balcony. Brand new hardwood flooring, doors, and closet slides throughout the bedrooms. Step into the two car attached garage where you'll find the laundry area and additional storage space. Additional amenities include a community swimming pool and jac
Location, and location. This lovely condominium sits in a highly desirable location in North Alhambra neighboring San Marino and boosts one of the best school districts. This upgraded home features 3 bedrooms, 2.5 bathrooms. On the first level, the bright spacious living room with a cozy fireplace, natural light pours into each room of the property. Gorgeous kitchen with hardwood cabinetries, tile countertop, and stainless appliances. Dining area is well located next to the kitchen. Wet bar with hardwoods customized cabinets with glass door for displaying and storage. Walking up on the second level through corner stairs, the primary ensuite provides a walk-in closet, primary spacious bathr
Location, Location, Location! Beautiful 3-bedroom, 2 bath home in a preferred neighborhood of Alhambra. Large front yard and front porch area, hardwood floors, a spacious and comfortable living room. The oversized master suite is fully furnished and has direct access to the backyard. The backyard is open, grassy and has plenty of space for outdoor activities. Also an automatic gate can direct access to backyard and garage. So the detached two car garage can be a potential ADU and separate entry through automatic gate. Walking distance to Park and school; Close to Costco, restaurant and supermarket, just a few minutes drive, very convenient. The property sold " AS IS". Don’t
Prime Location In the Heart of Alhambra - Luxury Bright , Airy and Clean Condo Residence, three story complex. Top Floor Unit: Master Bedroom which facing South, Full Bathrooms, with closet space, second floor has two rooms, a space with sky light, can be office or den, Property features include beautiful granite countertop, wood flooring, window shutters , fire place in living room, in unit laundry room & extra office at first floor, Security included, gated entrance. Complex Close to freeways, Main Street and restaurant, theaters, supermarket, shops & school, farmers market. etc it's ready for new owner!
This charming triplex is located in a desirable Alhambra neighborhood. ± 2,285 SF building in a ± 6,032 SF lot, built in 1952. Every unit has two bedrooms and one bathroom. Two units downstairs and one unit upstairs. Current monthly rents are $1,700, $1,560, and $1,735. There are four-car detached garages in the back. Separated electric and gas meters. Easy to manage, good maintenance and stable tenants. Within Mark Keppel High School boundary (one of the top 11% Public High Schools in California from the 2024 ranking). Tranquil neighborhood yet easy access to all daily life amenities. Very close to California State University of Los Angeles. Minutes away from Fwy 10, 710, 60;
We are pleased to present First Street Apartments, a 16-unit apartment complex in the desirable city of Alhambra, CA. The property is located near Downtown Alhambra and borders the affluent communities of South Pasadena and San Marino. The property features an ideal unit mix consisting of one and two-bedroom units, gated entry, covered parking, owned laundry facility, individual gas and electric meters, and partial copper plumbing. The asset has been meticulously maintained and professionally managed with upgrades including a new Roof (2016), exterior paint on building and railings, new washers and dryers, and upgraded exterior lighting. Recently renovated units have laminate wood flooring,
Fantastic opportunity to own this fully renovated duplex in Alhambra with stable income and reliable tenants! All kitchen, bathroom and flooring are newly remodeled, truly turn key condition! 1404 Larch features a 640 sqft single family home comprising 1 bedroom and 1 bathroom. Tenants have access to the detached garage and can park in the garage or driveway. Tenant is paying $2190/month, owner covers water and trash. Tenant pay separate power, gas and internet. Owner provided Washer/Dryer/Refrigerator. 1408 Larch offers a 626 sqft single family home with 1 bedroom and 1 bathroom, with gated backyard for one car parking. Tenant is paying $2235/month, owner covers water and trash. Tenant
Welcome to this delightful two-bedroom, two-bathroom home situated in a peaceful and friendly neighborhood of Alhambra, CA . Step inside and discover a cozy retreat filled with warmth and comfort, perfect for those seeking a place to call their own. The second bedroom offers versatility, serving as an ideal guest room, home office, or cozy den. Landscaping front yard patio area. Conveniently located near Emery Park Elementary, Costco Wholesale, Albertsons, tons of restaurants, this home offers easy access to everything Alhambra has to offer while providing a peaceful sanctuary to come home to at the end of the day. Don't miss the opportunity to make this exquisite two-bedroom, two-bathroom
Nestled in the heart of Alhambra, this enchanting home, built in 1910, exudes timeless charm and boasts a harmonious blend of historic elegance and modern comfort. The downstairs unit, a 3-bedroom, 2-bath haven, welcomes you with warm accents of original wood, high beamed ceilings, and a sense of timeless craftsmanship. As you step through the front door, the living space unfolds with custom-built cabinetry that showcases the home's attention to detail. Hardwood floors grace the interior, creating a warm and inviting atmosphere throughout. The kitchen is a culinary masterpiece, featuring bespoke design elements that seamlessly integrate with the dining area, providing a perfect setting for
Located in the heart of Alhambra, 1833 S Cordova St. is a much beloved home, ready for a new chapter. This single-family home sits on a sizable lot, offering a unique opportunity for renovation and customization. The home maintains its original architectural and design features, while also opening itself to updates, making it an excellent project for those looking to add their touch to a solid home. With a practical layout that includes two bedrooms on the main level and two bedrooms upstairs, it's designed for family comfort and functionality. The home is positioned within the excellent Alhambra Unified School District, and finds itself only a short distance from the vibrant dining, shoppi
Nestled within the picturesque Midwick Park, this captivating Spanish-style residence seamlessly merges timeless allure with contemporary comforts. Offering four bedrooms and two bathrooms, this meticulously updated home epitomizes luxury living. Step inside to discover a harmonious blend of old-world charm and modern elegance. Newly installed white oak waterproof flooring sets the stage for a seamless flow throughout, complemented by a brand-new HVAC system, updated plumbing, electrical wiring, and energy-efficient windows and French doors. The bathrooms and kitchen floors are adorned with exquisite Saltillo tiles, adding a touch of rustic charm to the home's aesthetic. Entertain in style
Discover the unique opportunity in Alhambra! This spacious property boasts 6 bedrooms, 3 full bathrooms, and 3 kitchens. With a new laundry machine, it offers rental potential, allowing you to reside in one section while leasing out the others. Situated on a large lot with ample parking, the house features three separate entries: one in front, one in the middle, and an upper balcony entry. The upstairs comprises 2 bedrooms and 1 bathroom, while the first floor offers 4 bedrooms and 2 bathrooms. Conveniently located near the 10 freeway, local amenities, and cultural attractions, this home promises vibrant community living and additional income potential. Don't miss out on this enticing inves
Attention Builders and Investors! A unique opportunity presents itself with this expansive lot, nearly 18,000 square feet, located in the prime area of downtown Alhambra. This property falls within the RESIDENTIAL HIGH DENSITY ZONE, ALLOWING THE CONSTRUCTION OF UP TO 64 UNITS PER ACRE WITH HEIGHT OF UP TO 75 FEET AND UP TO 6 STORIES. Its prime location offers walking distance convenience to the Edwards movie theater, numerous restaurants, and shops along the main street of downtown Alhambra, all while being situated in a peaceful neighborhood. Easy access to the 10 Freeway, Costco, and Home Depot. Currently, the site hosts two buildings. The front house at 209 Monterey features 2 bedrooms a
Introducing Orchard Court, a meticulously crafted haven of elegance in the heart of the city of Alhambra. Built in 2024, this exclusive mixed-use development offers 10 luxurious residential townhomes and two premium retail units. Step inside to discover a world of modern luxury, with each residence boasting a gourmet kitchen featuring quartz countertops and contemporary cabinetry, complemented by 10-foot high ceilings and abundant natural light. This unit features an attached garage and a rooftop garden or deck, providing breathtaking views of the surrounding mountains. At Orchard Court, you will find yourself steps away from Sprouts, conveniently close to nearby attractions, such as the Ed
Introducing Orchard Court, a meticulously crafted haven of elegance in the heart of the city of Alhambra. Built in 2024, this exclusive mixed-use development offers 10 luxurious residential townhomes and two premium retail units. Step inside to discover a world of modern luxury, with each residence boasting a gourmet kitchen featuring quartz countertops and contemporary cabinetry, complemented by 10-foot high ceilings and abundant natural light. This unit features an attached garage and a rooftop garden or deck, providing breathtaking views of the surrounding mountains. At Orchard Court, you will find yourself steps away from Sprouts, conveniently close to nearby attractions, such as the Ed
Introducing Orchard Court, a meticulously crafted haven of elegance in the heart of the city of Alhambra. Built in 2024, this exclusive mixed-use development offers 10 luxurious residential townhomes and two premium retail units. Step inside to discover a world of modern luxury, with each residence boasting a gourmet kitchen featuring quartz countertops and contemporary cabinetry, complemented by 10-foot high ceilings and abundant natural light. This unit features an attached garage and a rooftop garden or deck, providing breathtaking views of the surrounding mountains. At Orchard Court, you will find yourself steps away from Sprouts, conveniently close to nearby attractions, such as the Ed
This Perfect Triplex is located in a very beautiful and desirable neighborhood in the city of Alhambra. This property with 3 multifamily units (A, B, C) is very suitable for owner user or investor with total of 3,074 sq ft on a 7,481 sq ft lot. There is the potential opportunity to build an ADU on this big lot. This delightful residence has 3 bedrooms , 2 bathrooms with approximately 1,244 sq ft downstairs, and both upstairs units each have 2 bedrooms, 1 bathroom with approximately 950 sq ft. This property has 4 single car garages with additional parking spaces for 4 more vehicles on the big long driveway. Each unit has its own separate electric meters, making it easy and efficient to have
Amazing opportunity to own a side-by-side duplex with backyard pool! Fantastic investment possibility, perfect for multigenerational families or live in one unit and rent the other to help cover mortgage - the choice is yours! Unit 1 (202 Westmont Dr. ) features 2 bedrooms, 1 full bathroom and is approximately 1,000 sq ft. It offers an open concept floor plan, laminate flooring throughout, contemporary interior fixtures and color palette, crown molding, cozy fireplace in the family room, separate dining area, kitchen with granite counters as well as a convenient laundry/storage closet that fits a stackable washer and dryer. Enjoy the nice-sized master bedroom, secondary bedroom with ample
This stunning 4-unit Spanish Revival property is located in one of the premier locations in north Alhambra directly across from Alhambra Park and north of Main Street. The building has almost 4,400 square feet of living space such that each unit averages about 1100 square feet. The unit mix is (1) 2 bedroom 1 bath unit and (3) 1 bedroom one bath units. Each unit boasts a large living room, formal dining room, spacious bedrooms, updated bathrooms, kitchens with either granite or tile counters and their own laundry rooms with washer and dryer hookups. The upstairs units have high arched ceilings. There are five separate garages on the property and convenient off-site parking as well. Each uni
Don't miss out on this incredible opportunity to own a charming 4-unit Spanish-style apartment building radiating Pride of Ownership. Situated in the highly desirable neighborhood of North Alhambra, just steps away from South Pasadena, this property offers unparalleled convenience. With schools, parks, shopping, and public transportation within walking distance, and a quick 20-minute commute to Downtown Los Angeles, the location couldn't be more ideal. Each of the spacious units features an inviting layout with abundant windows flooding the interiors with natural light. The expansive living rooms and formal dining areas provide ample space for entertaining guests or relaxing with loved ones
Single story home situated minutes from Almansor Court. Generously long driveway allows parking space for multiple cars in a tandem fashion. Driveway leads to carport for two cars to be parked side by side. Contains many amenities such as public transportation, shopping centers, grocery stores, banks, post office, golf course, public parks, schools, easily accessible to freeways. Perfect for first time home buyers and holds great potential for growth in value.
Spacious side by side duplex with one bedroom, one bath in each unit. Unit 2011 has been totally remodeled/updated with new hardwood floors, dual pane windows, new kitchen includes dishwasher and stove, new bath with beautiful, large shower with multiple shower heads and sliding glass enclosure. The living room faces the small front area, the formal dining room is open to the kitchen, the laundry room has access to the side walkway and the bedroom is at the back of the unit with a sliding glass door to the pool and spa! Unit 2009 is the same floor plan in reverse and features a fireplace. This unit is occupied on a month to month agreement and has not been recently updated. Both units share
Investors LOOK at this one! Welcome to this appealing opportunity in the heart of Alhambra! This fixer home holds immense potential with 3 bedrooms and 2 baths, offering space for customization and personalization. With generously sized bedrooms. Bring your creativity to breathe new life into this property. The spacious backyard is ideal for outdoor activities or entertaining or even adding ADU conversion on the rear garage. The seller has redone the roof 2 years ago. Conveniently located near the City Civic Center, schools, parks, shopping, and transportation, this home is an excellent investment opportunity. Don't miss out on the chance to turn this house into your dream home! The ho
This area's enrollment policy is not based solely on geography. Please check the school district website for more information.
Elementary schools
Middle schools
High schools
GreatSchools Summary Rating
8/10
Martha Baldwin Elementary School
Public, K-8
8/10
Marengo Elementary School
Public, K-5
8/10
Monterey Hills Elementary School
Public, K-5
7/10
Ramona Elementary School
Public, K-8
7/10
Park Elementary School
Public, K-8
Only showing 5 of
14 elementary schools.
School data is provided by GreatSchools, a nonprofit organization. Redfin recommends buyers and renters use GreatSchools information and ratings as a first step, and conduct their own investigation to determine their desired schools or school districts, including by contacting and visiting the schools themselves.Redfin does not endorse or guarantee this information. School service boundaries are intended to be used as a reference only; they may change and are not guaranteed to be accurate. To verify school enrollment eligibility, contact the school district directly.
Homes for sale in Alhambra have a median listing price of $934K. Some of these homes are Hot Homes, meaning they're likely to sell quickly.
What are some of the most popular neighborhoods in Alhambra?
Popular neighborhoods include Eastside LA, Sierra Vista, Mechanicsville, El Sereno, North San Gabriel, Luminaria Hills, Downtown Alhambra, Bahama, Valley Boulevard, and Emery Park.
Transportation in Alhambra, California, is primarily car-centric, with residents often relying on their cars to commute. The city experiences moderate to high levels of traffic, especially during peak hours. Public transportation is available, with services provided by the Los Angeles County Metropolitan Transportation Authority. Alhambra is conveniently located near several major highways, including the I-10 and I-710 freeways, providing easy access to surrounding areas. Learn more on our Alhambra city guide.
What types of properties are available in Alhambra?
Alhambra, California offers a variety of single-family home types, including ranch-style, contemporary, and modern homes, each with its own unique architectural style and design elements. These homes can be found throughout the city, with many located in established neighborhoods and newer developments. Most properties feature 2-4 bedrooms and were built in various years, providing a range of options for homebuyers. To explore different property types for sale in Alhambra, California, use the 'Home type' filter located above the active listings. Customize your search by selecting options like single-family homes, condos, townhomes, and more.
What is life like in Alhambra?
Alhambra, California offers a vibrant urban experience with a mix of commercial and residential areas. The city is surrounded by rolling hills and picturesque mountains, providing a scenic backdrop. The weather in Alhambra is pleasant year-round, with mild winters and warm summers. The city boasts a range of job opportunities across various industries, including retail, healthcare, and technology. Residents can enjoy a diverse range of activities, such as exploring local parks, dining at diverse restaurants, and engaging in cultural events.
What are the schools and amenities like in Alhambra?
Alhambra, California offers a variety of public amenities to cater to the needs of its residents. The city is home to several restaurants, offering a wide range of cuisines to satisfy diverse culinary preferences. Multiple parks provide serene spaces for relaxation and recreation. Grocery stores are also available, making daily shopping convenient for the residents. Moreover, additional amenities such as fitness centers, libraries, and cinemas are present to enrich the lifestyle of those living in Alhambra.
In the past month, 22 homes have been sold in Alhambra. In addition to houses in Alhambra, there were also 22 condos, 14 townhouses, and 18 multi-family units for sale in Alhambra last month. Alhambra is a fairly walkable city in Los Angeles County with a Walk Score of 71. Alhambra is home to approximately 83,549 people and 26,746 jobs. Find your dream home in Alhambra using the tools above. Use filters to narrow your search by price, square feet, beds, and baths to find homes that fit your criteria. Our top-rated real estate agents in Alhambra are local experts and are ready to answer your questions about properties, neighborhoods, schools, and the newest listings for sale in Alhambra. Our Alhambra real estate stats and trends will give you more information about home buying and selling trends in Alhambra. If you're looking to sell your home in the Alhambra area, our listing agents can help you get the best price. Redfin is redefining real estate and the home buying process in Alhambra with industry-leading technology, full-service agents, and lower fees that provide a better value for Redfin buyers and sellers.


 REDFIN IS COMMITTED TO AND ABIDES BY THE FAIR HOUSING ACT AND EQUAL OPPORTUNITY ACT. READ REDFIN'S FAIR HOUSING POLICY AND THE NEW YORK STATE FAIR HOUSING NOTICE.
 United States
 Canada