Welcome to 15410 Wagner St, a single story home that is basked in daylight no matter which room you're in! Boasting three bedrooms, gleaming laminate floors, dual paned windows, and a spacious backyard ready for your finishing touches, you'll be able to enjoying sunny afternoons with family and friends or cultivating your green thumb with gardening projects. Minutes to public transportation, highways, shopping and restaurants, you'll find this home to be ideally located within proximity to all your everyday needs. Open Sat & Sun 1-4PM
Welcome to your opportunity to own a home in the desirable San Lorenzo Village! This 3-bedroom, 2-bathroom residence is your blank canvas awaiting your personal touch. With both a living and family room, there's ample space for comfortable living and entertaining. The property includes an attached garage, covered patio, breakfast nook, and offers plenty of sweet equity potential. Use your imagination to update this home to your taste and make it your own. Don't miss out on this chance to own a home in San Lorenzo at an attractive price!
Delightful single-level three bedroom home nestled in a serene neighborhood setting. Large living space complete with hardwood floors throughout, oversized sliding patio doors, two fireplaces and recessed lighting. Kitchen features a breakfast nook and buffet bar, ideal for both casual meals and entertaining guests. Master bedroom highlights en-suite bathroom, extra closet space and ample sunlight. Step outside to enjoy a beautifully landscaped yard with large covered patio to unwind and enjoy just n time for summer. This home is thoughtfully designed for accessibility, with wheelchair ramps at both the front and back entrances, ensuring everyone can feel at home. Conveniently located near
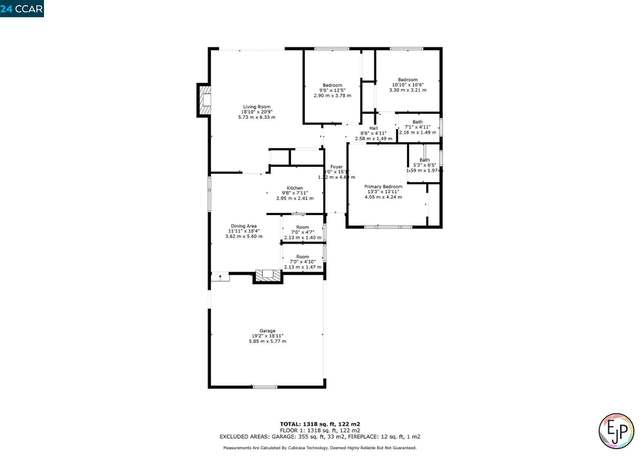
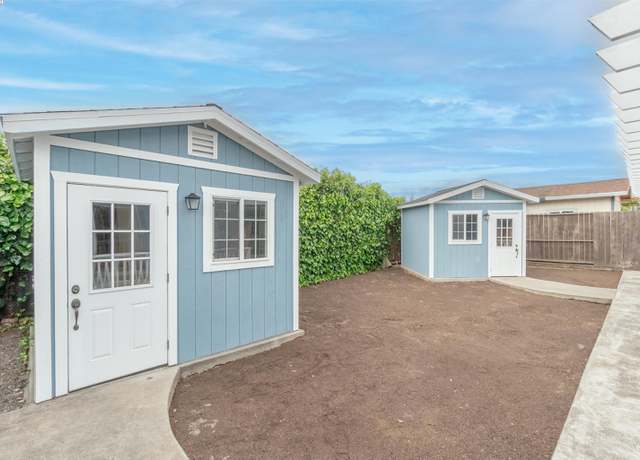
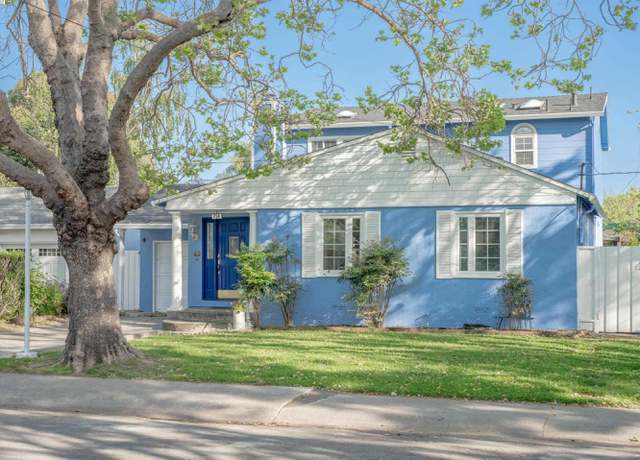
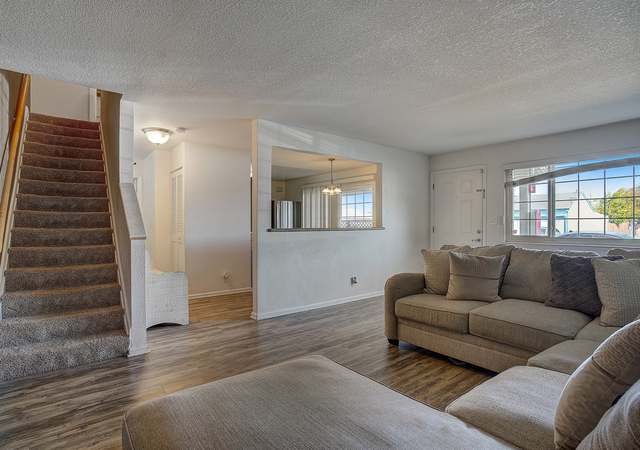
Lovely 3 Bedroom 2 Bath Home with Easy Access to Freeways, Schools, Shopping and Other Conveniences. .. Living Room with Recessed Lights. .. Family Room with Brick Fireplace with Raised Hearth plus Recessed Lighting & Sliding Glass Door to Large Patio with Trellis. .. Roomy Kitchen with Ample Cabinets, Tile Counters & Backsplashes, Range/Oven, Microwave Oven, Dishwasher & Ceiling Fan. .. Dining Area with Skylight. .. Primary Bedroom with Bath. .. Fresh Interior Paint. .. 2 Bedrooms with Ceiling Fans. .. Front Yard Landscaped. .. Backyard with Large Patio with Trellis, & 2 Storage Sheds.
Exquisitely updated San Lorenzo residence poised for listing, boasting an ideal location proximate to shopping centers, BART, and major transportation arteries including 238, 880, and 580. This versatile Multi-Gen style home features 5 bedrooms and 3 bathrooms, offering both space and functionality. Enjoy the comfort of central heating and the convenience of a split-type air conditioning system. Dual pane windows enhance energy efficiency while providing sound insulation. Additional storage space in the bonus area adds practicality to the home. The heart of the residence, the expansive kitchen, showcases modern amenities including solid countertops, modern cabinetry, newly flooring, stainle
Highly desirable, 3 bedroom 1 bath with about 1168 SF, big lot with about 5859 SF, good sized living room with fireplace, updated kitchen with dining area, beautiful new Pergo floors in the kitchen and dining area, freshly painted throughout in the interior, updated baths, central heat, handsome size backyard for your growing needs and outdoor activities, short walk to Hesperian Blvd where you will find most of your daily needs, close to many schools. .. Don't miss out on this one!
OPEN HOUSE May 4, 11-2 Investor's Dream! Fixer Upper with Unlimited Potential in San Lorenzo Welcome to an investor's paradise! This 2-bedroom, 1-bathroom home has 836 sqft. sits on a nice 3150 sqft. lot in the sought-after Four Corners neighborhood of San Lorenzo, California. With its prime location and ample opportunities for renovation, this property is a diamond in the rough waiting to shine. Prime Location: Nestled in the heart of the city, this property offers unparalleled access to the best of the East Bay. Positioned between Hayward and San Leandro, residents enjoy easy access to a wealth of amenities and recreation options. Endless Possibilities: Calling all investors and DIY enthu
This is the one you've been waiting for! The main house offers 1,515 sq ft of living space boasting a desirable open floor plan. The kitchen offers custom cabinetry with an abundance of storage in the island with wrap around pullout drawers & cabinets. You'll find a luxurious remote gas fireplace in the family room & central air conditioning for those hot summer heatwaves. The main bathroom has been tastefully remodeled and the enclosed patio extends the usable family/entertaining space. The backyard offers many fruit trees and organic soil for a vegetable garden. The detached ADU is a studio apt. measuring approx 300 sq ft providing the essentials needed to live comfortably. Th
Beautiful and bright condo in gated community. This second level end unit has an open floor plan, 2 bedrooms, 2 full baths. Cozy and spacious living room. A sliding door from living room leading to a private balcony with partial hill views, extra space for home garden, afternoon teatime, and storage area. Upgraded granite kitchen with Whirlpool stainless steel appliances, plenty of kitchen cabinets. Updated bathrooms with nice quartz vanity tops. Brand new luxury vinyl plank flooring in living room, dining area and hallway. New tiles in kitchen and bathrooms. Carpet flooring in both bedrooms. All dual pane windows. Laundry area in the unit. Two assigned parking spaces (one is covered, one i
Welcome to your dream home nestled in the heart of The San Lorenzo Village! This charming single-family residence boasts 3 cozy bedrooms and 2 bathrooms, all w/ in a spacious 1,181 Sq/Ft of living space. Plank hardwood floors guide you through the light-filled rooms, creating an inviting atmosphere that you'll love coming home to. Situated on a desirable corner lot, this home offers a perfect blend of privacy and curb appeal. The NEW ROOF and NEW HEATER ensure that you'll enjoy years of worry-free comfort, while the property's bright and airy ambiance is perfect for entertaining or simply relaxing with loved ones. The garage offers ample storage & a sturdy workbench , perfect for tack
ATTENTION DEVELOPERS! THIS PROPERTY BOASTS ENDLESS POSSIBILITIES. Two lots equaling 1 Acre. Check with County to see how many units can be built on property. Possible uses include a family compound or possibly multiple families, business use to park or store multiple vehicles, i. e. , Landscapers can have equipment and plants and family all on one property. You can build ADU's and have family and income. Main house has 2 bedrooms, 1 bath, bonus room, partial basement and is approximately 1500 sq. ft. Property also has 3 separate rental units. Each detached rental unit is approximately 300 sq. ft. is either a studio or has 1 bedroom, 1 bath and kitchenette. Property to be sold in conjunction
ATTENTION DEVELOPERS! THIS PROPERTY BOASTS ENDLESS POSSIBILITIES. Two lots equaling 1 Acre. Check with County to see how many units can be built on property. Possible uses include a family compound or possibly multiple families, business use to park or store multiple vehicles, i. e. , Landscapers can have equipment and plants and family all on one property. You can build ADU's and have family and income. Main house has 2 bedrooms, 1 bath, and is 970 sq. ft. Property also as a detached garage and 2 storage structures. Property to be sold in conjunction with adjoining lot at 183 E Lewelling Blvd.
FIVE UNIT MIXED PROPERTY: 20,380 sq ft lot with approximately 4,788 sq ft of living space. Single family homes with 2 bedrooms and 1.5 baths and 3 bedrooms and 2 baths. Triplex building with Three- 2 bedrooms and 1.5 baths each. Spacious floorplans. Each unit has 2 parking spaces and garages. Most of the units have some upgrades. Great location! Convenient to commute routes-880 freeway, and BART (Hayward station is close by). Property is close to 3 Colleges: Cal State East Bay. Chabot College and Mills college. Oakland airport is close by and easy access to the Peninsula.
Discover this special gated multifamily property boasting 7 units 3-bedroom, 2-bath townhouse-style homes along with a bonus manager's Studio nestled at 20161-20173 Royal Ave, in the thriving San Lorenzo/Hayward, CA area. Constructed in 2009, this property spans a generous Lot Size of 20,328 Sq ft (0.47 Acres), offering a gross living space of approximately 10,031 Sq ft. , designed with Subdivision Plan excellence and potential for subdivision. Each unit, meticulously designed, spans from approximately 1,269 SF to 1,794 SF, providing ample living space. Additionally, the manager's Studio offers around 600 SF. Ensuring convenience, every unit includes a two-car garage, providing a total of 1
Welcome to The Willow Townhomes gated community nestled in the heart of Washington Manor. This property has 2 assigned parking spaces and in an FHA approved community. With an abundance of natural light, the open layout of the living spaces creates a bright and inviting atmosphere. The spacious kitchen has been beautifully upgraded with elegant countertops, a modern backsplash, stylish cabinets, and stainless steel appliances. The dining area is spacious enough for large gatherings or intimate dinners for two. The living room features updated flooring and is generously sized to accommodate even the largest furniture. The bedrooms are generously sized and updated with custom closets, includi
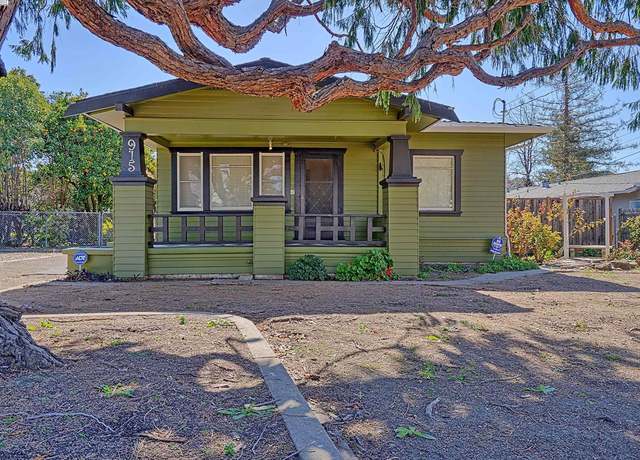
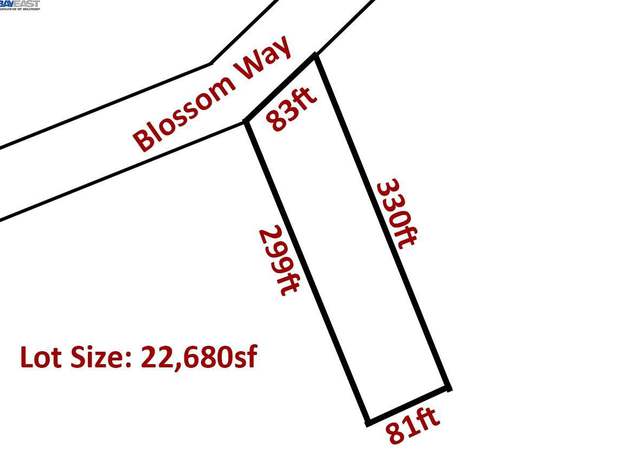
An amazing opportunity for this extraordinary Cherryland property located in an unincorporated area of Alameda County with large flat lot of 25,680 sf. Checks with county for the possibilities of building up to 7 dwelling units (25,680sf / 3500sf). It comes with a classic craftsman style home with 3bedrooms and 1bathroom ~ 1265 sf of living space, in addition to the main house, it comes with a drive through over size garage include a half bath which also functions as a workshop. A detached barn style structure can serve as an extra storage or workshop. There is ample parking space perfect for RV, boats and hauler toys. Don’t miss this rare slice of Prime land located in East Bay.
Rare opportunity available in this desirable luxury Heron Bay waterfront community! This beautiful home offers 2778 sq feet, 4 bedrooms plus a bonus room. Breathtaking views and abundance of natural lighting with high vaulted ceilings! Located at the center of the court location with the backyard next to the Shoreline Park views and sunsets to LIVE for and welcome yourself home for relaxation after a long day. A formal living room with fabulous dining room perfect for families gathering and entertaining friends. Upgraded kitchen offers many cabinets & pantries, stainless steel appliances, granite countertops and island. The luxurious master bedroom suite has a large tub, a separate sh
Here is the one you have been waiting for. The first time this home has been on the market! Outstanding location in Washington Manor, right in the center of the development. This 3 bedroom 2 bath home offers nearly 1160 feet of livable space on a 6,000 foot lot with room to expand the home or add an ADU! The interior of the home features newly installed upgraded luxury Vinyl Plank flooring in the living room, kitchen and hallway with carpet in the 3 bedrooms. All interior walls and trim have been freshly painted. Dual pane windows throughout. This is the original floor plan, with a very spacious living/dining room. All 3 bedrooms are large. There is an oversized 2 car garage with laundry ho
Updated and ready to move in! Freshly painted interior in the commute-friendly Winton Grove neighborhood, close to Hwy 92/San Mateo bridge, and I-880! Spacious 5,040 sq. ft. lot with room to expand the home in the future * Ideal location close to Costco, Home Depot, shopping, and schools * Gas stove * New high-quality living room flooring * Dual-pane windows * Recessed lighting * Plantation shutters.
.3 bedrooms, 2 full baths, enclosed screen rooms. New paint interior, new laminated floor in living room, dining room, kitchen. Carpet for bedrooms. Newer kitchen. Master bedroom includes walk-in closet, bathroom with sink & vanity. Dining area with built in hutch, Laundry closet with washer & dryer that stay, kitchen appliances stay. MOVE IN CONDITION. Park amenities include Clubhouse, Card Room, Library, Exercise Rooms, Pool & Spa. FLEX Shuttle bus stop inside Park. Age restrictions apply, one must be 55+, NO ONE UNDER THE AGE OF 18. Park approval required, proof of income - 3 x rent space & good credit. Must be primary residence.
Uncover the hidden gem within this charming cottage full of potential. With two cozy bedrooms, one bath, and a medium-sized backyard, this home offers the perfect foundation for your personal touch. Easy access to highway 580 and 880, close to shopping centers, schools, parks and much more. Don't miss the chance to transform this gem into your dream home. Embrace the potential and make it yours today!
Newer manufactured 3 bedroom, plus a den, 2 bath home in the desirable Mission Bay community. Freshly painted interior and exterior. New flooring thru out. Living room with vaulted ceilings open to the dine area and kitchen. Breakfast area in the kitchen with lots of natural light. Den, great for a home office, or retreat area. Primary bedroom with primary bath, featuring dual sinks, stall shower, walk in tub, and lots of linen storage. Enjoy morning coffee on the newly redone front porch. Large storage shed at the rear of the carport, A/C and lots more.
Beautifully maintained, this two-story single-family residence boasts five bedrooms, three bathrooms, and 2255 sqsf of living space, all nestled in the desirable Marina Vista neighborhood. Constructed in 1998, it features high vaulted ceilings and expansive windows that flood the interiors with natural light. The first floor offers a separate entrance leading to a bedroom and full bathroom, ideal for seniors or easily adaptable for an ADU. Conveniently situated close to parks, the BART station, the 880 freeway entrance, Costco, and a supermarket, the allure of this home guarantees a quick sale!
Discover the epitome of elegance and prime location in this exceptional Tri level home, nestled at the heart of the Bay Area. Boasting a lavish living space of approximately 1,515 square feet, this residence features 3 bedrooms and 3.5 baths. The contemporary design unfolds with an open floor plan, leading to a patio that invites you to bask in natural light. A 2-car garage with ample storage complements the bright and airy atmosphere. The living room, adorned with a fireplace, exudes spaciousness. Revel in exquisite finishes, from crown molding and baseboards to a breakfast bar, hardwood floors, and granite countertops in the kitchen. Modern conveniences include tankless water heater and a
Inviting 3beds/2 baths new built in 2006 with owned solar system, central heating and AC, central vacuum system, stainless steel appliances, granite counter top, hot tube in nice entertainment room, low maintenance front back and side yards. Easy Access to Freeways, Shopping, Kaiser Permanente Hospital & Medical Center, Parks, Post Office, Library, Restaurants, Public Transportation, B. A. R. T. , San Leandro Marina & Golf Course & More.
Step into this newly revitalized townhome-style condo, boasting freshly painted interiors that exude modern elegance. This move-in ready gem spans across two stories, offering 2 Beds, 1.5 baths, and 1101 square feet of stylish living space. Perfectly suited for first-time homebuyers or those seeking the convenience of condo living, this residence boasts a well appointed kitchen with granite countertops and SS appliances including a built-in microwave. Enjoy the convenience of the attached one-car garage plus a designated parking spot in the lot, street parking is also available. Enjoy the ease of in-unit laundry facilities and bask in the abundance of natural light that filters through ever
Calling all Investors, Great residential investment multi unit in upcoming Burbank area. Two buildings on one lot. The first building was a restaurant and bar, it is vacant and needs major repair. The single family home sits behind the first building. Single family has two bedrooms, one bath, small living area, kitchen, small laundry room, fresh paint throughout, new vinyl flooring and recessed lighting. Just minutes from downtown Hayward! Potential for three income producing buildings, buyer to investigate with the City for additional ADU. Plans for a two bedroom one bath unit has been submitted to the city of Hayward, buyer to verify and investigate. Close to BART, Amtrak and 880 Freeway.
This is it!! Don't miss out on positive cash flow! 5 units all rented except owners unit. Well maintained property near freeways, shopping, schools! LONG TERM tenants! Fully Rented!! This property could be turned into a 4 unit. $5800 monthly groos income once owners unit is rented.
Newly updated charming 2B/1b in the front with 2 new cement patio areas (One behind the home and another patio area is behind big storage) in the back for parking cars or entertainment area. Long driveway for multiple cars to park also. The original workshop is in the back and new buyers to continue working with the City to get an ADU permit. Will provide City papers if interested.
Excellent opportunity for income property in Hayward. Off street parking, redone kitchens central location, good freeway access and possible expansion in read of the property. Possible dev opportunity in rear of property. Do not go on property large dog.
TRY 4 HOMES on 1 LOT ! What an opportunity to own this fabulous home and a tri plex property in premium condition, in the heart of Hayward. Wonderful main home remodeled in 2023, great curb appeal plenty of front yard, backyard and lots of room for cars and toys etc. This home is an open style signal story home with gorgeous upgrades. The 3 townhomes in the back were built in 1998 and again in premium shape. They are lovely 2 story units with a great floor plans that offer 3 bedrooms and 1 bathroom each with plenty of room to parking and outdoor space to play or entertain! Location is ideal very close to downtown Hayward, minutes to freeways in every direction and close to University. Live
What an opportunity to own this fabulous 4 plex property in premium condition in the heart of Hayward. Wonderful main home remodeled in 2023, great curb appeal plenty of front yard, backyard and lots of room for cars and toys etc. This home is an open style signal story home with gorgeous upgrades. The 3 townhomes in the back were built in 1998 and again in premium shape. They are lovely 2 story units with a great floor plans that offer 3 bedrooms and 1 bathroom each with plenty of room to parking and outdoor space to play or entertain! Location is ideal very close to downtown Hayward, minutes to freeways in every direction and close to University. Live in main house and rent the rest or us
Built in 1989, this 6 unit townhome-style property is truly unique as there's a private driveway leading to 3 detached buildings on an expansive near half acre lot. With only 2 units per building and no adjoining walls, this property offers a true sense of privacy. Each unit includes the living area upstairs and a private two car garage below, plus their own yards. All units are individually metered and include a spacious living area with fireplace, 1 bedroom, full size bath, washer/dryer hook-ups, private entry, and balcony. The kitchen comes equipped with an electric range, dishwasher, refrigerator, sink with garbage disposal, and plenty of cabinets. Plus, there's a bonus 7th unit (manage
Charming mobile home & no property taxes! Two bedrooms, one full bathroom. 1152 square feet. Double Pane Windows. Lovely galley kitchen. Spacious Living Room and Dining Room. Freshly painted inside. Storage shed. Located in the highly desirable Mission Bay Community. Buyer must be 55 years or older to qualify for the park. Space rent is $1308. Back on market because buyers did not qualify at the park.
This area's enrollment policy is not based solely on geography. Please check the school district website for more information.
Elementary schools
Middle schools
High schools
GreatSchools Summary Rating
5/10
Bay Elementary School
Public, K-5
4/10
Lorenzo Manor Elementary School
Public, K-5
4/10
Grant Elementary School
Public, K-5
4/10
Del Rey Elementary School
Public, K-5
1/10
Colonial Acres Elementary School
Public, K-5
Only showing 5 of
7 elementary schools.
School data is provided by GreatSchools, a nonprofit organization. Redfin recommends buyers and renters use GreatSchools information and ratings as a first step, and conduct their own investigation to determine their desired schools or school districts, including by contacting and visiting the schools themselves.Redfin does not endorse or guarantee this information. School service boundaries are intended to be used as a reference only; they may change and are not guaranteed to be accurate. To verify school enrollment eligibility, contact the school district directly.
San Lorenzo, California boasts a well-structured transportation system, with a variety of options for residents. The area experiences moderate traffic levels, making driving by car a viable option for commuting. Public transportation is readily available, with bus and train services providing connectivity to nearby regions. Additionally, San Lorenzo is conveniently located near major highways and freeways, facilitating easy access to surrounding areas.
What types of properties are available in San Lorenzo?
San Lorenzo, California offers a variety of single-family home types, including ranch-style homes, contemporary homes, and modern homes with open floor plans and ample natural light. These homes can be found throughout the city, with many located in established neighborhoods and newer developments. Most properties feature three to four bedrooms and were built within the last 20 years. To explore different property types for sale in San Lorenzo, California, use the 'Home type' filter located above the active listings. Customize your search by selecting options like single-family homes, condos, townhomes, and more.
What is life like in San Lorenzo?
San Lorenzo, California offers a tranquil and peaceful living experience with its serene landscape surrounded by hills and lush greenery. The area enjoys a mild Mediterranean climate, characterized by warm summers and cool winters. The region provides a range of job opportunities across various industries, including education, healthcare, and retail. Residents can engage in a variety of recreational activities, such as hiking, biking, and exploring nearby parks and trails. The town also hosts community events and gatherings that foster a strong sense of belonging and engagement among its residents.
What are the schools and amenities like in San Lorenzo?
San Lorenzo, California offers a range of public amenities for its residents. The area boasts a variety of restaurants, providing a diverse selection of cuisine to satisfy all tastes. For those who enjoy outdoor activities, there are several parks available for leisure and recreation. Grocery stores are conveniently located throughout the region, making everyday shopping easy and convenient. Additionally, San Lorenzo provides other essential amenities such as schools, libraries, and healthcare facilities.
In the past month, 13 homes have been sold in San Lorenzo. In addition to houses in San Lorenzo, there was also 1 condo, 1 townhouse, and 1 multi-family unit for sale in San Lorenzo last month. San Lorenzo is a moderately walkable city in Alameda County with a Walk Score of 56. San Lorenzo is home to approximately 23,171 people and 3,530 jobs. Find your dream home in San Lorenzo using the tools above. Use filters to narrow your search by price, square feet, beds, and baths to find homes that fit your criteria. Our top-rated real estate agents in San Lorenzo are local experts and are ready to answer your questions about properties, neighborhoods, schools, and the newest listings for sale in San Lorenzo. Our San Lorenzo real estate stats and trends will give you more information about home buying and selling trends in San Lorenzo. If you're looking to sell your home in the San Lorenzo area, our listing agents can help you get the best price. Redfin is redefining real estate and the home buying process in San Lorenzo with industry-leading technology, full-service agents, and lower fees that provide a better value for Redfin buyers and sellers.


 REDFIN IS COMMITTED TO AND ABIDES BY THE FAIR HOUSING ACT AND EQUAL OPPORTUNITY ACT. READ REDFIN'S FAIR HOUSING POLICY AND THE NEW YORK STATE FAIR HOUSING NOTICE.
 United States
 Canada