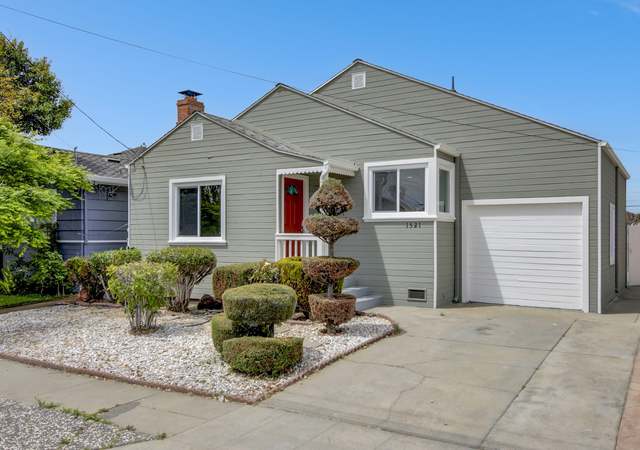
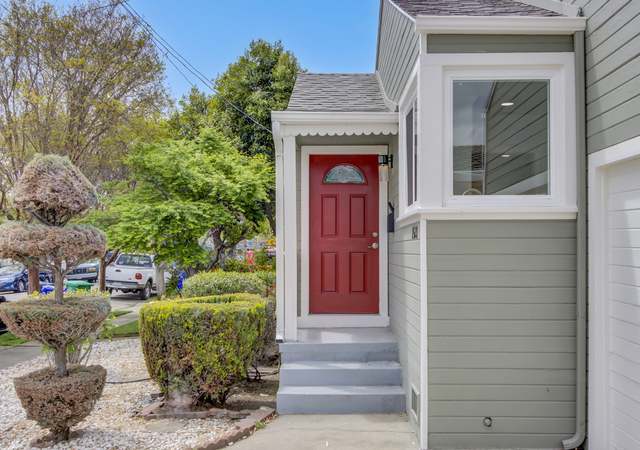
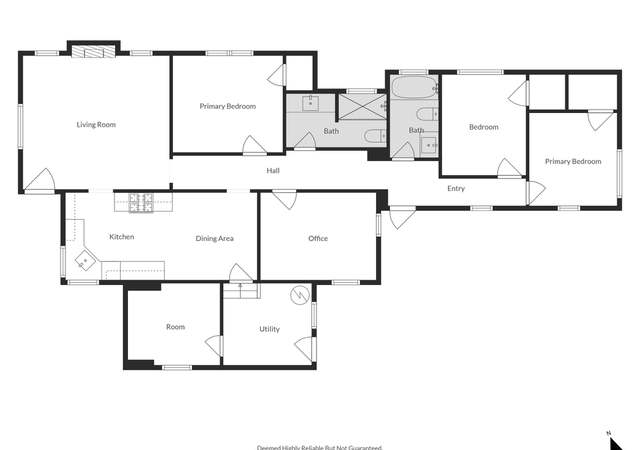
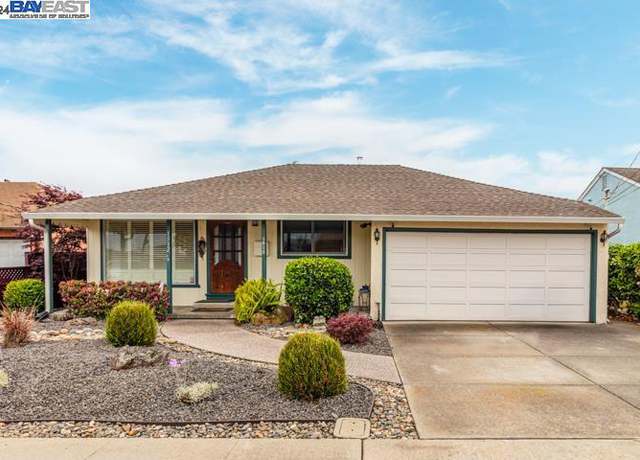
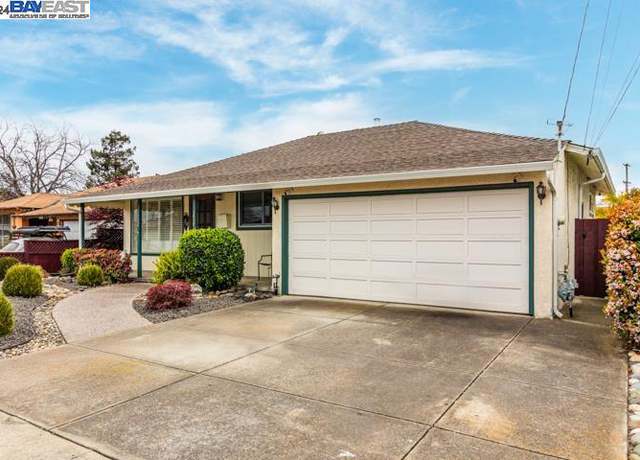
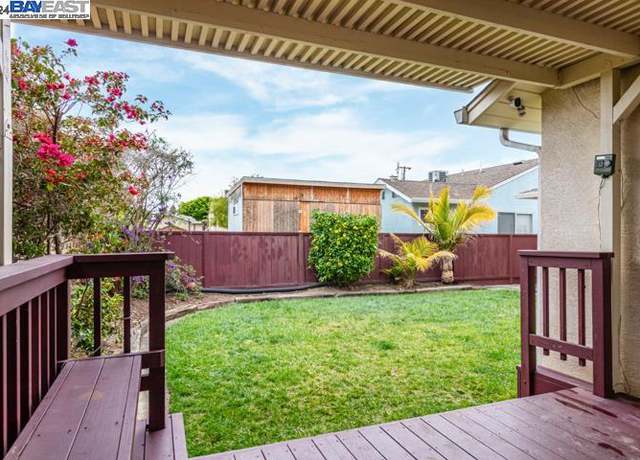
San Leandro single story home has been tastefully renovated. Features include an open floor plan with lots of natural light. Home features updated kitchen with quartz counter tops, new appliances, recessed lights, new LVP flooring throughout the home. Good size backyard perfect for entertaining and relaxing. Prime commuter location close to BART, Hwy 880 & 580. MUST SEE!
Check this out! This home has a wonderful layout with 3 Bedrooms, 2 Bathrooms, Living Room and a Family Room with a beautiful Wood Beam Ceiling! The Kitchen has granite counters and new stainless steel vent hood. This home has a drive through garage and a workshop in the backyard! The yard is perfect for entertaining family and friends. Located in a well established neighborhood near schools, parks, grocery stores, restaurants, and Highway 880. Do not miss out on this one. Professional Photos to Follow. Welcome Home!
Come see this great Bonaire home! You are welcomed by the inviting, low maintenance front yard and wide front porch. Step inside to see the many other features of the home that includes can lights, hardwood floors, dual paned windows, and plantation shutters. The remodeled kitchen boasts an abundance of cabinets with soft close drawers, granite counter tops, stainless steel appliances, a double oven, and a convenient counter that leads to the spacious family room with contemporary gas burning fireplace. The home also has updated bathrooms, a covered patio and lawn area in the backyard.
Beautiful Bay-O-Vista single level home with spectacular sweeping bay, bridge and downtown views! This corner lot gem offers breathtaking Bay Area vistas from every angle, courtesy of its abundant windows and glass doors. Recently renovated, the kitchen boasts stainless steel appliances and sleek quartz countertops. Entertain in style with a formal dining room and cozy living room featuring built-in bookcases and a charming brick fireplace. Hardwood floors gleam under freshly painted interiors and exteriors, bathing the space in natural light. With 3 bedrooms and 3 full bathrooms—including a luxurious primary suite and a convenient Jr. Suite which is perfect for multi generational fam
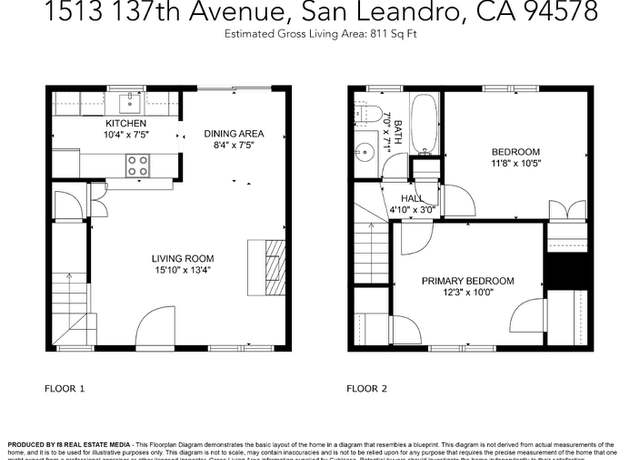
Welcome home to this charming 2 bedroom, 1 bath, condo with 811 sq ft of well-appointed living space. You will love this desirable two-story floor plan which offers no neighbors above or below. The first floor features an inviting family room with a fireplace, a separate dining area, a kitchen with great counter and cabinet space, indoor laundry, and a private back deck perfect for entertaining or relaxing. Upstairs you'll find two bedrooms and a beautifully updated bathroom. Parking is convenient with a dedicated spot near the back door and ample street parking. The private storage unit ensures you will have plenty of room for your belongings. Located near schools, shopping, restaurants, a
Traditional & beautiful Tudor with a splash of extra touches, improvements & additions! Nestled in the coveted area of Estudillo Estates, a neighborhood known for tree lined streets, vintage homes & involved neighborly interactions among those who live here. Truly a gem from start to finish, this home offers both original & new hardwood floors, large picturesque wood windows, rolled barrel ceiling & some original 1930’s fixtures. Spacious formal rooms mixed with quaint sitting areas, niches large elevated bedrooms including primary bedroom suite. Additional family room with vaulted wood ceilings, includes 1/2 bath, redefined hardwood floors and view of re
This is it, this is the one. Recently updated investment opportunity in prime location - Castro Valley/San Leandro border. A gem not to be missed by the savvy investor or multi families desiring to live together, but in their own space. Potential beautiful view of the bay (with a deck build). Tranquil setting with easy access to the vibrant Bay Area. Upstairs (street level) is the main unit with 3 bedrooms, 1 bath, dining room, laundry room and a patio off the living room sliding door. Downstairs is a 2 bedroom, 1 bath unit with its own full kitchen, dining and living room. Plenty of room for storage and/or expand the downstairs unit to a 3 bedroom. Set yourself up for success and call 1692
Beautiful home in San Leandro Manor district. 2251 square feet with 5 bedrooms and 3 bathrooms in a waterfront community. Large villa with reasonable and comfortable layout, simple decoration, durable, elegant, not fancy. Located in the Heron Bay community with beautiful environment and convenient life, it is not only the dream home of younger generation, but also a spacious home for three generations living together. The first floor bedroom and a full bathroom is a perfect fit for seniors. Enjoy easy access to the Marina, a variety of restaurants, the golf course, Heron Bay Trail/Access Point, and the Hayward Regional Shoreline. It is definitely the first choice for home ownership and luxu
Don't miss this charming 1930's Tudor- inspired home with room to grow! Old-world charm meets modern convenience in this adorable home nestled in the coveted West Broadmoor/ Farrelly Pond neighborhood. Step inside and you'll be greeted by a cozy coved entryway highlighted by original details; beautiful matchstick wood floors, a wood-burning fireplace & spacious living spaces throughout. The living room is the heart of the home; connected to the dining area, it's perfect for gatherings and entertaining. The well-appointed kitchen boasts modern appliances, ample cabinet space, quartz countertops, and an eat-in breakfast nook. Open the back door to the side yard, perfect for morning coff
Nestled in the desirable Heron Bay neighborhood, this 2 story home has 4 bedrooms and 2.5 baths. As you enter this beautiful home, you'll be greeted with the natural light highlighting the kitchen, dining and living room. Gather around the cozy fireplace in the living room, or enjoy culinary delights in the well-appointed kitchen with spacious countertops and wood cabinets. As you walk up to the second floor, you'll first approach the welcoming loft area that can be used for many things like: a bedroom, office, or play area. Two additional bedrooms offer comfort and privacy for family members or guests, each appointed with ample closet space and easy access to a beautifully appointed full b
Come see this charming home in the Bonaire neighborhood. Step inside to find a host of recent updates, including a brand new roof, gutters, a new screen door, freshly painted interior and exterior, and a new garage door and opener. The new kitchen flooring is complemented by the gleaming refinished hardwood floors throughout the living room and all the bedrooms. The modernized bathroom features a new tub, shower surround, vanity, and floor. Outside the home has established landscaping.
Come and experience peace and quiet living at a very affordable price. This unit is easily accessible, located immediately at the entrance to the complex. It consists of 2 bedrooms 1 bath located on the 2nd floor with no downstairs neighbors, inside washer and dryer, Cathedral ceilings, one car garage and 1 assigned covered parking space, and an additional storage unit. It is centrally located within walking distance to Bayfair Center Shopping Mall, Movie Theater, and Bay Fair Bart Station. Also, very close access to all main freeways. HOA covers water and garbage. Don't let this opportunity pass you by.
Welcome to this Charming , well taken care home! 3 Bedrooms 1 Bath, Single family Home located in the heart of San Leandro. This cozy home offers a perfect blend of comfort and convenience, ideal for first time home buyers, investor or small family. Upon entering you are greeted by a warm and inviting living room. The home Features an updated kitchen and newer appliances and a cozy dinning area. The 3 Bedrooms offer natural light, recently painted in and out. the Bathroom is well- appointed. Outside you will find a nice water fountain to enjoy the California Sunshine. Located within walking distance from Bart, the mall, movies and public transportation. Easy access to Hwy. * * * Come and
Excellent Opportunity for 1st time Buyer or Savvy Investor! Townhouse Style 2Bd/2Ba with 1179 sq ft of well-designed Floor Plan. New Paint / Carpet / Refinished Bathrooms / Updated Electrical Receptacles / New Flooring. 14739 Harold is an End Unit in an 11-unit complex which also features a Private Driveway with an Oversized Detached 2-Car Garage.
Must check ! Move in ready home is located in the desirable Washington Square area. Kitchen was remodel and done in 2020. brand new SPC water proof flooring on upstairs. This home offer 6 bedrooms 3 full Barth room. Very convenient location to shopping center, public transportation, close easy to access freeway.
Honey Definitely Stop the Car! Great Home with Great Large Lot! Build an ADU, Rent main house and Live in the Other! Long driveway, ample parking!. Close to shopping, BART station, Freeway Access! Complete Remodeled Home. The location, shops and restaurants, groceries. This house is warm and inviting. The living room features new flooring, and brand new dual pane windows. What a great house! Right in the heart of beautiful San Leandro.
Great duplex all newly updated ready move-in condition. This is a perfect opportunity for buyers to live in one unit and rent out the 2nd unit for extra rental income. Both units have one bedroom and a den which can be potentially be use as a 2nd bedroom. The duplex is conveniently located on E14 where it's step away from public transportation yet it's also set back on a 2nd private street with plenty of parking and away from the busy street.
Discover a hidden gem nestled in the heart of San Leandro at 1940-1942 Placer Drive. This charming duplex boasts an unbeatable location with breathtaking views of the San Francisco Bay, making it the perfect investment opportunity or an ideal owner-occupied residence. The property features a one-bedroom/one-bath unit on the first floor, ready for new owners or renters to move in, and a two-bedroom/one-bath unit on the second floor with long-term renters in place Situated in the desirable Hillcrest Knolls neighborhood, this property offers the best of both worlds – a tranquil suburban setting with easy access to the vibrant Bay Area. Immerse yourself in the local culture and enjoy the
.3 bedrooms, 2 full baths, enclosed screen rooms. New paint interior, new laminated floor in living room, dining room, kitchen. Carpet for bedrooms. Newer kitchen. Master bedroom includes walk-in closet, bathroom with sink & vanity. Dining area with built in hutch, Laundry closet with washer & dryer that stay, kitchen appliances stay. MOVE IN CONDITION. Park amenities include Clubhouse, Card Room, Library, Exercise Rooms, Pool & Spa. FLEX Shuttle bus stop inside Park. Age restrictions apply, one must be 55+, NO ONE UNDER THE AGE OF 18. Park approval required, proof of income - 3 x rent space & good credit. Must be primary residence.
Welcome to 14634 Darius Way in San Leandro's Hillcrest Knolls neighborhood. Situated on a tranquil cul-de-sac, this home sits on a large lot with views of the peninsula hills and a private backyard. Inside you'll find a bright and airy living room with the dining room and kitchen opening onto the beautiful and newly built deck. There are two bedrooms upstairs and a third on the entry level. This level also has a large common room, a room ideal for a home office or crafts, laundry, and storage. The backyard is very spacious and includes a three-car garage with a storage loft. The garage is full of potential to operate a workshop, or possible conversion to an ADU.
Discover this unique, single-story home tucked away on a generous corner lot, boasting an expansive layout. Featuring 3 bedrooms, 2 bathrooms, a spacious living area with a charming fireplace, and a distinct dining space – but that's just the beginning. Prepare to be amazed by the sizable family room extension and a additional large bonus room, which can be used as a fourth bedroom, a multi-generational setup, or a versatile office or work space. In the primary bedroom, escape to your own private patio that leads to a sizable backyard, perfect for outdoor leisure and gatherings in a private setting. Enjoy the newly renovated bathroom that exudes modern sophistication. Additional recen
Completely redone 3 bed, 3 bath home in one of Oakland’s most historic districts! This Sheffield Village stunner has been completely remodeled and features two primary suites, ideal for multi-generational living. Everything is brand new! New flooring and windows. New acrylic stucco exterior. Fresh interior and exterior paint. Beautifully remodeled kitchen with new appliances and bathrooms. New HVAC and heater. New tankless water heater. New LED recessed lighting. Upgraded 200 amp electrical service with an EV charging outlet already installed in the garage. Take in the serene setting from the generously sized redwood deck in backyard. Sewer lateral compliant and City of Oakland sidewa
Transparently Priced Cosmetic Fixer in one of the best neighborhoods of San Leandro. Welcome to 853 Begier Avenue in desirable Estudillo Estates, with neighborhood block parties and a strong sense of community. Located on a beautiful tree-lined street with blooming camellias, you are sure to fall in love with this home. This 4 bedroom / 2 bathroom 1650 sq ft Timeless Tudor presents a unique opportunity for a savvy buyer. The living room offers a large picture window, hardwood floors, a cozy fireplace, and vaulted ceilings. Through the living room you will find informal and formal dining spaces with built in cabinetry and bay windows. The large kitchen has exterior access to the yard w/ newe
Perfect location to 880 and around one corner is for commuting on Bart, Station is 5 mins away for walking, car or bike, and the other corner is Grocery (Safeway), Brewing Company and Alehouse, Bakery Cafe and Baskin Robbins, Yoga Club, Tequila Bar and Grill, Taqueria, Banking and Farmers Market. WOW. .. Hospital and Library too! This 2 bedroom 2 bath Condo is in the best spot and includes a pool, clubhouse, gym, under building parking and secured entries. Your unit comes with fireplace for cozy nights and a covered patio balcony that has a wooded nature view. HOA covers water and trash as well. This condo is the epitome of convenience. Don't wait too late.
Newer manufactured 3 bedroom, plus a den, 2 bath home in the desirable Mission Bay community. Freshly painted interior and exterior. New flooring thru out. Living room with vaulted ceilings open to the dine area and kitchen. Breakfast area in the kitchen with lots of natural light. Den, great for a home office, or retreat area. Primary bedroom with primary bath, featuring dual sinks, stall shower, walk in tub, and lots of linen storage. Enjoy morning coffee on the newly redone front porch. Large storage shed at the rear of the carport, A/C and lots more.
Beautifully maintained, this two-story single-family residence boasts five bedrooms, three bathrooms, and 2255 sqsf of living space, all nestled in the desirable Marina Vista neighborhood. Constructed in 1998, it features high vaulted ceilings and expansive windows that flood the interiors with natural light. The first floor offers a separate entrance leading to a bedroom and full bathroom, ideal for seniors or easily adaptable for an ADU. Conveniently situated close to parks, the BART station, the 880 freeway entrance, Costco, and a supermarket, the allure of this home guarantees a quick sale!
Welcome to 16542 Toledo St in San Leandro, a completely remodeled 4 bedroom, 3 bathroom two-story home nestled in the San Leandro Hills, offering a breathtaking panorama of the San Francisco skyline and peninsula. Spanning over 2100sqft, this updated gem boasts a brand new large kitchen equipped with stainless steel appliances, cabinetry, and countertops. Hardwood flooring gracefully adorns the interior, complemented by fresh tile in the bathrooms. The bathrooms have been fully renovated, featuring a primary bath with dual sinks. Bedrooms exude spaciousness, natural light, and generous closet space, ensuring a comfortable living experience. A freshly painted interior and exterior gives the
Views, views, views! Step into this well loved home that boasts panoramic views of the Bay throughout. Generously proportioned floorplan highlighted by a large gourmet kitchen that comes with quality Fieldstone custom made cabinets, Sub Zero refrigerator/freezer, 6 burner Wolf stove, 2 ovens, 2 sinks, 2 dishwashers and ample cabinet storage. A stately primary suite with retreat and an enormous family room has equally impressive views on the lower floor along with wet bar and multiple patios and balcony for leisure living or entertaining. Truly the perfect home for creating lasting memories in quiet moments or bustling parties. Don't miss the chance to make this your new dream home!
Welcome to The Willow Townhomes gated community nestled in the heart of Washington Manor. This property has 2 assigned parking spaces and in an FHA approved community. With an abundance of natural light, the open layout of the living spaces creates a bright and inviting atmosphere. The spacious kitchen has been beautifully upgraded with elegant countertops, a modern backsplash, stylish cabinets, and stainless steel appliances. The dining area is spacious enough for large gatherings or intimate dinners for two. The living room features updated flooring and is generously sized to accommodate even the largest furniture. The bedrooms are generously sized and updated with custom closets, includi
A townhome-style condo in the Old San Leandro neighborhood that is in a private setting yet offers all of the urban conveniences. This end-unit, light filled townhome is a short walk to downtown shopping, restaurants & cafes. It is also within walking distance to the BART station. This home has been extensively remodeled and is in move-in condition with an updated kitchen, luxury vinyl plank floorings, washer/dryer inside the unit, 2-car garage. Large master bedroom and private fenced-in backyard. Energy efficient amenities include double-pane windows and LED recess lights throughout. This is also a great investment property with plenty of eager renters for its convenience & tra
Lovely Top Floor Unit featuring 2 bed, 1.5 bath with beautiful views! Light & bright throughout. Updated home, nicely painted in neutral colors and ceilings fans for a cool breeze. Kitchen with plenty of cabinets, granite counters and breakfast bar. Entertain or relax while dinner is cooking with this great open floor plan . Enjoy the spacious primary bedroom with closet and attached bathroom. Gated complex includes a community pool too. There is a permitted parking spot as a designated parking garage with additional cabinet storage and plenty of visitor parking. Convenient commuter access to 580, as well as shops and restaurants etc. Come take a look soon!
$489,900
2 beds1.5 baths947 sq ft
16389 Saratoga St Unit 305E, San Leandro, CA 94578
Inviting 3beds/2 baths new built in 2006 with owned solar system, central heating and AC, central vacuum system, stainless steel appliances, granite counter top, hot tube in nice entertainment room, low maintenance front back and side yards. Easy Access to Freeways, Shopping, Kaiser Permanente Hospital & Medical Center, Parks, Post Office, Library, Restaurants, Public Transportation, B. A. R. T. , San Leandro Marina & Golf Course & More.
Great opportunity to own a home on a 1/2 acre lot with lots of potential. The long driveway leads to a garage and workshop at the end of the backyard. Potential of adding multiple ADU's to generate income or for an extended family. The interior consists of large living room, 4 spacious bedrooms and 3 full baths. Surrounded by trees and a creek so you get tons of privacy. Almost feels like you are in a different world because it is so peaceful. Close proximity to Lake Chabot, shopping, 580 and 880 freeways. Don't miss out on this great opportunity!
Opportunity awaits! This San Leandro mobile home makes home ownership attainable! Featuring 1 BR/1 BA, 528 sq ft of living space, new carpet, covered porch with permits and fire retaining wall creating additional space for your heart's desire, central heating, wall cooling, in-unit washer/dryer hook-ups, newer shower and water heater, ceiling fan, large closet and storage space. Situated in a family and pet-friendly ALL-AGE Trailer Haven community. Super commuter friendly with I-580 & I-880 at your fingertips. Conveniently located to restaurants, shopping centers, schools, BART, and all the essentials!
Experience the lifestyle of the highly coveted Marina Faire neighborhood of San Leandro in this single story 3 Bedroom / 2 Bathroom, 1,128 living sq. ft. home! Amenities include luxury vinyl plank flooring & Milgard dual pane windows throughout. Open concept kitchen with quartz countertops, newer appliances, with an adjoining dining area. Spacious living room which looks out to the beautifully landscaped backyard great for entertaining. This rare contemporary ranch style home has low maintenance front and back yards with mature lemon, lime and other fruit trees in the back yard, with a partially enclosed front yard with artificial grass. Easy walking distance to the San Leandro Marin
#RV-Parking #Additional-Unit #New-200AMP-Panel Discover sophistication and utility in the heart of Floresta Gardens, one of San Leandro’s most desirable neighborhoods. This refined home boasts polished hardwood floors, a two-car garage, and enhanced RV/boat parking with a driveway and double gate. Modern living is guaranteed with an upgraded 200 amp electrical panel and a versatile 500 SQFT legally permitted detached unit in the backyard. Situated for supreme convenience, the property offers easy access to Highways 880 and 238, and is moments away from the Greenhouse Marketplace with includes Safeway for your dining and shopping needs. Additionally, it’s within a short distance
Welcome to the spacious and stylish condominium at Bella Vista Gardens! This gated community offers a comfortable living experience with modern amenities and convenience at your fingertips. Step inside to discover an open living room seamlessly connected to a charming balcony, perfect for enjoying the California sunshine. The kitchen has been beautifully updated with granite countertops, stainless steel appliances, and stylish flooring, creating an elegant and functional space. Storage is plentiful with built-in cabinets throughout, and the bedroom features two custom-designed closets for added convenience. Parking is a breeze with one assigned space included. Outside, you'll find a pristin
Introducing an exceptional investment opportunity: a meticulously maintained five-unit multifamily property nestled in the desirable Halcyon neighborhood of San Leandro, California. This property boasts a total of 3,196 square feet of living space, situated on a 0.15-acre lot. San Leandro, a historic city in Alameda County, enjoys a prime location on the eastern shores of the San Francisco Bay. From its roots as an agricultural community in the mid-19th century, San Leandro has flourished into a vibrant suburban destination. Renowned for its strategic positioning near key transportation arteries such as Interstate 880 and the Oakland International Airport, the city has emerged as a thriving
This area's enrollment policy is not based solely on geography. Please check the school district website for more information.
Elementary schools
Middle schools
High schools
GreatSchools Summary Rating
6/10
McKinley Elementary School
Public, K-5
6/10
Madison Elementary School
Public, K-5
5/10
Washington Elementary School
Public, K-5
5/10
Bay Elementary School
Public, K-5
5/10
Roosevelt Elementary School
Public, K-5
Only showing 5 of
20 elementary schools.
School data is provided by GreatSchools, a nonprofit organization. Redfin recommends buyers and renters use GreatSchools information and ratings as a first step, and conduct their own investigation to determine their desired schools or school districts, including by contacting and visiting the schools themselves.Redfin does not endorse or guarantee this information. School service boundaries are intended to be used as a reference only; they may change and are not guaranteed to be accurate. To verify school enrollment eligibility, contact the school district directly.
Homes for sale in San Leandro have a median listing price of $769K. Some of these homes are Hot Homes, meaning they're likely to sell quickly.
What are some of the most popular neighborhoods in San Leandro?
Popular neighborhoods include Old San Leandro, Davis, Downtown San Leandro, Central East Oakland, Washington Manor, Bay-O-Vista, Chabot Park, Farrelly Pond, Heron Bay, and Northeast San Leandro.
San Leandro, California offers a variety of transportation options for its residents. The city is well-served by public transportation, including buses and BART (Bay Area Rapid Transit), making commuting without a car feasible. For those who prefer driving, traffic levels can vary, with peak hours often experiencing higher congestion. Additionally, San Leandro is conveniently located near several major highways and freeways, including Interstates 880 and 580, providing easy access to neighboring cities. Learn more on our San Leandro city guide.
What types of properties are available in San Leandro?
San Leandro, California offers a variety of single-family home types, including ranch-style, split-level, and contemporary homes, among others. These homes can be found throughout the city, with many located in established neighborhoods and newer developments. Most properties feature 2-4 bedrooms and were built between the 1950s and present day. To explore different property types for sale in San Leandro, California, use the 'Home type' filter located above the active listings. Customize your search by selecting options like single-family homes, condos, townhomes, and more.
What is life like in San Leandro?
San Leandro, California offers a vibrant and dynamic living experience. The city boasts a picturesque landscape with a mix of urban and suburban areas. The weather in San Leandro is characterized by mild winters and warm summers, providing a comfortable climate all year round. The city is home to a range of job opportunities, with a diverse economy that includes industries such as technology, healthcare, and manufacturing. Residents can enjoy a variety of recreational activities, including exploring local parks, hiking trails, and engaging in community events and cultural festivals.
What are the schools and amenities like in San Leandro?
San Leandro, California is a vibrant city equipped with a variety of public amenities. The city boasts a multitude of restaurants offering a diverse range of cuisines to satiate your taste buds. For those who enjoy the outdoors, there are numerous parks scattered throughout the city. Grocery stores are conveniently located across San Leandro, ensuring easy access to daily essentials. Additionally, the city offers other amenities such as libraries, fitness centers, and shopping centers to cater to the varied needs of its residents.
In the past month, 38 homes have been sold in San Leandro. In addition to houses in San Leandro, there were also 21 condos, 9 townhouses, and 5 multi-family units for sale in San Leandro last month. San Leandro is a moderately walkable city in Alameda County with a Walk Score of 65. San Leandro is home to approximately 85,111 people and 38,273 jobs. Find your dream home in San Leandro using the tools above. Use filters to narrow your search by price, square feet, beds, and baths to find homes that fit your criteria. Our top-rated real estate agents in San Leandro are local experts and are ready to answer your questions about properties, neighborhoods, schools, and the newest listings for sale in San Leandro. Our San Leandro real estate stats and trends will give you more information about home buying and selling trends in San Leandro. If you're looking to sell your home in the San Leandro area, our listing agents can help you get the best price. Redfin is redefining real estate and the home buying process in San Leandro with industry-leading technology, full-service agents, and lower fees that provide a better value for Redfin buyers and sellers.


 REDFIN IS COMMITTED TO AND ABIDES BY THE FAIR HOUSING ACT AND EQUAL OPPORTUNITY ACT. READ REDFIN'S FAIR HOUSING POLICY AND THE NEW YORK STATE FAIR HOUSING NOTICE.
 United States
 Canada