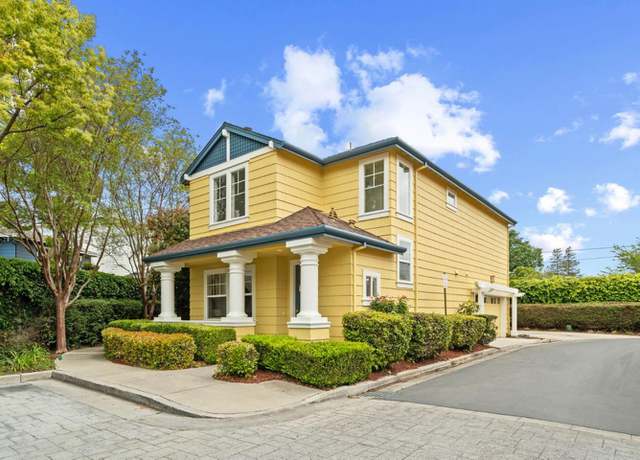
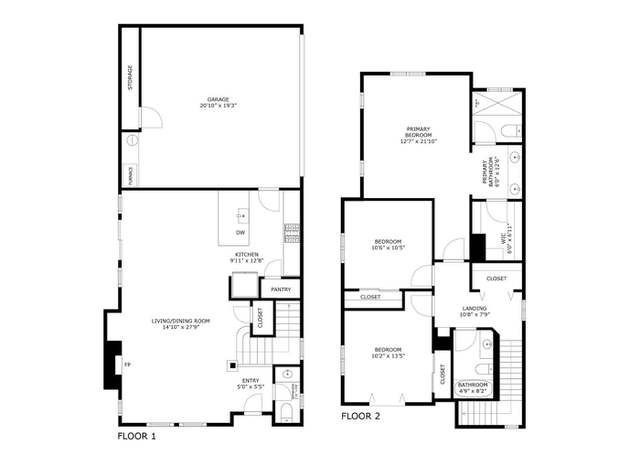
Welcome to 73 Cannery Circle! Located in charming downtown Campbell and steps away from numerous restaurants, parks, Los Gatos Creek trail, ample shopping options, and weekly Sunday farmers market! Updated throughout in 2024, the home features a spacious living room with vaulted ceilings, fireplace and tons of natural light, dining area with patio access, and a gleaming kitchen with quartz countertops, a spacious pantry, and brand new stainless steel appliances, convenient access from kitchen to 2 car garage. A ground floor powder room is located adjacent to the living room. Upstairs are 3 spacious bedrooms and 2 full and completely updated bathrooms including floor to ceiling tile surround
Completely Renovated and expanded Single Story Home in the heart of Campbell. Located in a quiet Cul de Sac, this home offers wonderful curb appeal with covered front porch. As you step in, you will discover luxurious designer touches including wide plank flooring throughout the entire home. This home offers formal living room with wood burining fireplace, stunningly remodeled gourmet eat-in kitchen with designer painted cabinetry, professional stainless steel appliances, sleek quartz counters with designer tile backsplash. Huge separate open layout family/great room w/ large sliding door opens up to huge private 8,000plus sf lot offering endless potential including expansion of home or sep
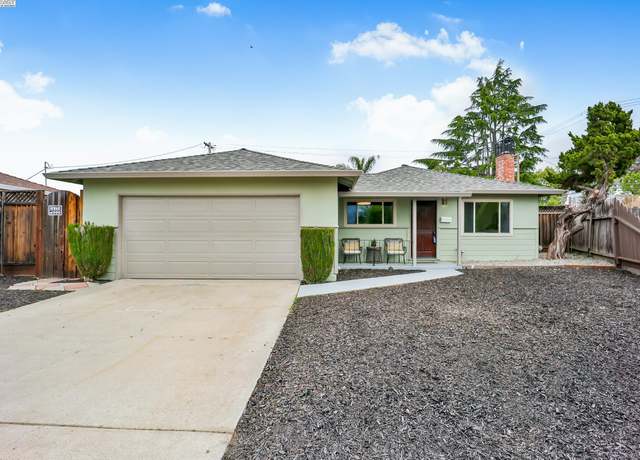
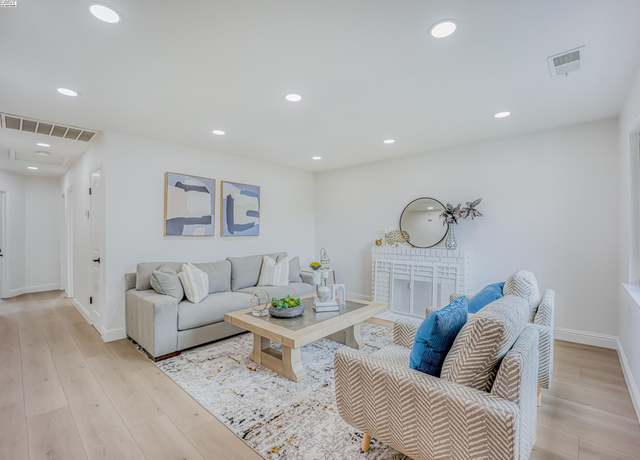
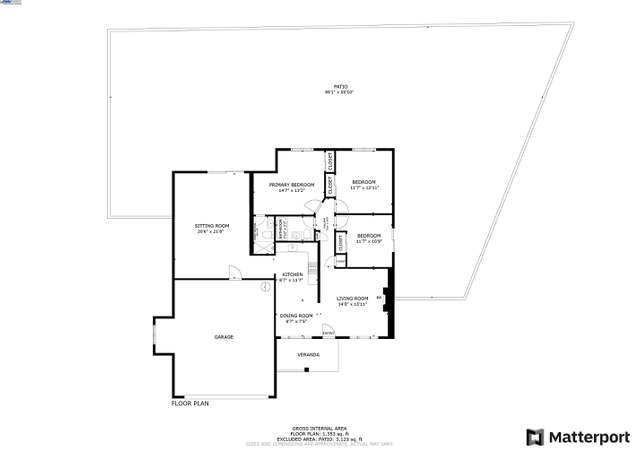
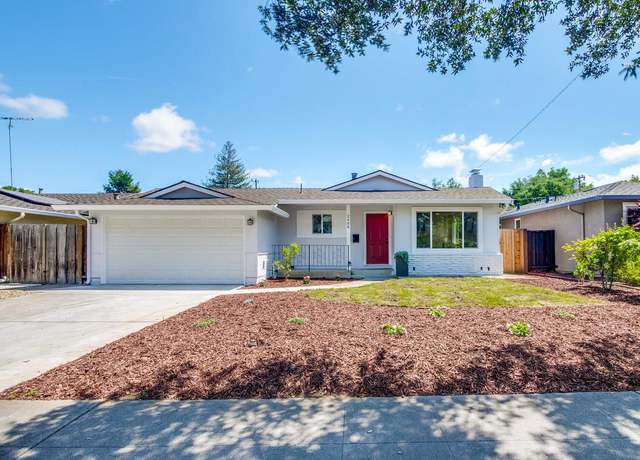
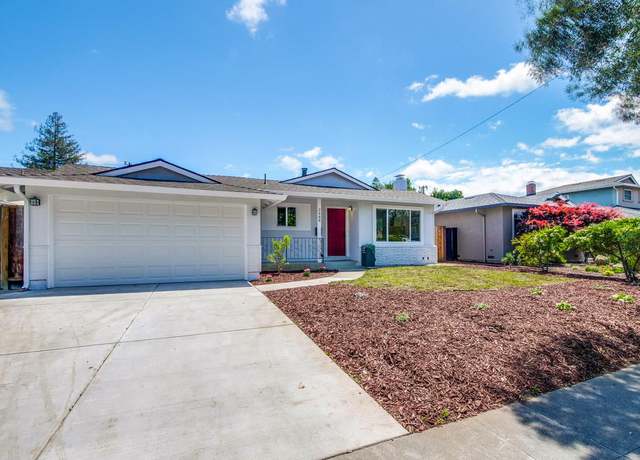
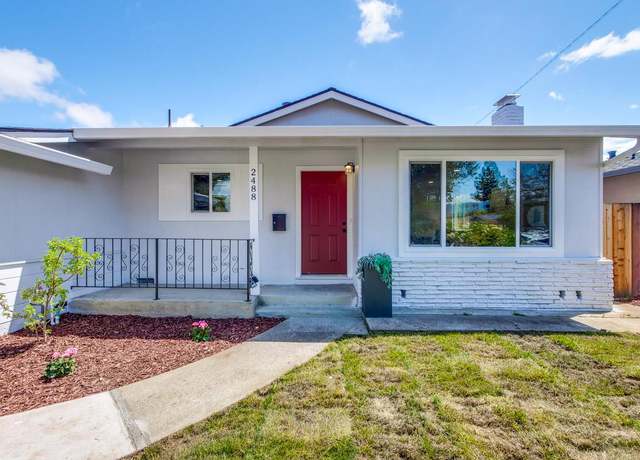
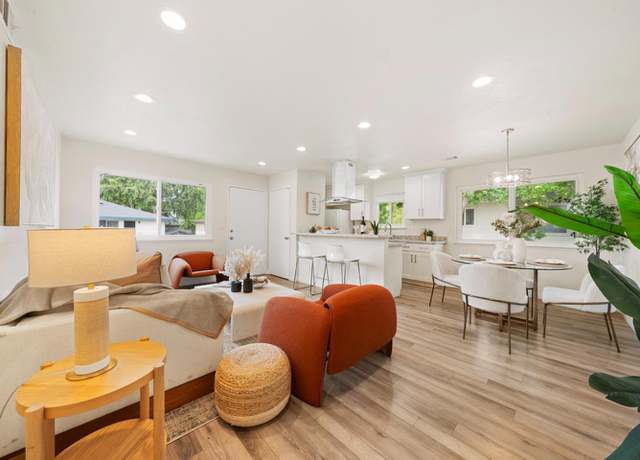
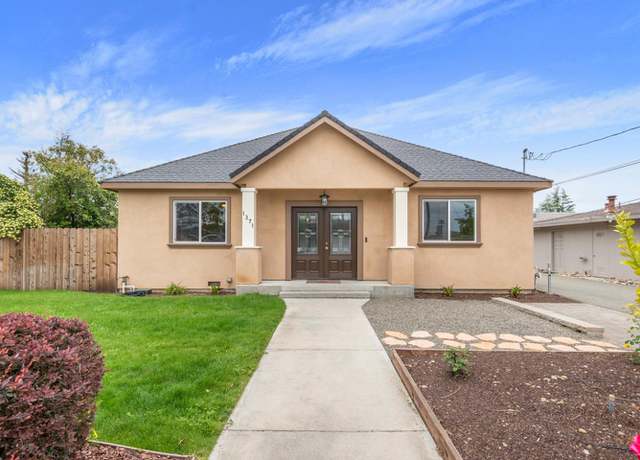
A hidden gem in sought after West San Jose neighborhood, boarding with Saratoga and Campbell, this fully renovated 3 bedroom/2 bathroom residence offers the perfect combination of modern luxury, convenience, and comfort. Spacious living room with fireplace and large window, all new stainless steel appliances, countertops and cabinets at the new kitchen provide high quality family time and carefree enjoyment. Completely updated bedrooms/bathrooms offer each family member peace of mind and deep relaxation. Newly painted exterior wall, professionally landscaped front & back yards, new garage door and newly painted garage floor make this charming house ready to move in from every aspect. I
This sought-after top-floor end unit offers a fantastic single-level layout with numerous upgrades, nestled in a desirable community on a tranquil, tree-lined street just a stroll away from charming downtown Campbell. Featuring an abundance of sunlight and a private balcony, the laminate flooring, recessed lighting, and kitchen with breakfast bar create an inviting space. The freshly painted interior includes double-pane windows, central heating, and A/C. Each bedroom boasts Japanese-style double bypass closets, meticulously designed for enhanced functionality and aesthetic appeal. This unit comes with one covered carport space, two large storage closets, and direct access to laundry facili
This tastefully remodeled single-story residence sits on a sprawling 10,454 SF lot in a serene cul-de-sac. There is an oversized 3 car garage in the backyard with a side driveway for access. The gourmet kitchen boasts a Viking gas stove, stainless steel appliances, quartz countertops, and a touch faucet. Beautiful real hardwood floors are throughout most of the home. This home has a total of 3 bedrooms, two of which are exquisite primary suites featuring walk-in closets, and spa-like ensuite bathrooms with custom showers and heated floors. The home has been thoughtfully updated with recessed lighting, double pane windows, copper plumbing and an upgraded electrical system. Enjoy peace of min
Located near Bascom Avenue shopping, Pruneyard and also close to Campbell downtown. The units are mostly long term tenants and if they should become vacant, they rent quickly.
This home has it all. 3 Bedrooms and 2.5 Baths, with 1577 sq. ft. All new paint and upgraded Bathrooms. A huge Greenbelt just outside your patio only for the Townhome owners usage. Attached 2 car garage with a large Driveway big enough for 4 cars alone. Master bedroom is 25 feet long. New water heater and insulated Garage Door are a bonus. Closet organizers and crown moulding make this a home not to miss. The location is central for an easy commute anywhere. This townhome is located in Campbell and has Campbell services but does have a San Jose mailing address. No City Transfer Tax.
Welcome to this light and bright home in the amenity-rich Rinconada Hills community. Soaring ceilings and a tranquil color palette greet you as you enter the door. The kitchen boasts custom cabinetry, granite countertops, stainless steel appliances, and a breakfast nook. Enjoy meaningful gatherings in the open-concept living room and dining area. The space is perfect for relaxing or entertaining with its expansive windows and lovely gas fireplace. Exit the sliding doors to your private patio and enjoy the lush landscape. A powder room is conveniently located on the main level as is an en-suite bedroom and bathroom designed for accessibility, perfect for multi-generational living or those se
Welcome to this luckiest "777" move in ready home in the highly sought-after Campbell neighborhood. This classic 4 bedroom, 2 full bath home welcomes you with an open floor plan connecting the spacious living room with wall insert fireplace, skylight - great for gatherings of any kind. Chef's kitchen with large island, 36" 5 burner gas stove, farmhouse sink. Separate family room & 4th bedroom - great for family with kids & parents. Extensive remodel throughout in 2018 with NEW kitchen, bathrooms, furnace, AC, lighting, 200amp electrical, plumbing, double attic+underfloor insulation, roof, stamped concrete driveway. .. etc and much more to list. Great Campbell scho
Original Owner! Don't miss this bright, spacious two bedroom, 2.5 bath attached single family home! Featuring new flooring, fresh paint, new sub-quartzite natural stone countertops in kitchen, all new stainless steel appliances, new toilets, central A/C and a great floorplan! The living room boasts a wood burning fireplace and vaulted ceiling, and the adjacent dining area includes a wet bar and breakfast bar. The kitchen includes a cute breakfast nook, pantry cupboard and indoor laundry area. Upstairs, you will find a large primary retreat with two large closets, high ceilings and a balcony to enjoy your morning coffee. The additional upstairs bedroom is roomy enough to also accommodate a h
Gorgeous Hamilton Place Condo! You'll love this fully remodeled, 2 Primary suites, upstairs condo! Wonderful floorplan with each suite on the opposite sides of the main living area. Stunning wide plank hardwood floors, gourmet kitchen with stainless steel appliances, custom cabinetry, and granite counters. Naturally light and bright with a welcoming balcony, overlooking the green belt and offers privacy! Vaulted ceilings, crown molding, and air conditioning. Wonderful location within the community, detached garage, pool, hot tub, and access to Los Gatos Creek Trail nearby. Conveniently located across from Whole Foods, coffee shops, restaurants, and downtown Campbell. Easy access to all majo
Move in and enjoy this stunning single-story custom home with guest residence on a large lot. 5 bedrooms. 4 full bathrooms. Rare city-approved surrounding tall privacy fence & security gate. Contractor's own dream home with every attention paid. Travertine pavers. Grand formal entry. Andersen windows, crown molding, Lutron lighting, surround sound, sound proof walls & instant water circulation system. Marble floors & baseboards. Travertine fireplace. Solid core marble columns. Stunning open chef's kitchen with granite countertops, breakfast bar & water osmosis system. Spectacular family room home theater with custom dome of sun rising/setting & stars. All bedro
Welcome to this charming 2-bedroom, 1-bathroom condo located in the desirable city of Campbell. With 840 square feet of living space, this cozy abode offers a comfortable and convenient lifestyle. Upon entering the home, you are greeted by a well-appointed living space that exudes a warm and inviting ambiance. The enclosed patio is a delightful addition, providing a private outdoor retreat where you can unwind. Located in the heart of Campbell, this home offers easy access to the downtown area, renowned for its charming atmosphere and a variety of dining and shopping options. The year-round farmer's market is a local favorite, showcasing fresh produce and artisanal goods. Conveniently situa
This stunning end-unit TH, nestled within the highly sought-after Los Gatos Woods Community, offers a blend of modern elegance & functional comfort. As you step inside, you're greeted by an inviting open floor plan illuminated by tons of natural light & exposed beam vaulted ceilings. The LR exudes warmth w/ its cozy wood-burning fireplace, complemented by custom built-in shelving & a dry bar equipped w/ 2 wine fridges. Vibrant hardwood flooring flows seamlessly from the living space to the beautifully updated kitchen/dining combo, where marble counters, SS appliances, ample cabinetry & a pantry boast style & convenience. Sliding glass doors effortlessly connect
Brand new Construction, 4 Bedroom, 4 Full Bath, Open Floor Plan, Stainless Steel Appliances, Split System Heating and 5 Ton A/C, Double Pane Windows, LED Recessed Lighting, Walk-In Closet, Double Vanities, Eat in Island, Engineered Oaks Hardwood Floor Entire house, Fire Sprinklers, 220V EV Charging ready in the Garage, Guest Parking, Inside Laundry Room, Close to Freeway and Expressways, Centrally located with convenient access to Shops & Restaurants, Close to Campbell Down Town, Close to John D Morgan Park, Close to Valley Fair, Close to Santana Row,
Charming mobile home in sought-after 55+ community. This remodeled home is nestled on one of the most coveted locations within the highly desirable Quail Hollow Park. The flowing floorplan with 1,457 sq ft of living space is flooded with natural light & includes 2 bedrooms, 2 baths, spacious living room, dining room, lovely kitchen, family room, & patio room (not included in SF). The bright living room is graced with huge picture windows & cathedral ceiling with open beams- an ideal spot to watch the outside world. The kitchen with island boasts NEW quartz counters, freshly painted cabinets, a NEW stovetop, & bar seating. Each bathroom has been nicely remodeled. Other
Excellent Corner unit townhouse. Light and bright. Private entry. Freshpaint, granite counters. Kitchen featuring new stove. New carpet. Shows beautiful. A must see. Priced to sell. 3 spacious bedrooms. Location quiet. Close proximity to Apple , Netflix campuses, besides shopping, farmers market & restaurants. Walking distance to schools. Forest Hill, Rolling Hills, Westmont. Buyer to confirm schools. Excellent distinguished schools. Enjoy the festivals iin Los Gatos & Campbell downtown. 3D Tour available.
Located on one of the South Bay's most coveted streets, you will love the character of this charming home at 960 Dry Creek Road. A grand 12-foot-tall foyer leads to the impressive living room with open beam ceilings, a beautiful wood burning fireplace and luxury wide-plank hardwood floors. The dining area, overlooking the colorful flora of the front gardens, is perfect for special occasions and holidays. The eat-in kitchen is uniquely finished in knotty-pine wood. Two of the three bedrooms are en suite with tile showers and extra storage closets. This 3 bed, 3 bath 2,279 sf home is energy efficient with 14 solar panels. With this 14,996 sf lot, you'll have plenty of room for all your family
I present to you for the first time to be sold 810 Virginia Court. This beautiful Campbell home is a time capsule, as it was built in 1960, and only had one owner. This home features 3 bedrooms, and 2 bathrooms, has an open floor plan, and has white-oak hardwood floors throughout the home that were carefully covered by carpet. Situated on a premium lot at the end of a cul-de-sac, this home has a huge backyard, complete with patio space, and a side yard. There is even room to build an ADU, add on, or even a swimming pool. The floor plan is very open, and from the kitchen you can step down into the family room, complete with a brick hearth and fireplace. All of the plumbing has been replaced
Exquisite home in desirable Campbell area exudes elegance and charm in a cul-de-sac. This 4-bed, 3.5-bath home spans 3445 sq. ft. , nestled on a 9148 sq. ft. lot w/ a 3 car garage w/ ample storage space. You are greeted by high ceilings, freshly painted interior, recessed lighting throughout. The grand foyer flows seamlessly into the spacious living area, adorned with a fireplace. Updated kitchen includes cherry dovetail cabinets, granite countertops, stainless-steel appliances w/ ample counter space. First floor boasts gorgeous hardwood floors, while the second floor is carpeted w/ a large den area w/ an entrance to a serene deck. The primary suite is a sanctuary of luxury w/ a balcony, fe
Welcome to 1724 West Hacienda Ave in the heart of Campbell. This elegant custom home seamlessly blends luxury with privacy and tranquility. Nestled on a quiet street and ideally situated in a sought after neighborhood that borders Saratoga, Campbell & Los Gatos. This beautifully remodeled single-story home features 4 spacious bedrooms and 2.5 updated baths with nearly 2,600 sq. ft. of living space on a large lot that is over 10,000 sq. ft. ! Open & bright floor plan with hardwood flooring, high ceilings, private & tranquil backyard oasis with expansive deck perfect for entertaining on those warm summer days. Spacious family room offers a seamless transition for inside/out
New list! Top-quality remodeled home. Expanded ~960sf in 2015. Maple woodfloors; custom-designed doors; sliding barn-style doors; solid-hardwood doors, crown moldings. Custom chef-kitchen features abundant maple-wood / pearl-stain cabinets; pendant-style lighting; quartz sinks; quartz-counter island. SS appliances include SubZero fridge/freezer; Wolfe double-oven; Wolfe gas range; Zephyr range-hood; Wolf microwave-drawer; under-counter wine fridge; Asko dishwasher. Living room with high ceilings; gas-fired fireplace. Family-room with gas fireplace; surround-sound loud-speakers. Primary suite has coffer accent-light ceiling; bath floor w/ NuHeat thermostat. Updated baths feature porcelain f
Total square feet of living space between the two homes is nearly 4000! Must visit to fully experience this uniquely amazing property. From the curb, one might think we have a standard ranch style house on offer. This could not be further from the truth. The main house has a family room that in and of itself is outstanding. This room contains an office, fireplace and a loft! It's the perfect space for hosting a large gathering. Combine this space with a traditionally built 3bed/2.5 bath one-level ranch home with sunroom and skylights and you have all the space you've been hoping for! The seamless flow to the outdoor spaces is beautifully inviting. Note the whole house generator as you step
Prime Development Opportunity: Minutes away from downtown Campbell Discover a rare and exceptional development opportunity in a sought-after location poised for transformation into a landmark residential project. Plans submitted for a 4,799 sqft home. This 12,750 SqFt rectangular property offers endless potential to visionary developers, investors, and builders looking to capitalize on its prime positioning and unique attributes. This property currently has a main house with two bedrooms and one and a half baths and a guest cottage with one bed and one bath, This is a developer & investor's dream!
Beautiful Rinconada Hills!! 394 Townhouses in this unique development. Maybe you think you've seen them all - and then, there's this!! Meticulously appointed 3 bedrooms and 3 full baths and YES, that much desired feature - a bedroom and full bath on the main level. Also on the main level is a wonderful large open kitchen with loads of cabinets, stainless appliances, recessed LED lighting, and black granite countertop. Downstairs open area features beautiful engineered hardwood flooring. LED recessed lighting in the living room with a gas starter fireplace, cathedral ceiling and double windows which adds loads of natural lighting. Delightful outdoor patio has a water feature to maximize rela
Move in and enjoy this beautiful and spacious 4 bedroom plus office and sunroom single-story home nestled near the Pruneyard. Spacious 9,570 SF lot. Tucked on cul-de-sac. Charming curb appeal with lawn, Japanese maple tree, pavers and brickwork. Gleaming floors. Exceptional large living/dining room and sun room spaces with great views of the yard. Large bedrooms. One of the bathrooms includes a stunning walk-in shower. Additional office den. Double-pane windows & central A/C. Large entertainer's dream backyard with great privacy, dining patios, sparkling pool, grass lawn and sheds. Attached 2 car garage plus oversized driveway. Wonderfully walkable location near Whole Foods, Pruneyard
Nestled in the heart of Campbell within a quiet, secure gated community, this end-unit condo offers a seamless blend of comfort and convenience. Step inside to discover a freshly painted interior, complemented by double-pane windows which fills the space with natural light. The updated bathrooms feature granite vanities & stone tile floors, adding a touch of sophistication to match the kitchen design. Along with stainless steel appliances, including a new, built-in microwave and dishwasher, the kitchen awaits your culinary endeavors. Retreat to the private balcony & unwind while taking in the serene views of majestic Redwood trees overlooking Stojanovich Park. Only 0.4 miles awa
Welcome to 1987 Las Encinas Ct! Nestled in the highly sought-after Los Gatos Estates Community, this impeccably updated townhome embodies a perfect blend of quality & comfort, offering an ideal floor plan tailored to meet all your needs. Upon entering, you'll be greeted by soaring ceilings & an abundance of natural light that floods every corner of the home's interior. Vibrant flooring seamlessly flows throughout the living space, connecting the living room, dining area, & beautifully updated kitchen. Stainless steel appliances, a built-in wine fridge, granite countertops, ample cabinetry, and recessed lighting bring convenience to every meal, while the two slider doors in
Tastefully renovated property in the most south after Los Gatos Woods community. The biggest backyard in complex which renovated less than 2 weeks ago fairytale-like and feels like a single family to entertain kids and guests, vegetable garden and tons of fruit trees :Fruit Trees: Flat Peach, Lemon, Citrus, ALSO on CCAR MLS#41054748 Orange, English sour Cherry , Pomegranate, Plums, Sweet cherries. Inside features are: plenty of storage rooms, 2 balconies, custom-made stair case, custom wood floors, European primary bathroom with mosaic tiles, lots of skylights, kitchen with an island and coffee-bar counter, pantries, 2 car garage and additional guest parking right on front. Property is loca
Welcome to this rare and beautifully renovated 1 BR/1BA corner unit located in the high sought after Villa Capri 55+ Community in Los Gatos. This tranquil and private second-story condo has no neighbors above. Relax on 1 of 2 balconies with a view of the pool. Recent updates include laminate vinyl plank floors, fresh paint, new appliances and light fixtures throughout. Enjoy the comfort of central heat and AC, and your own washer/dryer in the unit. The property comes with secure underground parking, a private storage unit, and community fitness center. Close proximity to Vasona Station with Purple Onion Cafe/restaurants/yoga studio and El Camino hospital. Quick and easy access to downtown L
Fantastic opportunity to own a solid 4-plex investment that is easy to rent and manage! Four 2 bedroom 1 bath units. Two units are newly updated (within 6 months) and two updated within the last 5 years. The updates include brand new kitchen, bathroom, flooring, paint, appliances, lighting. . Beautiful, spacious and open floor plan. Wall AC in all units. Rents are very low due to long term tenants. Four carport spaces and three open parking spaces that are currently assigned. Just minutes from Santana Row and Valley Fair Shopping Mall, as well as Downtown Campbell. The property is extremely low maintenance, tenants are super nice and cooperative. Conveniently located with commute access and
This charming townhouse has the best location bordering Campbell, Saratoga, Los Gatos, & Monte Sereno, as well as a short commute to Apple and Netflix campuses, offering all you need for a convenient lifestyle; it is also in close proximity to shopping centers, restaurants, the Farmers Market, and has easy access to Highway 85. District presents excellent, distinguished schools: Forest Hill Elementary, Rolling Hills Middle & Westmont High School! Home was remodeled in 2013, including updated kitchen and bathrooms, double pane windows and sliding glass doors, wood flooring, front and back patios, a new water heater from 2017 and many more features. .. A beautiful community pool an
Experience the epitome of contemporary living in Campbell! The largest layout in the community, with living area almost 4000sqft and lot size almost 10000sqft, step into unparalleled modernity with this stunning two-story new construction residence, scheduled for completion in Q3 2024. The first floor welcomes you with an expansive, light-filled layout encompassing the kitchen, dining area, and family room. A striking gallery and foyer add to the aesthetic appeal. There are two bedrooms and a full bathroom, seamlessly integrated for optimal convenience. Venture to the second level, where sophistication awaits. A master bedrooms await, featuring a generous walk-in closet and bathed in su
TOP FEATURES OF THIS HOME INCLUDE: 1- Charming top-floor unit nestled in a prime location, offering unparalleled convenience and comfort 2- Located in the heart of Campbell, this home boasts an enviable proximity to a plethora of amenities, making it an ideal choice for those seeking a vibrant lifestyle 3- The space features exquisite finishes throughout, including quartz countertops, stylish backsplash and stainless steel appliances and luxury vinyl plank flooring 5- Unit has two assigned parking spots, one under a carport 6- Outside, residents have access to a community pool and hot tub, perfect for relaxation and recreation. Additionally, there are convenient on-site laundry facilities 7
Welcome to 2857 S. Bascom Ave, #105! This centrally located condo in the gated Cedar Terrace community offers 2 bedrooms, 2 updated bathrooms and 841 SqFt of living space. Inside, you'll find luxury vinyl plank flooring, an electric fireplace and a modern kitchen with stainless steel appliances. In-unit washer and dryer and ample closet storage. A remodeled en-suite features a custom shower and modern updates. Outside, a gated private patio provides a welcoming space for entertaining. Enjoy access to community amenities like a pool, spa and clubhouse just steps away. 2 controlled and secured parking spaces with a private, monitored storage unit. Easy access to commuting freeways, Downtown C
Excellent Location in an all age community, this remodeled 2 Bedroom 2 Bath home is now available. Step inside the beautiful living area, with laminated flooring, crown molding, and double paned windows. Remodeled kitchen, bathroom, stainless steel appliances, breakfast bar, large living room + family room, Large Shed + AC Unit. The washer, dryer, refrigerator, dishwasher, stove are all included. Timber Cove has amenities including community club house, swimming pool, children's play area, basketball court. Close to Los Gatos Creek trail, Vasona Park, Downtown Campbell, HWY 17, 85, 237, 880. Low Space Rent! Call Today!
Excellent location in an all age community, this remodeled 2 bedroom 2 bathroom is now available. Step inside the beautiful living area, carpet throughout, crown molding and double paned windows. Remodeled kitchen, bathroom, stainless steel appliances, breakfast bar, large living room, plus family room, large shed, and AC unit. The washer, dryer, refrigerator, dishwasher, and stove are all included. Timber Cove has amenities including community club house, swimming pool, children's play area, basketball court. Close to Los Gatos Creek trail, Vascona Park, Downtown Campbell, HWY 17 and 85, 237, 880. Low space rent! Call Today!
This highly sought-after Silicon Valley Duplex in West San Jose is in a superb location close to Valley Fair Shopping Center/Santana Row, Hwys 880/280, Downtown Campbell and has easy access to San Tomas Expressway with a great commute to many Silicon Valley companies. Both sides have 2 bedrooms and 2 bathrooms and boasts a spacious living room, large kitchen with plenty of cabinet space, attached one car garage with laundry hook ups and separate private backyards. Excellent investment opportunity or for an owner occupied unit with income help from a second unit. Both units have provided consistent long-term investment income. This location commands the highest rents. This is an amazing inve
Move in and enjoy this absolutely gorgeous home in highly sought after Campbell. Walk into a home with soaring ceilings in the grand entry, living room & dining rooms. Exceptional light all around. Large open chef's kitchen with quartz countertops, island, gas cooktop, custom cabinets & huge pantry. Bright and open casual dining and family room along with downstairs bedroom & full bathroom. The awesome quartz staircase leads to a large Master Suite with huge walk-in closet & bathroom. All five bedrooms are large. Lovely backyard including pool and outdoor dining patio. Great privacy. Attached three car garage with subfloor throughout. Spectacular commute location wit
Back to the market with many upgrades and significant $50,000 reduction in price. The seller is highly motivated, bring your best offer. Experience luxury living at its finest! This exquisite 3-bedroom, 2-bathroom condo nestled in the heart of Campbell offers a prime location just minutes away from the vibrant Downtown Campbell, Walk to Pruneyard shopping center, dining, WholeFoods, Campbell park and trail. Beautiful kitchen boasting slab granite countertops and state-of-the-art stainless steel appliances. Brand new range and microwave. Brand new ceiling fan with LED light and remote. Fresh paint, new blinds. The bathrooms are adorned with elegant granite vanities, brand new shower door and
This area's enrollment policy is not based solely on geography. Please check the school district website for more information.
Elementary schools
Middle schools
High schools
GreatSchools Summary Rating
8/10
Bagby Elementary School
Public, K-5
8/10
Easterbrook Discovery
Public, K-8
8/10
Steindorf Steam School
Public, K-8
7/10
Oster Elementary School
Public, K-5
7/10
Gussie M. Baker Elementary School
Public, K-5
Only showing 5 of
11 elementary schools.
School data is provided by GreatSchools, a nonprofit organization. Redfin recommends buyers and renters use GreatSchools information and ratings as a first step, and conduct their own investigation to determine their desired schools or school districts, including by contacting and visiting the schools themselves.Redfin does not endorse or guarantee this information. School service boundaries are intended to be used as a reference only; they may change and are not guaranteed to be accurate. To verify school enrollment eligibility, contact the school district directly.
Homes for sale in Campbell have a median listing price of $1.66M. Some of these homes are Hot Homes, meaning they're likely to sell quickly.
What are some of the most popular neighborhoods in Campbell?
Popular neighborhoods include Cambrian, Rinconada, Doerr-Steindorf, Blossom Hill, Winchester, West Valley, Union, Willow Glen, Cambrian-Pioneer, and East Los Gatos.
Campbell, California is well-served by a variety of transportation options. The city boasts a robust public transportation system, including buses and light rail services, making commuting without a car quite feasible. For those who prefer to drive, be prepared for moderate to high traffic levels during peak hours. Additionally, Campbell is conveniently located near major highways and freeways, providing easy access to the surrounding areas. Learn more on our Campbell city guide.
What types of properties are available in Campbell?
Campbell, California offers a variety of single-family home types, including ranch-style, contemporary, and modern designs, with options ranging from 2 to 5 bedrooms and varying year built. These homes can be found throughout Campbell, California, in neighborhoods such as San Tomas, West Campbell, and Central Campbell, among others. To explore different property types for sale in Campbell, California, use the 'Home type' filter located above the active listings. Customize your search by selecting options like single-family homes, condos, townhomes, and more.
What is life like in Campbell?
Campbell, California offers a unique blend of urban convenience and natural beauty. The region boasts a diverse range of landscapes, including rolling hills, lush parks, and picturesque neighborhoods. The weather in Campbell is characterized by mild winters and warm summers, providing ample opportunities for outdoor activities throughout the year. The town is home to a thriving job market, with a variety of employment opportunities in industries such as technology, healthcare, and education. Residents of Campbell can enjoy a vibrant local culture, with numerous dining, shopping, and entertainment options available in the area.
What are the schools and amenities like in Campbell?
Campbell, California, is a city rich in public amenities that cater to a variety of lifestyles. Dining enthusiasts will appreciate the diverse array of restaurants available in the city. For those who enjoy outdoor leisure, numerous parks offer a breath of fresh air. Grocery stores are conveniently located throughout Campbell, ensuring easy access to daily necessities. Additionally, a variety of other amenities such as gyms, libraries, and recreational centers are available to enhance the lifestyle of Campbell residents.
In the past month, 30 homes have been sold in Campbell. In addition to houses in Campbell, there were also 9 condos, 16 townhouses, and 3 multi-family units for sale in Campbell last month. Campbell is a moderately walkable city in Santa Clara County with a Walk Score of 55. Campbell is home to approximately 39,368 people and 22,319 jobs. Find your dream home in Campbell using the tools above. Use filters to narrow your search by price, square feet, beds, and baths to find homes that fit your criteria. Our top-rated real estate agents in Campbell are local experts and are ready to answer your questions about properties, neighborhoods, schools, and the newest listings for sale in Campbell. Our Campbell real estate stats and trends will give you more information about home buying and selling trends in Campbell. If you're looking to sell your home in the Campbell area, our listing agents can help you get the best price. Redfin is redefining real estate and the home buying process in Campbell with industry-leading technology, full-service agents, and lower fees that provide a better value for Redfin buyers and sellers.


 REDFIN IS COMMITTED TO AND ABIDES BY THE FAIR HOUSING ACT AND EQUAL OPPORTUNITY ACT. READ REDFIN'S FAIR HOUSING POLICY AND THE NEW YORK STATE FAIR HOUSING NOTICE.
 United States
 Canada