This custom 2,402 square foot home in Woodcrest, CA sounds like a dream! With 4 bedrooms and 2.5 baths, an additional room that can be a sewing room, office or play area it's perfect for everyone who loves space. And with a whopping 36,204 square foot lot, there's endless potential for outdoor activities and expansion. Imagine having enough room for a pool to cool off in those warm California summers, space for horses if you're an equestrian enthusiast, lush gardens to cultivate your green thumb, and RV parking for your adventurous spirit. It's a haven for those who love both indoor comfort and outdoor freedom. Woodcrest is a highly sought-after area, known for its beautiful landscapes and
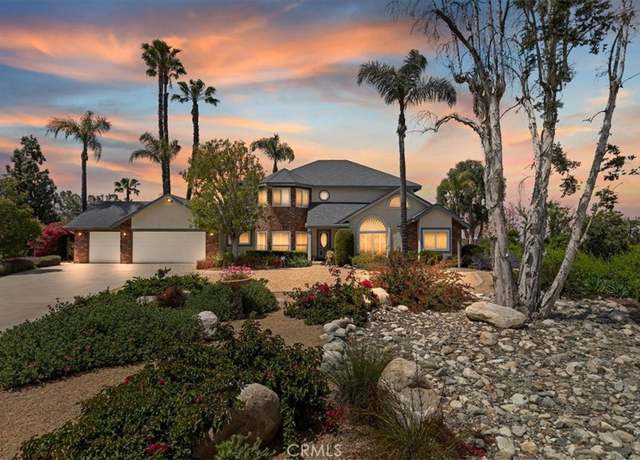
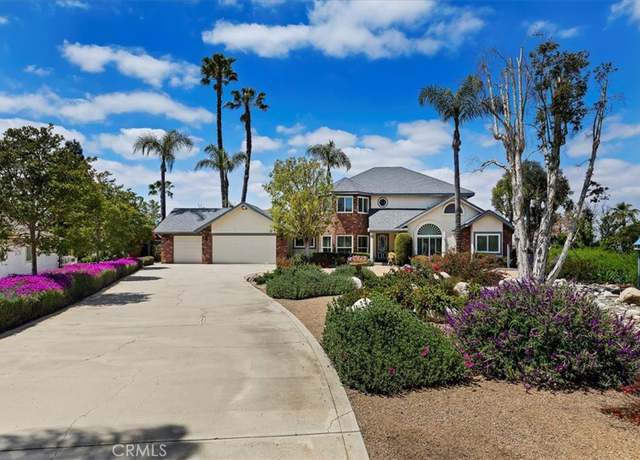
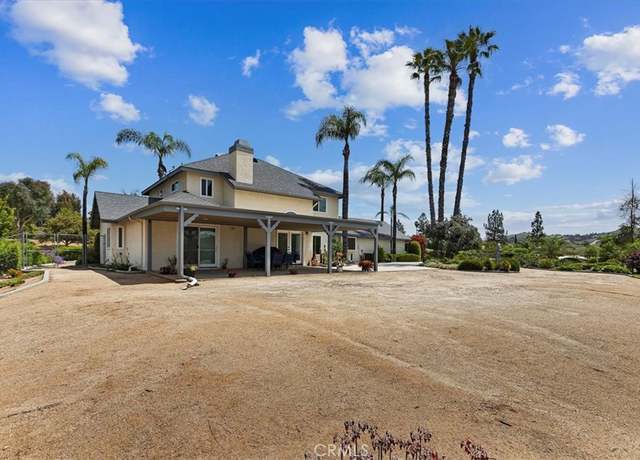
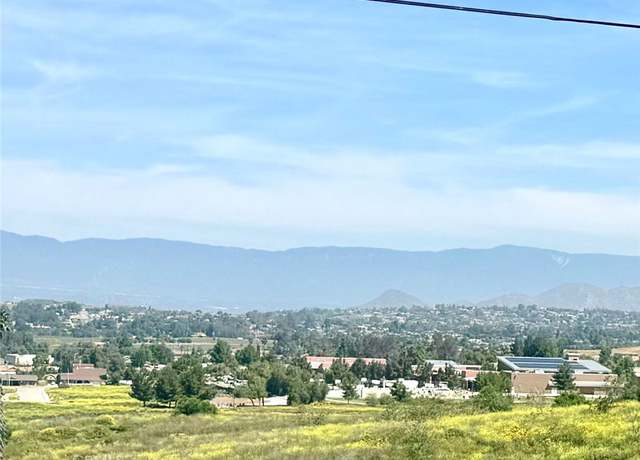
Welcome to this exquisite custom built 4 Bedroom, 2 bath home nestled in the heart of Riverside in the Woodcrest area. As you step through the elegant double door entry you are greeted by a sense of grandeur and sophistication. This home features a spacious formal living and dining room, perfect for entertaining guests and creating lasting memories. Situated on a vast 45,302 square foot lot, this property boasts two convenient storage units and a portable barn, providing ample space for all your storage needs. Additionally, the double rail pipe corral and zoning for horses make this home a haven for equestrian enthusiasts. The highlight of this home is the stunning view that can be enjoyed
Great opportunity to own this gorgeous 3 bedroom 2 bath Triple Wide home with so many upgrades in the most sought after All Age Park in the IE Rancho Caballero. This home is perfect for the family that wants little maintenance but still have a small grass area for animals or little ones. This home went through a total rehab back in 2021 through 2023. The upgraded included an awesome roomy floor plan with new Kitchen with Rolling Island, Cabinets Galore and Nice Pantry, and Massive Living Room with Fireplace. Other upgrades include Dual Pane Windows, Luxury Vinyl Plank Flooring, Fresh Paint Inside and Out, Upgraded Plumbing and Electrical, replaced Interior and Exterior Doors, Both Baths rem
Discover the allure of country living in this inviting 3 bedroom, 2 bathroom home, situated within a the serene semi-rural neighborhood of Canyon Ridge. Boasting modern upgrades, including newer granite counters, hardwood flooring, HVAC system, as well as coveted RV parking, this charming home offers a perfect blend of comfort and convenience. Step inside to find spacious living areas adorned with tasteful finishes, while the well-appointed kitchen, complete with upgraded stainless steel appliances, calls for your culinary adventures. Outside, you'll find a tranquil outdoor space, providing a lovely setting for relaxation or social gatherings. Embrace the peaceful ambiance of semi-rural liv
Welcome to this breathtaking custom-built estate nestled in one of the safest and most serene neighborhoods of Riverside, California. Spanning over 1,900 square feet on a lush . 19-acre lot, this home sets a new standard for sophisticated living in Canyon Ridge. As you step through the front door, you are greeted by a spacious first-floor entry that leads into an elegant dining room, a large family area, and an open-concept kitchen designed for both grand entertaining and intimate gatherings. The living spaces extend effortlessly to a large deck that offers panoramic views of Riverside, providing the perfect backdrop for alfresco dining and scenic relaxation. Descend to the lower level wher
Welcome to 14235 Judy Ann located in Canyon Ridge Hills area of Woodcrest, Very Quiet location to enjoy nature and away from all traffic & street noises. Sellers remodeled and updated the kitchen with new cabinets, quartz counter tops, nice subway backsplash, large farmhouse kitchen Sink. This 3 bedroom 2 bath POOL HOME offers NEWER AIR CONDITIONER, pool and a large covered patio area.
WELCOME TO YOUR DREAM HOME in Woodcrest, where luxury and comfort meet in this sprawling single-story residence. Situated on a generous half-acre lot within a highly sought-after community, this property boasts an impressive 3,410 square feet of living space. Offering four bedrooms, office, huge three car garage with epoxy floors and AC in garage, and 0.53 acres, this home will not last!! As you step inside, you're greeted by a grand and airy open concept design. The expansive formal living area and dining area exudes elegance with its high ceilings, fireplace, builtins and abundant natural light, creating a welcoming ambiance that's ideal for gatherings of any size. The heart of the home i
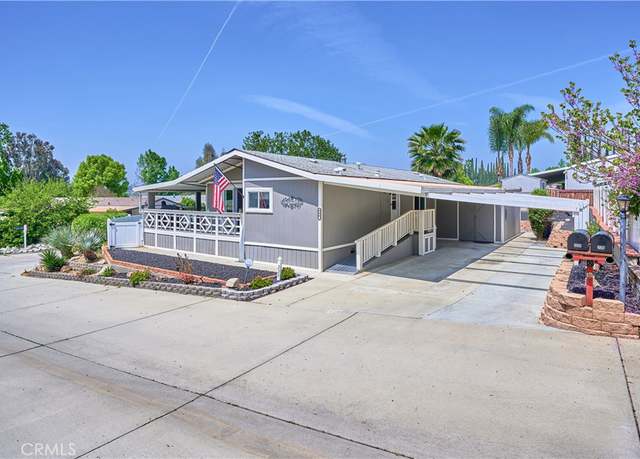
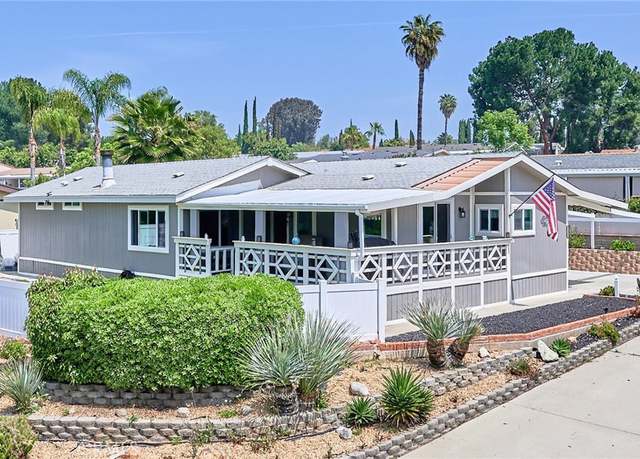
Inviting 3 Bedroom, 2 Bath Home in Rancho Caballero Mobile Home Park. Nestled in the esteemed Rancho Caballero Mobile Home Park, this charming residence offers a spacious floorplan with 3 bedrooms, including two with walk-in closets. Recently painted inside and out, the home features modern upgrades such as textured walls, crown molding, dual-pane windows, and upgraded electrical. The updated kitchen and remodeled bathrooms add to the home's allure. Enjoy the privacy of a small cul-de-sac location and the community amenities including pools, tennis courts, a dog park, and a clubhouse set in a picturesque country club environment. Experience the best of Riverside County living—schedule
Come experience the best of both worlds of owning an all fenced in 1/2 acre and being conveniently located close to shopping, schools, and easy access to the freeway! Featuring 4 bedrooms plus a versatile office space, 3 upgraded bathrooms, and an impressive 2,902 sq ft of living space on an expansive 21,780 sq ft lot, this residence is a true haven. Revel in the convenience of RV parking access, three car garage and abundant storage for all your treasures. Inside, be captivated by the radiant, airy interiors that offers space for everyone and yet a welcoming homey vibe. Meticulously designed with top-tier craftsmanship and semi-custom features, this home is a masterpiece of luxury living.
Nestled within the serene enclave of Mockingbird Canyon, 17380 Dalke Ln offers an unparalleled lifestyle defined by privacy, breathtaking views, and equestrian amenities on a sprawling 2.47-acre, tiered lot. This exceptional property boasts not one, but two residences, presenting a rare opportunity for multi-generational living or additional rental income. Step into a meticulously crafted two-story, 3,039 sq. ft. haven featuring five bedrooms and three baths, with a main floor bedroom and bath for added convenience. A recent renovation has infused modern elegance throughout, with new flooring, custom paint, and cathedral ceilings enhancing the spacious ambiance. Sun-drenched interiors are a
Large home with ADU and horse stable. Customize your own dream home in Woodcrest, Riverside, CA! This is a once in a lifetime opportunity to build the home you want. You pick the colors, floors, cabinets, countertops, Etc. The front house is a 2700 Sq Ft beauty with 4 bedrooms and 3 bathrooms built to suit your imagination. Step inside and be welcomed by the bright and airy living areas, flooded with natural light that creates a warm and inviting atmosphere. The well-designed floor plan seamlessly connects the living room, dining area, and kitchen, making it an ideal space for entertaining guests or enjoying cozy evenings at home. The kitchen boasts ample cabinetry and a convenient breakfas
Introducing a notable opportunity at 18590 Gentian Avenue. This property features 4 bedrooms and 3 bathrooms across 2,445 square feet, offering ample space for both individual pursuits and family life. The home is equipped with a recently updated HVAC and septic system, ensuring reliability and ease of maintenance for the new homeowners. In addition to it's paid for solar, this home is setupa and ready to go! Its practical layout includes a dedicated office space, catering to the needs of remote work or personal study, reflecting modern lifestyle demands. Set on a substantial lot, the outdoor area presents a versatile canvas for leisure and entertainment, ready to accommodate your vision fo
3 homes on a Lot! Multi-generation living Potential! This lovely Woodcrest property features 3 separate units ready for multi-generational living, extra space, or income generation. As you walk onto this gated property, you will notice the tranquil and privately situated front yard. Continuing into the 3 bedroom 2 bathroom main house, you are greeted by grand 10-foot ceilings and a spacious living room, joined by a dynamically large open-concept kitchen, making this property an entertainer's dream. The master bedroom is spacious and more than capable of accommodating large furniture pieces. This room also features a large walk-in closet with ample storage space for multiple wardrobes! While
This prestigious, custom-built, sprawling Estate sits over one acre of land in the exclusive neighborhood of Mockingbird Canyon. There is no need to go on vacation with all the amenities this home offers. The open floor plan encompasses 4,260 square feet of luxurious living space. It is spacious enough to give each occupant of a multi-generational family a sense of privacy and personal freedom; with a Primary bedroom on the first level and four bedrooms on the second level, running late is no longer a problem with five bathrooms. Designed to entertain, you enter through a grand foyer and proceed to a large formal parlor overlooking the front grounds. There is an expansive front yard with pl
Very Nice Home in Rancho Caballero Mobile Home Park. Enjoy the Beautiful View. This home is a 2 bedroom and 2 bath with office which could easily be a 3rd bedroom. Enjoy the spacious newly remodeled Kitchen with cupboards galore. This is just one of the many upgrades that make this home special. Soak and Relax in the Jacuzzi Tub in the large remodeled Master Bath. Many upgrades include wainscot in several rooms, New Entry Doors, Living and Family Rooms with Moldings and Base Board, Moldings and Baseboards throughout the Home, and upgraded Plumbing and Electrical. Outside was painted recently and Fence was added for better security. Personal Parking up to possibly 3 vehicles with Guest parki
BRAND NEW SINGLE FAMILY SINGLE-STORY HOME located in RIVERSIDE COUNTY. This expansive single-story floor plan offers room for every routine. With a large great room at the heart of the home and four spacious bedrooms featuring a dedicated walk-in closet and full bathroom each, there’s plenty of space to stretch out and come together. 4 bedrooms, 4 1/2 bathrooms, flex room, covered outdoor living, gourmet kitchen and an open floor plan. This home features Duraform Harbor Cabinets w/ an additional Linen Tower in the Primary Bathroom, Quartz Countertops throughout, Electrical Upgrades, Farmhouse Sink in the Kitchen, a Rainfall Showerhead in the Primary Bathroom, a Dacor 42" built-i
Welcome to your dream oasis at 17842 Corrinne Way, Riverside, CA! This expansive 5-bedroom, 3-bathroom home spans over 4,137 square feet of luxurious living space, nestled on a sprawling 1.35-acre lot. As you step inside, you're greeted by an elegant interior boasting high ceilings, spacious rooms, and designer finishes throughout. The heart of the home is the gourmet kitchen, featuring granite countertops, top-of-the-line appliances, and ample cabinet space. Entertain guests effortlessly in the open-concept living and dining areas, accented by large windows that offer breathtaking views of the lush surroundings. Indulge in resort-style living with your own private pool and spa, perfect for
Welcome to this charming 2 bedroom, 2 bathroom manufactured home located in the 55+ Mountain Shadows Mobile Home Community located at the base of San Bernardino Mountains. This is a great opportunity to find your dream home at a price much lower than most homes in the park. This home has been well maintained and it has a very nice and unique floor plan with 2 separate eating areas, Family Room has large walk in Closet and storage area. This home comes with central heat and air conditioning, a laundry area with closet and cabinets (great for extra pantry), covered carport with space for two or possible 3 cars, dual pane windows, upgraded cooktop and oven. Master has 2 closets (one in bath),
Welcome to your dream home at 16616 Fleur Boulevard, a stunning property nestled on a generous 23,087 square foot lot, offering breathtaking hill views and an expansive living space of 3,823 square feet. This beautiful house is designed to cater to a variety of lifestyles, ensuring comfort and luxury for anyone looking to make it their home. As you step inside, you'll be greeted by an elegant interior that boasts quartz countertops that add a touch of sophistication to the spacious kitchen, perfect for those who love to cook and entertain. The house features five well-appointed bedrooms, providing ample space for family, guests, or a home office setup catering to the new normal of work-from
Nestled in the heart of Riverside, this charming residence offers the perfect blend of comfort, convenience, and style. Boasting 5 bedrooms, 3 bathrooms, plus huge bonus room, and 4,815 square feet of living space, this meticulously maintained home is a testament to modern living. As you step inside, you're greeted by an abundance of natural light that floods the spacious living areas, creating an inviting ambiance for relaxation and entertainment. The open-concept layout seamlessly connects the living room, dining area, and kitchen, providing an ideal setting for gatherings with family and friends. The gourmet kitchen is a chef's delight, featuring sleek countertops, stainless steel applia
Prime location high atop Mockingbird Canyon with stunning panoramic mountain and city light views on nearly 2.5 acres. Seldom available custom home that is perfectly sited on this elevated view lot with pool, spa, 5 car garage (with potential ADU/loft space above), gym, and space for ADU conversion within existing floorplan. Long private drive, extensive stone work, handsomely hardscaped on all sides (multiple areas for year round outdoor entertaining), and ample RV parking. Flexible floorplan with large kitchen boasting center island, formal living room with fireplace, spacious family room with fireplace, separate formal dining room, and first floor gym near laundry room that could be idea
Unique 1 story home in Woodcrest area of Riverside. This 3/2 bath home has been meticulously maintained. Since the house was built, the use has been residential, however, the zoning is CPS. The property is fully fenced, has a square U-Shaped driveway with electric fencing. Detached 3 car garage/workshop. Square footage of workshop is estimated at 800 +/- s. f. There is an area with corrals. The inside of property has been meticulously maintained.
Just lowered $75K 4/22/24 Here, in Riverside’s prestigious Rancho Valencia Community, nestled amidst vibrant orange groves, this single-story gem offers more than just a prime location—it's a canvas awaiting your personal touch. This value and location brings upgrading your lifestyle within reach. Inside the grand door, discover an inviting thoughtful layout to make everyday life more comfortable and efficient. With 4 bedrooms/3 baths (including convenient Jack and Jill configuration) this home effortlessly accommodates your needs. Want dedicated workspace? Look no further than the custom-built tech center, perfect for home office or homework area. The open concept family room/
DREAM HOME FOR SALE! YEAR BUILT 2022, TURNKEY! WAITING FOR A BIG FAMILY TO ENJOY THE BEST NEIGHBORHOOD AND VIEW! MASTER BEDROOM HAS A BEAUTIFUL AND SPACIOUS BATHROOM WITH ELECTRICAL TOILETS AND WALKING CLOSET. MASTER HAS A BALCONY WITH AN AMAZING VIEW WHERE YOU CAN ENJOY AND RELAX. ALSO MASTER BEDROOM HAS AN ELECTRICAL BUILT IN FIREPLACE. LAUNDRY ROOM IS LOCATED UPSTAIRS, WASHER AND DRYER MACHINE ARE INCLUDED IN THE SALE. SECOND BATHROOM UPSTAIRS THE TOILET IS ALSO ELECTRICAL. VERY COZY AND SPACIOUS LOFT LOCATED UPSTAIRS. KITCHEN IS VERY SPACIOUS; MANY KITCHEN CABINETS, BEAUTIFUL WATERFALL QUARTZ KITCHEN ISLAND, ALL KITCHEN APPLIANCES ARE INCLUDED IN THE SALE. ELEGANT GLASS STAIR RAILING.
Elegant 5BR/4.5BA Two-Story Home in Bridle Creek, Riverside – Luxurious Living on a 1 Acre Lot Welcome to this magnificent two-story residence in the coveted Bridal Creek community of Riverside. Occupying a sprawling 1-acre flat, usable lot, this 5-bedroom, 4.5-bathroom home is a blend of sophistication and comfort, showcasing a smooth coat stucco exterior. Step inside to discover an interior freshly painted, enhancing the elegant crown moulding that adorns each room. The spacious design includes a large courtyard, bathing the home in natural light and creating an inviting ambiance. The main level features a bedroom with an en-suite bathroom, perfect for guests or as a multi-genera
BRAND NEW SINGLE FAMILY SINGLE-STORY HOME located in RIVERSIDE COUNTY. This expansive single-story floor plan offers room for every routine. With a large great room at the heart of the home and four spacious bedrooms featuring a dedicated walk-in closet each, there’s plenty of space to stretch out and come together. This home features 4 bedrooms, 4 1/2 bathrooms, FLEX ROOM, covered outdoor living, gourmet kitchen, 4-CAR TANDEM GARAGE, the optional doors at the flex room, and an open floor plan. There is time to personalize the finishings of this home. This home will come with a new home warranty administered through the builder. Don't miss out.
* * * AWESOME WOODCREST HOME FOR SALE * * * & bull; Nestled in the Hills of Woodcrest, Offering a Peaceful Retreat with Stunning City Lights, Mountain, and Valley Views. & bull; Outdoor Oasis: Over $100k Invested in an Infinity Pool and Landscaping & bull; Soaring High Ceilings Greet You as You Enter, with Almost Every Room Providing Fantastic Views and an Abundance of Natural Light. & bull; The Kitchen Overlooks The Dining Room And Open Family Room, Creating A Perfect Space For Hosting Guests. & bull; Wonderful Study With A Built-In Library Serves As An Ideal Home Office & bull; Luxurious Master Retreat Features Stunning Views And An Ensuite Bathroom Wit
Ready to move in. Spacious Living room, tiled floor with vaulted ceiling. Gorgeous 180 degree scenic views throughout the house. Beautiful Fireplace (gas, log) Beautiful Kitchen has tile floor, and tile countertops, new faucet. Also has views of the lovely mountains and big houses. All appliances included stainless steel refrigerator, oven range, built in dishwasher, built in microwave all are excellent working condition. Views, views, views of the with mountains and big beautiful houses throughout the house. Central heater and air conditioner all around the house. Master bedroom is spacious and has new carpet, and views of the lovely mountains, and big beautiful homes. Master walk in close
MAJOR PRICE REDUCTION FOR QUICK SALE !!!! LOCATION, LOCATION, LOCATION. SPRAWLING SINGLE STORY RANCH HOME SITUATED IN A QUIET CUL-DE-SAC IN A FAST GROWING NEIGHBORHOOD WITH LOADS OF UPGRADES AND A BRIGHT OPEN CONCEPT SETTING WITH 4 BEDROOMS, 2 BATHS AND 3 CAR GARAGE . THIS NEWLY REMODELED HOME IS SITUATED ON NEARLY ONE ACRE CORNER LOT THAT NOT ONLY PROVIDES PRIVACY, BUT POSSIBLE POTENTIAL INCOME . THE OWNER SPENT NEARLY 80k IN UPGRADES THAT INCLUDE NEW FLOORING THROUGHOUT THE HOUSE, REMODELED BATHROOMS, "RENEWAL BY ANDERSON" WINDOWS, LARGE KITCHEN FEATURING GRANITE COUNTERTOPS, NEW STAINLESS STEEL HOOD, NEW GE DISHWASHER AND STAINLESS STEEL APPLIANCES. NEW INTERIOR AND EXTERIOR
New improved price for this fully remodeled home, located in the prestigious Woodcrest neighborhood of Riverside. Home offers 5 bedrooms, 3.5 baths, new kitchen cabinets, counter, appliances, toilets, bathroom cabinets, flooring, freshly painted interior and exterior, one of the HVAC is brand new, 2 car garage with epoxy flooring. This extraordinary estate spans an impressive 2.3 acres of prime real estate, offering a truly unique living experience that combines style and charm. As you enter through the custom tall iron gate, you'll be enchanted by the lush green trees. Every detail has been carefully designed to create a warm and inviting atmosphere. The beautifully manicured gardens and g
Value add opportunity! Great potential for this centrally located property in the woodcrest area, this property has an excellent location nearby Van Buren and Washington Street, Single Story property in need of a full make over, rehab the existing structures or build your dream home from the ground up! This gem could be your retirement avocado orchard, Seller has planted over 50 avocado trees, three sides of the property have over 170 Cypress trees for privacy, property has a water well to help with irrigation, (Well not connected, currently using city water) this house sits on . 86 of an acre lot, with enough space to do almost anything, perfect for the business owner or those in need of a
Looking for that perfect place to build your custom home, look no further. With beautiful high end custom homes surrounding this elevated lot with terrific views, your imagination can go wild. With shopping, restaurants, parks and entertainment near-by you won't need to go far to enjoy life in the Canyon Ridge area of Riverside. Seller has site plan and will provide grading plans with purchase, all you need to do is choose your own architecual design to make your dream come true. Seller is a civil engineer and can assist with making your dream a reality.
School data is provided by GreatSchools, a nonprofit organization. Redfin recommends buyers and renters use GreatSchools information and ratings as a first step, and conduct their own investigation to determine their desired schools or school districts, including by contacting and visiting the schools themselves.Redfin does not endorse or guarantee this information. School service boundaries are intended to be used as a reference only; they may change and are not guaranteed to be accurate. To verify school enrollment eligibility, contact the school district directly.
Homes for sale in Woodcrest have a median listing price of $1.1M. Some of these homes are Hot Homes, meaning they're likely to sell quickly.
What are some of the most popular neighborhoods in Woodcrest?
Popular neighborhoods include Canyon Ridge, Prenda, Alessandro Heights, Olive Grove Park, Orangecrest, East Riverside, Central Riverside, Tradition, and Arlington Heights.
Woodcrest, California, is predominantly car-centric, with most residents relying on their cars for daily commuting. Traffic levels can be moderate to high during peak hours, making driving a bit challenging at times. Unfortunately, Woodcrest does not have a public transportation system, making car ownership essential. The region is well-connected with nearby highways and freeways, providing easy access to neighboring areas.
What types of properties are available in Woodcrest?
Woodcrest, California offers a variety of single-family home types, including ranch-style homes, contemporary homes, and modern homes with open floor plans and spacious layouts. These homes can be found throughout Woodcrest, California, in neighborhoods such as Woodcrest Acres, Woodcrest Hills, and Woodcrest Estates. Most properties in Woodcrest, California feature three to five bedrooms and were built within the last 20 years. To explore different property types for sale in Woodcrest, California, use the 'Home type' filter located above the active listings. Customize your search by selecting options like single-family homes, condos, townhomes, and more.
What is life like in Woodcrest?
Woodcrest, California offers a picturesque setting with rolling hills and sprawling greenery. The region experiences a mild climate with warm summers and cool winters, providing a pleasant year-round environment. The area boasts a variety of job opportunities across different industries, ensuring a diverse economy. Residents can engage in a range of recreational activities, such as hiking, biking, and exploring local parks and trails. Woodcrest also provides a vibrant community with numerous cultural events and social gatherings for residents to enjoy.
What are the schools and amenities like in Woodcrest?
Woodcrest, California, offers a variety of public amenities to cater to the needs and interests of its residents. The region boasts a diverse selection of restaurants, providing a range of culinary experiences. For those who enjoy the outdoors, there are several parks available for leisure and recreation. Shopping needs can be easily met with the presence of numerous grocery stores within the area. Additionally, Woodcrest offers more amenities such as schools, libraries, and fitness centers, ensuring a well-rounded community experience.
In the past month, 12 homes have been sold in Woodcrest. Find your dream home in Woodcrest using the tools above. Use filters to narrow your search by price, square feet, beds, and baths to find homes that fit your criteria. Our top-rated real estate agents in Woodcrest are local experts and are ready to answer your questions about properties, neighborhoods, schools, and the newest listings for sale in Woodcrest. Our Woodcrest real estate stats and trends will give you more information about home buying and selling trends in Woodcrest. If you're looking to sell your home in the Woodcrest area, our listing agents can help you get the best price. Redfin is redefining real estate and the home buying process in Woodcrest with industry-leading technology, full-service agents, and lower fees that provide a better value for Redfin buyers and sellers.


 REDFIN IS COMMITTED TO AND ABIDES BY THE FAIR HOUSING ACT AND EQUAL OPPORTUNITY ACT. READ REDFIN'S FAIR HOUSING POLICY AND THE NEW YORK STATE FAIR HOUSING NOTICE.
 United States
 Canada