Welcome to this lovely 2 story single family home located in the quiet neighborhood of Montclair. Open bright floor plan with 2,460 total living sq. ft. that is perfect for a large family. Through out the house with newly installed laminated wooding flooring. This is a well maintained home that features 5 bedrooms 3.5 baths with a suite downstairs with 1 bedroom 1 full bath ideally for in-law suite or a guest room. There is also a ½ bath on the main floor and a separate laundry room with a wash bin for convenience. Spacious living room with fireplace located next to a large dining area. Open kitchen with granite counter tops, central island/breakfast nook and a huge walk-in pantry th
This amazing property is located in the highly desirable Preserve community. This 3 bedroom and 2.5 bedroom condo features an open floor plan , the gourmet kitchen with stainless steel appliances including quartz countertop and white cabinetry. Also has Indoor washer and dryer room and an attached 2-car garage. Many upgrades, including the attractive luxury vinyl flooring and PAID OFF solar. The paid off solar can reduce your utility cost. Excellent school district, high ranking Chino Hills High school, and award-winning Cal Aero Preserve Academy ( K-8) within the walking distance. The preserve community offers fantastic amenities, including parks, 24 hour fitness center, swimming pools, li
~Sweet Home~ LIKE NEW, BUILT IN 2018 WITH TONS OF UPGRADES AND DESIGNER COSTUMIZED PAINT! Located in the heart of Chino, the cul-de-sac of STONEBROOK Community with a huge community pool, SPA, BBQ area, and lot of free parking spaces. Super convenient location also in walking distance to excellent school: Edwin Rhodes Elementary, Parks, State Bro. Supermarkets, Restaurants, Banks, Starbucks. The house has 4 bedrooms and 3 full baths with an additional loft upstairs and 1 bedroom with 1 full bathroom downstairs. The downstairs living area has a spacious great room design, huge kitchen counter with 45 degree TOP NOTCH KITCHEN HOOD, a 5-burner stove and tons of cabinets/storage. Both floors ha
Nestled in the heart of Chino, this beautifully renovated two-story residence is ready to welcome its next owners with open arms. Step inside and feel the warmth of a home that's been transformed from top to bottom. With 4BD and 3BA spread across a spacious 1,938 sq ft, there's plenty of room for everyone to enjoy. The first floor boasts a bedroom and convenient full bathroom, offering flexibility for guests or multigenerational living. Cozy up by the fireplace in the family room, where crackling flames create the perfect ambiance for movie nights or small gatherings with friends and family. The open floor plan seamlessly connects the kitchen, dining, and family room, making entertaining a
DELIVERED VACANT. PRISTINE HOME! Dont miss this great opportunity to own a 4 bed/2 bath home with a pool in Chino CA. Property will be delivered vacant at COE and is currently owner occupied.
Located in the renowned “The Preserve” community in Chino. The total property tax rate only 1.67%. The living room, dining room, kitchen, and a half bath are on the first floor. Upstairs are a master suite and two standard bedrooms, which share a bathroom on the second floor. The laundry room is also on the second floor, eliminating the need to carry laundry up and down the stairs. You can enjoy all the amenities at the Preserve’s community center—The Parkhouse Community Recreation Center, such as a clubhouse, an Olympic-size youth pool/spa, a gym, a library, a ballroom, a theater, a computer room, meeting rooms, tennis courts, parks, and more. Invite your guests and
Amazing detached condo in Chino Preserve! Explore this remarkable 1,778 square foot condo boasting 3 bedrooms and 4 bathrooms, meticulously maintained by the owner in pristine condition with minimal signs of wear. Located in a vibrant neighborhood, residents can take advantage of nearby amenities including Costco, 99 Ranch Market, and a variety of dining options. Quick access to major freeways such as the 60, 71, 91, and 15 provides convenient commuting options. Situated in an excellent school district, families will appreciate the proximity to esteemed educational institutions ensuring top-notch educational opportunities for children. Don't miss out on this exceptional opportunity! Schedu
Rare investment opportunity! 2 single house in huge lot, many possibilities. front house has 3 bedroom 2 bathrooms, back house has 4 bedrooms 2 bathrooms, all upgraded with ample parking space. separate for electric, gas, water meters and mailing address. Convenient location close to shopping malls, schools, restaurants, supermarkets and freeways.
This gorgeous open concept two bedroom, two bath home has new flooring and fresh paint throughout, plus many other upgrades. A lovely private courtyard leads you to the front entrance. Enter the open concept living room with a large brick fireplace which opens up to a large dining room and welcoming kitchen. Cooks will enjoy the new kitchen cabinets, sink, counters and flooring which are warm and inviting. There is a downstairs half bath for your guests and direct access to a two-car garage and laundry area. Upstairs you will find two spacious Master Bedroom Suites with expansive closets. Each bedroom has its very own full bath and private patio perfect for your own private getaway. The ass
Prestigious "The Preserve" community in Chino. Low HOA $142/month ($81 + $61), Low Mello Roos compared to some other properties in the same community which ends in 2035. Approx Property tax 1.6% in total. Two story high ceiling makes the layout unique, plenty of natural lights. Big windows. Living room, family room, dinning room, large open kitchen kitchen with double oven, one bedroom and one bathroom downstairs. Huge primary suite, junior suite, and two guest rooms shared one bathroom on the 2nd floor. And laundry room as well. You don’t need to walk up or down to get your clothes. Huge LOFT on the 3rd floor, can be your home office, entertainment room, kids study room &he
Welcome to 7446 Desert Holly! This beautiful home nestled within the established Preserve community of Chino offers not just a living space, but a lifestyle. Built in 2021, this stunning residence boasts a spacious layout featuring 4 bedrooms, 3 bathrooms, open-concept design seamlessly connecting the living room, kitchen and dining room to the decent sized backyard. On the first level you'll find a bedroom and a bathroom, providing convenience for guests or family members who prefer single-level living and may also serve as an office or den offering flexibility to meet your needs. Masters bedroom has its own bath with a walk in closet. HOA grants access to an array of amenities (parkhouse
Welcome to this upgraded turnkey pool home in a desirable neighborhood. This home features 4 bedrooms 3 bathrooms and 3 car garage. Starting from the curb appeal of this home, enter into the oversized family room with vaulted ceilings and recessed lighting. Upgraded kitchen with granite counter tops, recessed lighting and newer stainless-steel appliances including microwave, dishwasher, and dual oven range. Off of the kitchen will be the dining area for all your family gatherings with beautiful wood floating shelves. Downstairs also offers one bedroom with ceiling fan and a full bathroom with tub/ shower combo and tile flooring for all your guests. Laundry is located inside with extra stora
SFR PROPERTY WITH TWO PERMITED ADU's. PROPERTY ALSO HAS A JR ADU THAT BUYER WILL HAVE TO COMPLETE PERMITTING PROCESS FOR, PLANS ALREADY COMPLETED AND MAJORITY OF WORK JUST NEED TO SUBMIT AND FINISH OUT LAST DETAILS TO GET JR. ADU APPROVED. THE PROPERTY WAS COMPLETELY REBUILT IN 2006. MODERN STUNNING HOME WITH DOUBLE DOOR ENTRY WITH A BRIGHT OPEN FLOOR PLAN WITH HIGH CATHEDRAL CEILINGS "HARD TO FIND IN CHINO" * * GREAT OPPORTUNITY FOR INVESTOR OR OWNER OCCUPANT. THIS IS A REMODELED CUSTOM ESTATE HOME, HUGE LOT MORE THAN 11,000 SQ. FT LOT. BUILT WITH A SPANISH FLAIR. THE HOUSE HAS 3 MASTER BEDROOMS IN MAIN HOUSE. HOME HAS AN AMAZING GLASS & WROUGHT IRON DOUBLE DOOR ENTRY, L
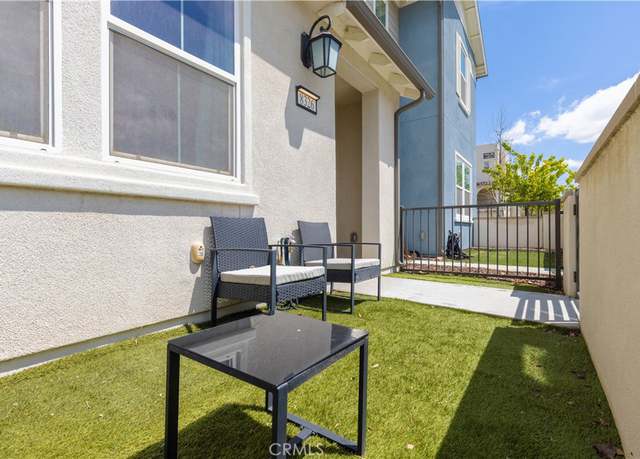
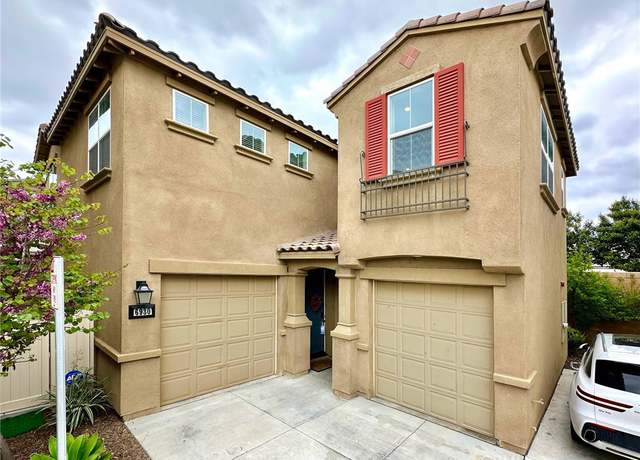
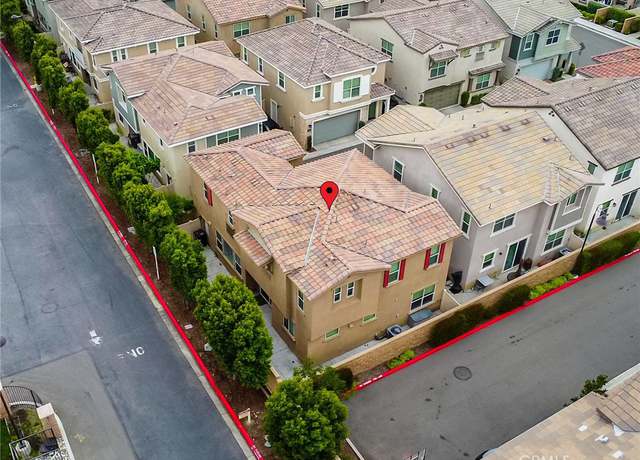
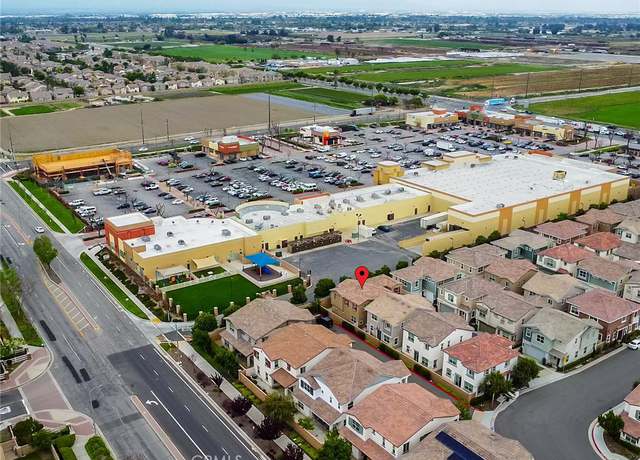
6200 Eucalyptus is a two-story luxury townhome located in the community of College Park. This beautiful home has upgraded flooring including wood floors on the first floor, carpeted bedrooms, and tiled baths. The open-design kitchen comes with stainless steel appliances, shaker cabinets, granite countertops, and a large breakfast bar island. One of the four bedrooms is located on the ground floor while the roomy master suite is on the second floor. The back yard is spacious and overlaid with paving stones. Living in College Park gives you access to The Commons at College Park - a recreation center that includes a full size swimming pool and gym. The neighborhood landscaping is impeccably ma
This great 2 bedroom and 1 bathroom Mobile Home in a quiet and well kept park. Home offers newly upgraded flooring through-out home, upgraded bathroom, mini split unit to keep home cool. Washer and Dryer hook ups located outside the home, Storage shed, Front Patio, small back yard. Community offers pool and Laundry room on site. Affordable rent space $765. Mobile home Park is near by your major freeways, 60, 15 and 71. Close to Chino Spectrum Center, walking distance to shopping center. It Won't last. .
Welcome to 13257 Copra Ave; a Magnificent Home Upgraded and Renovated with all of the Amenities and Smart Home Technology you have been Dreaming of. The Open-Concept Main Level includes a Large Living Room, Open Dining Room, Well Appointed Kitchen with Ample Counter and Storage Space, Private Back Balcony and a Discreet Half-Bathroom for Convenience. The Private Upper Level includes Two Main Bedroom Suites Each with Full Bathrooms. Lower Level includes a Bonus Flex Space Room which is ideal for use as Home Office, Additional Living Space, Recreation Room, Kids Play Room or Movie Room. This also includes the Main Entry and the In-Home Laundry Closet which makes access very convenient. The Fi
Finally, a diamond in the rough! Chino Hills adjacent within the Ayala Highschool boundary! Spacious 4 bedroom, 2.5 bath, 1,628 sqft of living space, on a 4,400 sqft lot ~ Living room with laminate flooring & dining area ~ Family room w/ fireplace and access to backyard ~ Light & bright kitchen ~ spacious secondary bedrooms including one large bedroom, big enough to convert to upstairs loft area ~ Large primary bedroom with lots of closet space and bathroom ~ Half-bath downstairs ~ Laundry hookups in garage ~ 2-car attached garage with direct access and roll-up door ~ Patio area and fruit trees in backyard, perfect for entertaining ~ Property needs some TLC ~ Minutes drive to s
Nice Single Family Home in the College Park community. Great floor plan. Master bedroom downstairs, there are two bedrooms upstairs with a spacious loft. Kitchen with granite counter top, double ovens. Another separate kitchen with grill top and a small fridge that is ideal for hosting family gatherings. 3 car attached garage and an additional parking space outside the garage, total 4 parking spaces.
The shining gem locating in the Danbury park community, which is close to freeway 71. Facing to the small park with no blocking in front of it. Square and flat lot size, there is a office on first floor which could be easily converted to a bedroom. Recently remodeling for the kitchen, new painting inside, new carpet in the bedrooms. Open floor plan makes the spacious space in the kitchen and living room area. With French sliding door to the backyard, you will find the new A/C near the corner. Very impressive is the big loft on the second floor, hardwood floor on stairs and the loft area. New carpet is cozy and convenient. Laundry is in a private room on second floor. Boasting Chino hills sc
Nestled within a serene cul-de-sac in the sought-after Chino neighborhood, this distinctive turnkey property offers a blend of charm and modern elegance. Boasting two stories, this home has undergone a comprehensive top-to-bottom remodel, making it an ideal haven for a growing family. Discover a thoughtfully designed layout that seamlessly combines functionality with style. The main level welcomes you with a gracious formal living room adorned with a cozy fireplace, flowing effortlessly into the expansive kitchen. Adorned with sleek quartz counters and pristine white shaker cabinets, the kitchen is a culinary enthusiast's dream. An adjoining dining area and inviting family room create a per
Single Story 4 bedrooms 2baths home with pool in a desirable area of Chino. High ceiling provides plenty of natural light to living & dining room. Roof is only 1 year old. Great floor plan. Primary bedroom has en-suite 3/4 bath. Spacious living space of 1,642SF on a 7,227SF lot. Built in 1976. With some TLC & facelift, this is a great opportunity for you to make it your dream home! Property is "Sold As-Is". No warranty/repairs or credit will be given to Buyer by Seller. Buyer to cooperate with Seller's 1031 Exchange at no costs to Buyer. Tenant-occupied. No showing. No sign. Make Offer subject to interior inspection.
Don't miss this opportunity to live and own in the desirable vibrant community of Woodbury College Park! Upon entry you'll be greeted by an open floor plan where you can see the renovated kitchen, updated lighting, new flooring and living and dining areas. Home has just been freshly painted, full of natural light through out the home, high ceilings w/ crown molding and fireplace in the living room. Kitchen has a brand new gas range with steam clean for chemical-free, odor-free and fast cleaning. Entire home has been upgraded displaying a tasteful, contemporary look. This home boasts 4 spacious bedrooms, two full baths with double vanities, a downstairs powder room and upstairs laundry room
Proudly presenting a single-family home with 5 bedrooms and 4 full bathrooms. (shows 4 bedrooms and 3 bathrooms on permit, owner upgraded the 2nd level den to a full bath and bedroom without permit) Nestled in a serene neighborhood. The house is situated at the corner with larger back yard and easy access. Enjoy community Pool/Spa BBQ area, Outdoor cooking areas and Parks, priced to sell quick! easy showing! Leased solar panels, $66.08/month, saving you money on electricity bills .
Welcome to this beautiful updated horse property single story home in the highly desired city of Chino. This home offers a 12,000+ lot with the potential of adding more square footage to the home or an additional living area in the rear yard. Rear yard has a horse corral and plenty of room for your animals to roam. The interior has a newer septic tank, updated kitchen, bathroom, flooring and so much more. Professional photograph will be up soon.
Step into luxury living at this stunning former model home in the prestigious gated community of Harvest at the Preserve. Built in 2019, this corner lot masterpiece boasts 4 bedrooms, 2.5 bathrooms, and a two-car garage with a driveway. No detail has been spared in this exquisite home. Step inside to find premium upgrades including flooring, wall coverings, lighting, window treatments, and cabinets. Designer furniture and decor are included, making this home truly turnkey. The first floor features a spacious, open floor plan with a gourmet kitchen complete with large granite countertops and top-of-the-line appliances. Southern-facing windows flood the living room with natural light, creatin
Welcome to your dream home in The Preserve at Chino, where elegance meets tranquility in this stunning single-family property. Wrapped in a Cottage exterior, the home draws you in with its warm, inviting presence. Step inside to discover an open floor plan that centers around a gourmet kitchen with a large island, perfect for culinary explorations and social gatherings. The kitchen flows seamlessly into a cozy dining area and a spacious great room, ideal for entertaining and making lasting memories. On the first level, a conveniently located bedroom and bath offer privacy and comfort for guests or family members. The journey continues upstairs where you find three serene bedrooms, including
With its thoughtful layout, convenient amenities, and prime location, this townhome is ready to welcome you home. This stunning 3-bedroom, 2.5-bathroom townhome boasts an airy open-concept design, perfect for modern living. Step inside to discover a versatile loft on the second floor, offering endless possibilities as a home office, media room, or cozy retreat. Enjoy the convenience of an EV charger in the garage, ensuring you're always ready for your next adventure. Plus, soak up the sun and relax by the nearby pool.
Welcome to Chino, CA! One of the top 10 fastest growing cities in the US. Don't miss out on this turnkey home in College Park! Nestled in a peaceful and picturesque neighborhood, this charming home offers a serene retreat from the hustle of city life. This east-facing house boasts of 3 bedrooms, 2 full bathrooms, and 1 half bath, along with a 2-car attached garage and spacious patio with installed shaded pergola installed. As you step inside, you'll find a bright open layout living space with ample natural light, and a kitchen with granite countertops and stainless-steel appliances. The open layout of the living room has spaces for a formal dining area and a cozy family room with an in-
Stunning 2-story home with 3 bedrooms and 2 bathrooms located in the desirable Preserve community in Chino, California. This beautifully designed home offers 1814 square feet of living space with a 2 car garage. The modem kitchen features stainless steel appliances and plenty of counter space. The spacious living room is perfect for entertaining guests, and the bedrooms offer plenty of room for relaxation. The home also features a private backyard with room for outdoor activities. With easy access to top-rated schools, shopping, and dining, this is the perfect place to call home. Leased Solar.
- Discover Affordable Elegance in Pembroke Downs - Nestled in the heart of the vibrant and welcoming Pembroke Downs community in Chino, CA, awaits a gem of an opportunity, a mobile home that redefines affordable luxury and comfort. This 2 bedroom, 2 bathroom abode, with its great potential for a 3rd bedroom or bonus room, offers the perfect blend of modern living and cozy charm. Step inside to find a home that has been meticulously updated to reflect contemporary tastes. The heart of this home is undoubtedly its kitchen, boasting white shaker cabinets, newer appliances, and an inviting layout that makes every meal a pleasure to prepare and share. The modern look extends throughout the prope
Welcome to your dream home in the heart of Chino, California! This stunning 4-bedroom, 3-bathroom property offers the perfect blend of comfort and luxury. Nestled on an oversized lot, this home boasts ample space for outdoor living and is ready for the addition of up to 3 Accessory Dwelling Units (ADUs), making it an ideal investment for those looking to expand their living space or create potential rental income. But that's not all - the backyard is an entertainer's paradise, featuring a sparkling pool perfect for those warm California days. Whether you're hosting a summer barbecue, enjoying a quiet morning coffee, or simply taking a dip to cool off, this outdoor space is sure to become yo
Welcome to 1205 W. Monticello! This 7,735 ft. ² corner lot in a prime location in south Ontario has plenty of room for an addition or an ADU. The single-story, four-bedroom. two-bath home has an open floor plan which features a conjoined, spacious living room and dining room, perfect for hosting gatherings for friends and family, as is the enchanting backyard. This highly sought-out neighborhood features easy access to freeways, shopping, restaurants, schools, colleges, and much more. Zones into the wonderful Chino Valley School District. You do not want to miss this one!
Beautiful newly built Single-Family home in the Chino Preserve Community. The property features 5 bedrooms and 3 full bathrooms, covered L-shape patio at front door, rarely found big size of backyard with no neighbor behind, downstairs has one bedroom and a full bathroom, attractive luxury vinyl plank floor is throughout the first floor, open concept kitchen with center island, white shaker cabinets with Quartz countertop, full back splash, stainless steel appliances, walk-in pantry with lots of storage space, 3 car garage, outdoor California room, the second level has a good size loft, primary bedroom with primary bathroom, three guest bedrooms with guest bathroom and individual laundry ro
Great Value for a Spacious 4 Bedroom 3.5 Bathroom Single Family House in the Harvest Gated Community. Unique corner lot location with no neighbors behind the house. Desirable Floor Plan with a Downstairs Private Suite with Full Bathroom and Walk In Closet. Modern Kitchen with Stainless Steel Appliances, Large Center Island, and Plenty of Cabinets. Upstairs, there is Huge Master Bedroom Suite with an Extra Large Walk In Closet, a loft for entertainment, and 2 decent sized bedrooms. This house comes with Solar Panels and Tankless Water Heater, which will help save on electricity usage. It has 2 separate garage spaces with more flexible storage potential. The Harvest Community amenities inclu
Beautiful Home in the heart of Chino, located in the private gated community of Royal Palm Ranch. The home features an indoor laundry room, kitchen nook, outdoor patio with glass sliding door entrance, central A/C, a single car attached garage and carport. The property features two master bedrooms each with their own walk-in closet, high ceilings, and private full bathroom. * * * HOA pays for water, trash, and security service. * * * Great Loacation_ 5 minutes walking distance to the Elementary school, Chino Adult school, Stater Bros supermarket, Restaurantes, Park. About 10 minutes driving distance to reach Chino Spectrum Marketplace, The Shoppes at Chino Hills, Costco, 99 Ranch Marke
Welcome to Greenwood Lane, a beautiful tree-lined street within The Preserve. Resort style living in a commuter friendly location. Close to award winning schools (Cal Aero) and all the amenities in the Preserve. Spacious two-story end unit is almost 1900sf. Downstairs you will find an open floorplan with a small den that is perfect for an home office or study room. The open great room has an upgraded kitchen with center island, granite counter tops and stainless steel appliances. Also a separate eating area built for a full dining table with chairs. The great room also has a fireplace for ambiance. The room leads to an outdoor patio area great for grilling and a morning cup of coffee. Plus
Let me introduce you to 8251 Spirit St. in the city of Chino. This beautifully decorated and upgraded condo is darn near perfection! As you enter on the ground level, you are greeted by a spacious foyer, entrance to the two car garage and a large closet for storage. Step into the garage and you will notice the professionally done epoxy coated flooring in addition to the custom built-in cabinets for all your storage needs. Walk up to the second level, and you will see the spacious and open floor plan. The kitchen was recently remodeled to include white quartz countertops and a stunning backsplash that carries on to the large center island. The family room with the custom built-in electric fi
This area's enrollment policy is not based solely on geography. Please check the school district website for more information.
Elementary schools
Middle schools
High schools
GreatSchools Summary Rating
9/10
Michael G. Wickman Elementary School
Public, K-6
9/10
Butterfield Ranch Elementary School
Public, K-6
8/10
Edwin Rhodes Elementary School
Public, K-6
8/10
Gerald F. Litel Elementary School
Public, K-6
8/10
Glenmeade Elementary School
Public, K-6
Only showing 5 of
22 elementary schools.
School data is provided by GreatSchools, a nonprofit organization. Redfin recommends buyers and renters use GreatSchools information and ratings as a first step, and conduct their own investigation to determine their desired schools or school districts, including by contacting and visiting the schools themselves.Redfin does not endorse or guarantee this information. School service boundaries are intended to be used as a reference only; they may change and are not guaranteed to be accurate. To verify school enrollment eligibility, contact the school district directly.
Homes for sale in Chino have a median listing price of $689K. Some of these homes are Hot Homes, meaning they're likely to sell quickly.
What are some of the most popular neighborhoods in Chino?
Popular neighborhoods include The Preserve, Central Ontario, College Park, South Ontario, Ontario Ranch, Los Serranos, and North Ontario.
How often does Redfin update their new listings?
Most of our new listings in Chino are updated every 5 minutes so you can see new homes as soon as they come on the market. Learn more
What is transportation like in Chino?
Transportation in Chino, California, is primarily car-centric, with many residents relying on their cars for commuting and travel. The city experiences moderate traffic levels, particularly during peak hours, making driving a common part of daily life. Public transportation is available in Chino, with bus services provided by Omnitrans, offering residents an alternative to driving. Additionally, Chino is conveniently located near several major highways and freeways, including the Chino Valley Freeway (SR 71) and the Pomona Freeway (SR 60), providing easy access to surrounding areas. Learn more on our Chino city guide.
What types of properties are available in Chino?
Chino, California offers a variety of single-family home types, including ranch-style, contemporary, and modern architectural designs, with options ranging from 2 to 5 bedrooms and various year built ranges. These homes can be found throughout Chino, California, in neighborhoods such as College Park, Preserve at Chino, and Cypress Creek. To explore different property types for sale in Chino, California, use the 'Home type' filter located above the active listings. Customize your search by selecting options like single-family homes, condos, townhomes, and more.
What is life like in Chino?
Chino, California offers a unique living experience with its diverse range of amenities and services. The city boasts a picturesque landscape with a mix of urban and suburban areas. The weather in Chino is characterized by mild winters and warm summers, providing ample opportunities for outdoor activities. The city also provides a variety of job opportunities across different industries, ensuring a thriving local economy. Residents can explore a multitude of recreational options such as parks, sports facilities, and community events, fostering an active and engaging lifestyle.
What are the schools and amenities like in Chino?
Chino, California is a city rich in amenities that cater to the diverse needs of its residents. The city boasts a variety of dining options, with numerous restaurants offering a wide range of cuisines. For those who love the outdoors, Chino is home to several parks that provide spaces for relaxation and recreation. Grocery shopping is convenient with the presence of multiple grocery stores throughout the city. Additionally, Chino offers other amenities such as libraries, fitness centers, and community centers, ensuring a comfortable and convenient lifestyle for all residents.
In the past month, 48 homes have been sold in Chino. In addition to houses in Chino, there were also 50 condos, 22 townhouses, and 2 multi-family units for sale in Chino last month. Chino is a minimally walkable city in San Bernardino County with a Walk Score of 44. Chino is home to approximately 77,518 people and 35,733 jobs. Find your dream home in Chino using the tools above. Use filters to narrow your search by price, square feet, beds, and baths to find homes that fit your criteria. Our top-rated real estate agents in Chino are local experts and are ready to answer your questions about properties, neighborhoods, schools, and the newest listings for sale in Chino. Our Chino real estate stats and trends will give you more information about home buying and selling trends in Chino. If you're looking to sell your home in the Chino area, our listing agents can help you get the best price. Redfin is redefining real estate and the home buying process in Chino with industry-leading technology, full-service agents, and lower fees that provide a better value for Redfin buyers and sellers.


 REDFIN IS COMMITTED TO AND ABIDES BY THE FAIR HOUSING ACT AND EQUAL OPPORTUNITY ACT. READ REDFIN'S FAIR HOUSING POLICY AND THE NEW YORK STATE FAIR HOUSING NOTICE.
 United States
 Canada