Step into the spacious and inviting ambiance of this single-level Mesa del Mar home, perfectly positioned on a sprawling lot. Boasting a well-designed floorplan, this residence features three bedrooms and two full bathrooms, offering over 2,200 square feet of comfortable living space. The property also includes a separate casita, providing versatility and additional space for various needs. Recently renovated and painted, the kitchen, flooring, and bathrooms showcase modern updates and stylish finishes, enhancing the overall appeal of the home. The large 2-car garage offers convenience and ample storage space for vehicles and belongings. It also features solar panels to save money on power
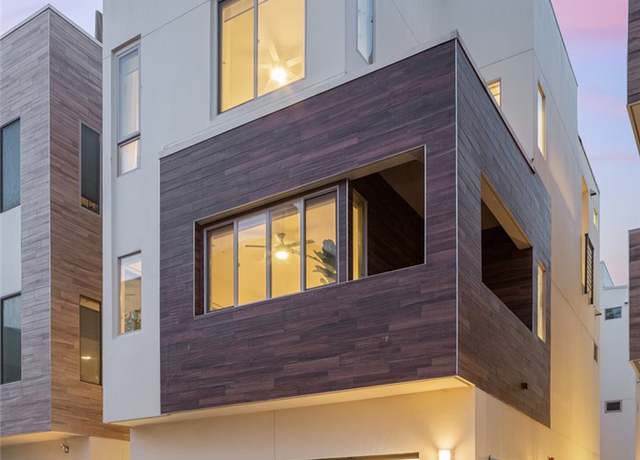
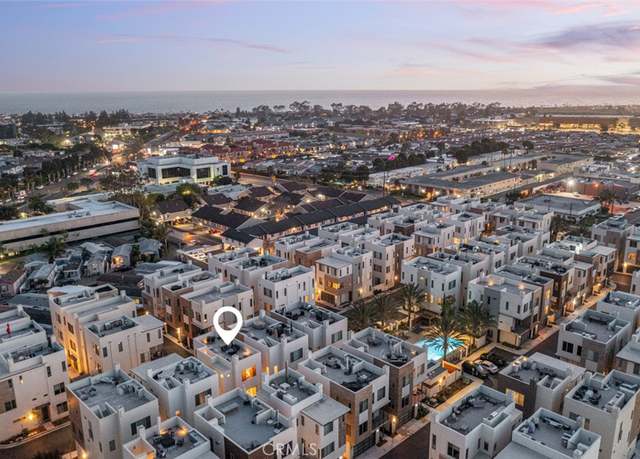
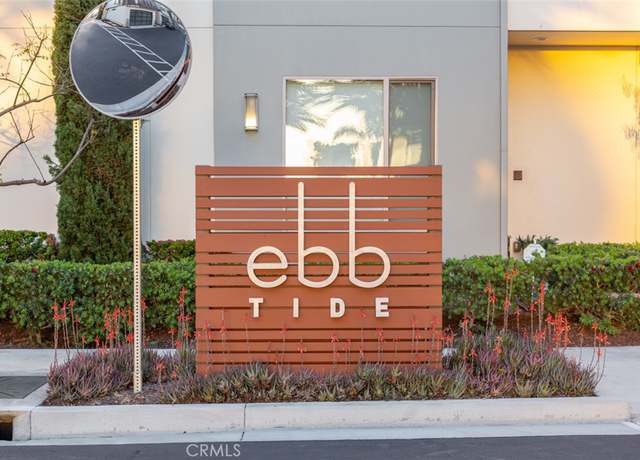
This 2018 modern contemporary tri-level home sits west-facing on the interior of the Ebb Tide community, giving optimal sunset views from each floor and direct ocean views from the rooftop. Its setback location allows for a bright space, showered in natural light that spans 1,719 sqft. The Plan 1 open-concept living space has had custom touches beyond the builder spec. across all three levels, offering an exceptional living experience in one of Newports best beach-city communities. The interior is not only aesthetically pleasing but meticulously maintained to perfection. Inside, discover a chef's dream kitchen featuring top-of-the-line appliances including a gas stove, wine fridge, tankless
Discover the perfect blend of comfort, style, and convenience at 347 E. 18th St. Unit C, located in the vibrant heart of Eastside Costa Mesa. This stunning 3 bedroom, 2.5 bathroom single-family attached home spans over 1,543 square feet of well thought out designed living space, ideal for everyday living. The recently painted interior in soothing, contemporary tones complements the sleek laminate wood flooring that extends throughout the first floor, creating an inviting atmosphere from the moment you enter. The living area is spacious and well-lit, featuring a cozy fireplace that offers the perfect backdrop for both quiet evenings and lively gatherings. The heart of the home, the kitchen,
The finishing touches are being completed at this masterfully reimagined residence, 354 La Perle Lane in Eastside Costa Mesa. Meticulously designed and constructed by renowned Cascade Development, this single level residence seamlessly offers a perfect blend of style, comfort, and functionality. The main home features 4-bedroom, 3.5-bathroom and 2413 square feet of living space. Step inside and be greeted by an open floor plan that seamlessly connects the living, dining, and kitchen areas, creating an inviting space for both relaxation and entertainment. Enjoy using the versatile great room featuring an eat-in kitchen with quartzite countertops, marble, and quartz interior and plenty of cus
Welcome to 1653 Labrador Drive, conveniently located in beautiful Mesa Verde! This delightful residence exudes elegance from its meticulously maintained exterior to its thoughtfully designed interior. Set against a backdrop of lush landscaping, the charming facade is accentuated by the presence of a tranquil water fountain both in the front and rear yards, creating a serene ambiance. Spanning 2169 square feet on a single level, this home is situated on a spacious lot just shy of 8000 square feet, providing ample space for relaxation and entertainment. As you step inside, you are greeted by a generously sized living room seamlessly connected to an adjacent dining area, ideal for hosting gat
Enjoy the best of Costa Mesa and Newport Beach in this fabulous location situated just off the 55 FWY adjacent to the Eastside, walking distance to the Triangle, and a short drive or bike ride to the beach! Tucked away in the back of a small cul-de-sac, this hidden gem provides a quiet and serene location. This 2012 beauty boasts all the comfort and luxuries of a newer home with 10-foot ceilings, recessed lighting, gorgeous hardwood floors, quartz counters, an open floor plan ideal for entertaining. A grand kitchen island serves as the focal point of the main living area. Cabinetry and counter space abound in this well-designed kitchen complete with a walk-in pantry and stainless-steel appl
Nestled in the heart of Prime Newport Heights, this residence graces a charming cul-de-sac, offering a picturesque setting. You will be delighted with the natural light that illuminates the main living spaces. The kitchen, with its quaint charm, features pristine white cabinets, granite countertops, and a captivating waterfall island. Seamlessly connected, the dining and living areas where there is plenty of space to gather. Step into the expansive family room, where a cozy fireplace invites relaxation. French doors lead out to the patio and sprawling grassy backyard, creating an ideal space for entertaining amidst lush, mature landscaping. Downstairs, two bedrooms, including a primary suit
Step inside the coolest house on the block. 2240 Anaheim Ave is a creative exploration for the senses. Brand new construction, fully permitted, there isn’t a single item in this house that’s not new and unused. Nestled in the heart of Westside Costa Mesa, this premier cul-de-sac location is a short walk or bike ride to Banning Ranch, your favorite coffee shop, and plenty of other hidden Westside gems. Fresh wildflowers and fragrant native Californian plants lead you to the modern surf inspired pine front door. Walk inside and notice the custom European oak, engineered hardwood floors, with tons of natural light reflecting through the open windows throughout. The lighting fixture
Welcome to 3202 Vermont Ave, nestled in the desirable Mesa Verde community of Costa Mesa. This meticulously remodeled 3-bedroom, 2-bathroom home exudes modern elegance and comfort. The owners spared no expense in transforming this residence into a sanctuary. Fresh paint and a new roof greet you upon arrival, while full insulation ensures year-round comfort. Inside, the open-concept living area invites you to relax and entertain. Enjoy the convenience of a smart home system and revel in the culinary delights prepared in the fully remodeled kitchen, featuring custom cabinets with soft-close doors and a new Wolf branded gas range. This home also boasts a new HVAC system, recessed lighting thro
Single Story Home with 3 Bedroom & 2 bath on a 7200 square foot plus lot (per assessor). Cosmetic fixer, with a newer roof, brand new furnace and new water heater. This home has a comfortable family room as you enter. The kitchen will need some updating. The bedrooms are good size. And the lot. .. a huge backyard with a covered patio with lots of entertaining space for BBQ's & parties. The backyard has a big grassy lawn area that is ideal for gardening. Huge potential for an Auxiliary Dwelling Unit - ADU. There is a two-car attached garage and a nice long driveway for parking. The home is close to schools, shopping, and not far from the freeway. Welcome Home!
Nestled in the heart of the highly sought-after neighborhood of Eastside Costa Mesa, 227 Virginia stands as a testament to modern luxury and meticulous craftsmanship. Boasting a spacious layout expanded and fully remodeled in 2022, this exquisite residence offers 5 bedrooms and 4 bathrooms, including a lavish primary suite with a sprawling bath and designer walk-in display closet. Step inside to discover a fully remodeled kitchen, a culinary enthusiast's dream, equipped with top-line appliances and a sleek island featuring a waterfall quartz countertop. Solid oak flooring guides you through the home, while bifold door systems seamlessly merge indoor and outdoor living. Entertain effortlessl
Welcome to 235 Santa Isabel, your private escape in Eastside Costa Mesa. A short walk to Newport Back Bay and nestled away from the road, this spacious 4-bedroom, 3-bathroom 2,180 square foot home offers ample natural light and privacy. Enter to find soaring vaulted ceilings, a light-filled living room and modern, sleek kitchen with high-end Bosch and LG appliances and ample storage. Step outside to your very private yard for entertaining equipped with a firepit and turf. Find one of the bedrooms and bathrooms downstairs, along with the attached 2-car garage. Step upstairs to 3 additional bedrooms, including the primary suite, a landing perfect for a workspace or play-area for kids and a co
Welcome to your dream home in the heart of Mesa del Mar! Nestled on one of the quietest streets, this exceptional 3-bedroom, 2-bathroom sanctuary awaits its new owner. Step inside and be captivated by the seamless blend of modern elegance and warmth. Walls have been expertly removed to create an open, inviting atmosphere, perfect for both daily living and entertaining. The remodeled kitchen is a chef's delight, boasting crisp white cabinetry, a sleek subway tile backsplash, and luxurious quartz countertops that elevate the space to new heights of sophistication. Every detail has been carefully curated, with the bathrooms receiving the same exquisite treatment, featuring beautiful finishes t
Welcome to 2060 Monrovia Ave, a charming Mid-Century home on a large lot nestled inside the Freedom Homes in Costa Mesa. Here you’ll find expansive lots, tree-lined streets and a warm neighborly community - its the place that people think about when they think ‘they don’t make them like the used to’. If your dream home has space to roam, entertain, and enjoy the year round ocean breezes, then this is the one for you. Less than 3 miles from the beach, a short walk to the incredible Canyon Park, and expansive back and front yards - this home has so much to offer. Inside is a refreshed interior with new luxury vinyl flooring, paint, a charming living space and a roomy k
Welcome to 308 Vista Baya, the architectural gem that melds the best of Mid-century modern design with today’s modern luxuries, nestled on a quiet, coveted cul-de-sac in Eastside Costa Mesa. Enter through the bright, quintessential Southern California Dutch doors to a rare, welcoming courtyard before entering the sprawling 3 bedroom, 3.5 bathroom, 3,445 square foot home. The home, created by Adam Wheeler and built by trusted Christiano Homes lives mostly on the main level with floor-to-ceiling windows and doors that capture abundant natural light and blur the lines between indoor and outdoor living. Ideal for both relaxing and entertaining, the living and dining rooms meld seamlessly
Welcome to 617 17th St, a modern luxury residence constructed in 2015 encapsulating the spirit of live-work living with its inviting open design, dedicated workspace, high ceilings, eco-friendly attributes, and a large rooftop hangout. The entry to this property greets you with a secure front courtyard, an office, an ADA compliant restroom, and a convenient attached two-car garage. Taking you to the second tier of the home, you'll find elegant hardwood flooring, an integrative kitchen design that seamlessly merges with the living area, paired with a bedroom and a full bath. The upper level completes with dual master suites, a utility room, and a sun-bathed loft space with spectacularly high
Newly built by Thomas James Homes located in the Dover Shores neighborhood within Newport Beach offers a 5 bedroom, 5.5 bath home with a show stopping exterior. Just as you enter the property, a perfectly tucked in bedroom with a full bath, walk-in closet, and a sliding door to the beautiful courtyard, is perfect for any overnight guests. Walking past the powder bath, the sliding doors of the hall open up to the courtyard before entering the main part of the home. The open concept floorplan of the great room has a vast yet homey feeling as the gas fireplace directly aligns to the sink in the gourmet kitchen. The kitchen has top appliances, plenty of counter space, an island with bar se
Nestled within the highly coveted Flower Street of Eastside Costa Mesa, this property presents an enticing blend of charm, functionality, and investment potential. Boasting a charming main house and a separate guest cottage, this residence offers versatility and convenience in one of Orange County's most desirable neighborhoods. The main house welcomes you with a picturesque front porch leading to a classic Dutch door entry, setting the tone for the warmth and character found within. Spanning approximately 1,380 square feet, the main residence features three bedrooms and two bathrooms, providing ample space for comfortable living. The open-concept layout seamlessly integrates the family roo
We are pleased to present the sale of 246 Walnut Street, a 3-unit multifamily property located in the City of Costa Mesa. This pride of ownership property features a favorable mix of units with (2) 2 bedroom / 1 bathroom units and (1) 1 bedroom / 1 bathroom unit. Each bungalow is detached from one another and have been nicely remodeled boasting laminate flooring, quartz countertops, white cabinetry, stainless steel appliances, dual pane windows, and recessed lighting. The property sits on an oversized lot measuring approximately 11,761 SF and two of the units had a new roofs installed in 2023. Tenants enjoy close proximity to beaches, parks, The Triangle, and all the amenities 17th Street
Nestled in the vibrant heart of Newport Heights, this stunning condo offers the epitome of coastal living. Embrace convenience with close proximity to Newport Beach’s shopping, dining, and 17th Street attractions, while enjoying easy access to the renowned mile-long beaches and John Wayne Airport. The lower level boasts vaulted ceilings and a contemporary kitchen adorned with lacquered flat-faced white cabinetry, quartz counters, and top-of-the-line Miele, Wolf, and Thermador appliances. A sunlit breakfast nook flows seamlessly into the private backyard oasis, complete with seating and a barbecue area for al fresco dining under the stars. Upstairs, the primary suite exudes modern beac
Brand new 2023 Skyline home. 2 bedrooms 1 bedroom with living space of 740sq/ft. Home including stainless steel refrigerator, stainless steel gas range, stainless steel dishwasher and stainless steel microwave with range hood. Pantry closet and island in kitchen, full height mosaic backsplash and stainless steel undermount sink. Quartz countertop through out home. Ceiling fans in both bedrooms and living room. Monthly space rent is $1,125.
Welcome to the enchanting Brighton Springs, is sought after Costa Mesa. A secluded oasis awaiting your arrival, nestled in privacy, this single-story, one-bedroom, one-bathroom residence offers everything you've been dreaming of and more. From the moment you step inside, quality emanates from every corner, inviting you into the open floor plan designed for comfort and style. The kitchen is a vision of elegance, boasting spaciousness highlighted by white Shaker cabinetry, floating shelves, stainless steel hood vent, pendant lights, Quartz center island and stainless steel appliances. In the living and dining area sliding glass doors frame breathtaking views of the serene creek, ducks, adorab
Enjoy OC Coastal Lifestyle with this elegant single family 3 bed 3 bathrooms in Newport Beach. The entry way welcomes you to thoughtfully landscaped flower garden. Once you enter the house, you are greeted by bright lighting fixtures, modern color flooring, high ceilings, wide expanse windows creates the bright natural light throughout. There is the spacious living room with fireplace and a unique custom-made audio system. Perfect for entertaining friends and family. There are seamlessly connected to the remodel up graded-kitchen, including all new white quart granite counter-top, stainless-steel appliances and brilliant white cabinets. Upstairs leads to the master bedroom, master bath wi
When embarking on the ground up new construction of this residence, our inspiration stemmed from the serene beauty of the Upper Newport Bay nature preserve, affectionately known as "Back Bay. " We highly recommend a visit to Back Bay to immerse oneself in its rare, harmonious vibrations and the natural energy of its wildlife, enriching the experience of touring this home. Our vision encapsulates a novel approach, merging modern living with harmonious design principles. Every aspect of this home, meticulously crafted with attention to detail, is tailored to complement contemporary lifestyles and mindful living practices. Here are some notable features of this meticulously designed
COMMERCIAL IN THE FRONT AND RESIDENTIAL IN THE BACK * * Prime Mixed-Use Property in Eastside Costa Mesa * * * * one of the best and amazing Location, Location, Location in town; must see! * * Situated in the highly sought-after community of Eastside Costa Mesa, this unique property offers a blend of residential comfort and commercial opportunity. Here are the key features:1. * * Mixed-Use Gem: * * - A rare find, this property combines a * * 2-bedroom, 1-bathroom house * * with a * * 2-car garage * * and a * * commercial section * * . - The front section boasts * * 6 rooms * * , perfect for various business ventures, such as real estate, antiques, tailoring, or pr
The home is centrally located in the heartbeat of Costa Mesa. Points of interest; Segerstrom Center for the Arts, South Coast Plaza, The CAMP, The LAB, Metro Point. Minutes away from the John Wayne Airport, multiple beaches nearby, and Orange Coast College. The home has been remodeled and updated. Highly desired 6 bedrooms, 3 bathrooms single family resident, approximately 2400 sq. ft. , lot size approximately 6,029 sq. ft. on a quiet cul-de-sac. The 6th bedroom is extra extra large with french doors and a “Juliet” style balcony. The new electrical panel box has been updated to 200 amp, new 80+ recessed lights throughout the house, new Milgard double pain windows throughout the
Located in tranquil Brookview community in the South Coast Metro area, on a cozy corner location with sunny patio with direct garage access in resort-style setting with amenities, that includes tennis courts, swimming pools, spa, and a clubhouse, with ample parking located near 405 and 55 freeways, south coast plaza and other convenient shopping businesses , parks, and nearby beaches. Kitchen has recessed lighting, designer black refrigerator, custom built in wine storage, beautiful wood cabinetry and glass tile look backsplash. The open floor plan Livingroom and dining room boosts appealing plank flooring and focal point fireplace the sliding glass door leads to wrap around patio perfect
Welcome to 219 Albert Place, a beacon of luxury nestled in the vibrant heart of the desirable Eastside Costa Mesa. Freshly crowned with a new roof and illuminated by natural light via double dome skylights, this residence is the pinnacle of modern comfort and sophistication. Cross the threshold into a realm of elegance with Arcadia African flooring guiding you through a versatile layout, offering three bedrooms plus a dedicated office or optional fourth bedroom, complemented by three sleek bathrooms. The heart of the home is a chef’s delight, with a grand 11-foot island kitchen, state-of-the-art appliances, dual dishwashers, and a 120-bottle wine cooler—all framed by a full-serv
Welcome to 2009 Continental, a part of the Freedom Home Tract: on one of Canyon Park's premier tree-lined streets, just minutes to the beach, shopping and entertainment. Upon arriving, up the custom new driveway and private front porch, the home has recently been expanded to 3 bedrooms and 2 bathrooms including a laundry room. The primary bedroom and bath have recently been added and it is a must see. The living room features a cozy fireplace, just adjacent to the kitchen. The backyard is perfect for entertaining with plenty of privacy, covered patio and 5 fruit trees. This home is also located within a few miles of plenty of shopping, the beach and award winning schools.
This stunning house has undergone a complete transformation, leaving no detail untouched. Featuring trending coastal designs, the interior of the house exudes a light, bright, and inviting atmosphere. The kitchen boasts a beautiful waterfall island, complemented by accents of white oak on the floors and ceiling beam. With 3 bedrooms and 2 bathrooms, including a master bathroom en-suite, this home offers ample space for comfortable living. The bathrooms feature warm tones and floating vanities, adding a touch of luxury to the space. The large fenced backyard oasis is perfect for kids and pets, providing a peaceful outdoor retreat. Convenience is key in this home, with the washer and dryer in
190 Cecil Place presents a fantastic opportunity to own a spacious single-family residence in Eastside Costa Mesa! Upon arrival you are greeted with a red brick lined walkway and charming white picket fence leading you to the entry. Step inside to the first floor featuring an open floorplan kitchen and dining area, half bathroom, formal living room with a fireplace, custom window treatments, and recessed lighting. Elegant custom Travertine tiles line the floors and compliment the kitchen’s cherry wood cabinets. Make way to the second floor which hosts 3 bedrooms, 2 bathrooms, and a versatile office/den that could be converted to an additional bedroom. The primary bedroom is complete w
Step into the opportunity of a lifetime with 2190 Pacific Ave, where the SoCal dream awaits! Calling all builders, developers, and families with a passion for creativity—this isn't just a house, it's a canvas for your imagination, a chance to craft the home you've always envisioned. Imagine the possibilities: three bedrooms, two baths, and 1724 square feet of potential, all nestled on an expansive 11088 square feet lot. Built in 1926, this Spanish-style gem radiates charm and history, just waiting for your personal touch to bring it back to life. But here's the kicker: it's zoned R2-MD, meaning you could potentially add one more unit plus 2 ADUs, subject to city approval! This is your
Location! Location! Location! Rare to find 6 bedrooms & 3 Bathrooms, recent renovated open space single family house. 5-9 mins away to Newport Beach Pier, South Coast Shopping Plaza, OC Fair & Event Center, parks, golf courses, schools, restaurants, markets & more. .. Lovely home nestled in a fabulous, quiet neighborhood. Perfect house newly remodeled with extraordinary designs & high-end appliances. This beautiful single family house has large front yard and backyard! 2 glass French doors in the living room & open space to the outside backyard area. Beautifully new remodeled kitchen has custom cabinetry, granite counters w/ build-in wine cooler & wine ra
Welcome to 222 Costa Mesa St, a stunning duplex offering the epitome of coastal living in the desirable Eastside Costa Mesa neighborhood bordering Newport Beach. Boasting two separate entrances and addresses, this exceptional property presents a rare opportunity for both homeownership and investment. Unit 220 is a charming 1 bed 1 bath retreat. This cozy unit features its own private backyard, offering a serene outdoor oasis for relaxation and entertaining. 222 Costa Mesa St is a luxurious 4 bed 4 bath residence exuding elegance and sophistication. This expansive unit enjoys its own yard space, two separate 2-car garages, and ample room to roam. Entertain with ease in the gourmet kitchen, e
Rare Eastside Costa Mesa TRIPLEX Property is on the market for the first time in decades. Currently configured as 3 Single Level Bungalows: each unit is a 2 Bedroom, 1 Bathroom, Single Level property with approx 700 sqft of space. Each unit has some exterior space. Unit A has a large yard. A 3 Car detached garage offers each unit a 1 car garage and there is a community laundry room attached to the garage (app operated for additional landlord income). The property is grandfathered as a triplex, but is currently zoned R-1 Residential. Location, Location, Location. .. in the great eastside Costa Mesa neighborhood behind Mother's Market at 19th and Newport Blvd. Lot size is 8,813 sqft per the a
Great East Costa Mesa location. (Owner financing available with 20 year term @5%) Property has a 5 car garage perfect for collectors! Comes with private Gated courtyard and large backyard, great for family with children and dogs. Walking distance to upper Newport bay nature preserve. Downstairs: Open floor plan with Office/Bedroom or Nursery with full bath. Upstairs: 4 full bedrooms 4 full baths, with laundry on the upper floor.
Indulge in the epitome of luxury living in this soon-to-be a finished property by Thomas James Homes! Step inside the 5 bed, 4.5 bath open-concept floorplan from the front entry from where your eyes will gaze from the gorgeous living room with a gas fireplace to the dining room with beautiful French doors that open up to a side yard patio for informal outdoor entertaining. Relax in the spacious great room with gas fireplace and sliding doors to the California room allowing for an indoor/outdoor experience, perfect for year-round entertaining. The gourmet kitchen has an island with a Wolf and Sub-Zero appliance package, a butler's pantry, and large walk-in pantry. Enjoy an impromptu meal in
Live the coastal dream and make this ocean-view haven your own personal sanctuary, don't miss this rare opportunity to be on the ocean-view front row in this exclusive community. Nestled within a coveted location, this exquisite residence offers a perfect blend of luxury and comfort. This home has an incredible 28 mile stretch of Pacific Ocean Views. Featuring modern amenities, this beautifully crafted 4 bedroom/4.5 bathroom newer developed home is filled with elegance and timeless charm touched by a shabby chic inspired style on an ideal lot that provides epic views of Catalina from almost every room. Every inch is thoughtfully designed to provide an exciting living experience. Upon enteri
Beautifully condominium unit located in a good, well-maintained Community in Costa Mesa Metro. 5 minutes to South Coast Plaza, 7 mins to John Wayne Airport, 10 minutes to Orange Coast College. This is a good home for starting family!!! Centrally located and easy to access to 405 and 55 Freeway and close to Shopping Center, Super Market, Restaurant and must more. .. MUST SEE!!!
Gorgeous renovated single-story home in the heart of Mesa Del Mar. 4 bedrooms. 2 bathrooms. Open floor plan. Stunning remodeled kitchen featuring: quartz countertops, oversized island, full wall custom tile backsplash, stainless steel appliances—perfect for entertaining! Large primary bedroom with a walk-in closet. New flooring, windows, baseboards, fixtures, hardware, paint throughout. Beautiful newly remodeled bathrooms. This charming home sits on a generous lot with a large backyard offering potential for a pool, enhanced by its attractive curb appeal. Located close to shopping, dining, parks, and entertainment, it combines style, comfort, and convenience in a prime location.
This area's enrollment policy is not based solely on geography. Please check the school district website for more information.
Elementary schools
Middle schools
High schools
GreatSchools Summary Rating
9/10
Killybrooke Elementary School
Public, K-6
9/10
Maude B. Davis Elementary School
Public, K-6 • Choice school
8/10
California Elementary School
Public, K-6
8/10
Eastbluff Elementary School
Public, K-6
7/10
Gisler (robert) Elementary School
Public, K-5
Only showing 5 of
24 elementary schools.
School data is provided by GreatSchools, a nonprofit organization. Redfin recommends buyers and renters use GreatSchools information and ratings as a first step, and conduct their own investigation to determine their desired schools or school districts, including by contacting and visiting the schools themselves.Redfin does not endorse or guarantee this information. School service boundaries are intended to be used as a reference only; they may change and are not guaranteed to be accurate. To verify school enrollment eligibility, contact the school district directly.
Homes for sale in Costa Mesa have a median listing price of $1.5M. Some of these homes are Hot Homes, meaning they're likely to sell quickly.
What are some of the most popular neighborhoods in Costa Mesa?
Popular neighborhoods include Santa Ana, Eastside Costa Mesa, Newport Heights, Westside Costa Mesa, Mesa Verde, Dover Shores, South Coast, Balboa Peninsula, Eastbluff, and Santa Ana Heights.
Costa Mesa, California offers a variety of transportation options, including a robust public transportation system. The OCTA (Orange County Transportation Authority) provides bus services throughout the city, making commuting convenient for residents. For those who prefer to drive, traffic levels can be high during peak hours, especially on the nearby I-405 and State Route 55 freeways. Despite this, the city's infrastructure supports smooth car travel, making it a viable option for getting around. Learn more on our Costa Mesa city guide.
What types of properties are available in Costa Mesa?
Costa Mesa, California offers a variety of single-family home types, including ranch-style homes, contemporary homes, and modern homes, among others. These homes can be found throughout the city, with ranch-style homes predominantly located in the Mesa Verde neighborhood, contemporary homes in the Eastside Costa Mesa area, and modern homes scattered throughout various neighborhoods. Most properties feature 3-4 bedrooms and were built in the 1960s to present. To explore different property types for sale in Costa Mesa, California, use the 'Home type' filter located above the active listings. Customize your search by selecting options like single-family homes, condos, townhomes, and more.
What is life like in Costa Mesa?
Costa Mesa, California offers a vibrant and dynamic living experience. The city boasts a diverse range of landscapes, from beautiful beaches to scenic parks and nature reserves. The weather in Costa Mesa is characterized by mild winters and warm summers, making it an ideal place for outdoor activities year-round. The city is home to a thriving job market, with a variety of industries such as technology, healthcare, and retail offering ample employment opportunities. Residents can indulge in a wide array of recreational activities, including shopping at upscale boutiques, dining at trendy restaurants, and exploring local art galleries and theaters.
What are the schools and amenities like in Costa Mesa?
Costa Mesa, California offers a variety of public amenities to cater to the lifestyle needs of its residents. Yes, there are numerous restaurants serving a wide array of cuisines to satisfy diverse culinary preferences. For those who enjoy outdoor leisure, the city is home to several parks providing serene environments for relaxation. Grocery stores are also plentiful, ensuring convenient access to daily necessities. Moreover, Costa Mesa boasts additional amenities such as fitness centers, libraries, and shopping centers, enhancing the quality of life in the city.
In the past month, 53 homes have been sold in Costa Mesa. In addition to houses in Costa Mesa, there were also 15 condos, 17 townhouses, and 19 multi-family units for sale in Costa Mesa last month. Costa Mesa is a moderately walkable city in Orange County with a Walk Score of 65. Costa Mesa is home to approximately 109,994 people and 80,790 jobs. Find your dream home in Costa Mesa using the tools above. Use filters to narrow your search by price, square feet, beds, and baths to find homes that fit your criteria. Our top-rated real estate agents in Costa Mesa are local experts and are ready to answer your questions about properties, neighborhoods, schools, and the newest listings for sale in Costa Mesa. Our Costa Mesa real estate stats and trends will give you more information about home buying and selling trends in Costa Mesa. If you're looking to sell your home in the Costa Mesa area, our listing agents can help you get the best price. Redfin is redefining real estate and the home buying process in Costa Mesa with industry-leading technology, full-service agents, and lower fees that provide a better value for Redfin buyers and sellers.


 REDFIN IS COMMITTED TO AND ABIDES BY THE FAIR HOUSING ACT AND EQUAL OPPORTUNITY ACT. READ REDFIN'S FAIR HOUSING POLICY AND THE NEW YORK STATE FAIR HOUSING NOTICE.
 United States
 Canada