Let the sun shine in! This adorable home has lots of east facing windows and backs to the greenbelt! What could be better than stepping out your back gate to the greenbelt to run, walk the dog or stroll to the park? This lovely single story is move in ready with three bedrooms, two bathrooms, two car garage, new flooring, new interior and exterior paint, and more! Located in the well-established neighborhood of Davis Manor with its large trees, wide streets and big lots. Enjoy nearby Manor Pool and Mace Ranch Regional Park. Just a short distance to Korematsu and Birch Lane Elementary Schools. Harper Junior High is nearby as well. Easy access to campus, freeways, and airport.
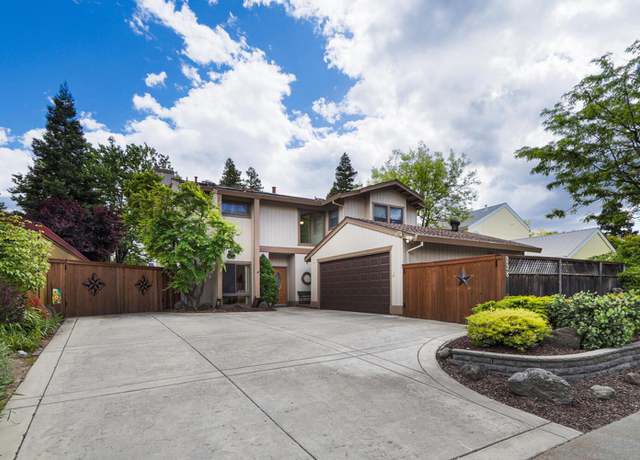
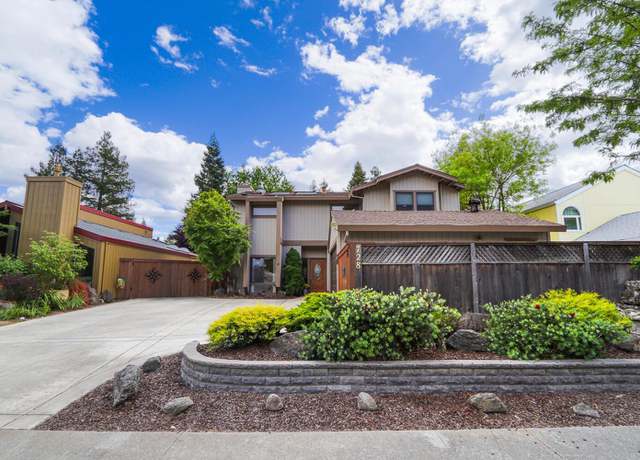
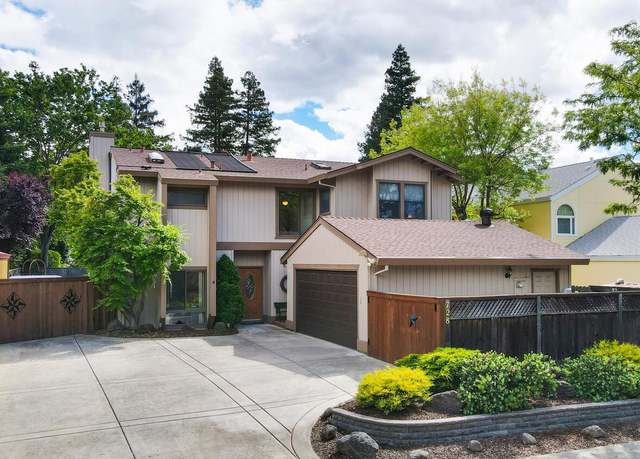
Many happy memories have been made in this impeccably maintained 4 bedrooms; 2.5-bath home by the owners for 40 years. You will love the light and airy living room with gas fireplace, spacious dining and family areas, and a separate office. The large, updated kitchen boasts plenty of cabinets, a gas cook top, dining bar, and kitchen nook. Upstairs, you will find the generous primary suite with vaulted ceiling, and offering dual sinks, skylight, oversized shower with bench, and a walk-in closet. Additionally, there are three other bedrooms, and a full bath with skylight. Relax and enjoy the backyard with family and friends in your built-in pool with solar heating, entertaining patio with tre
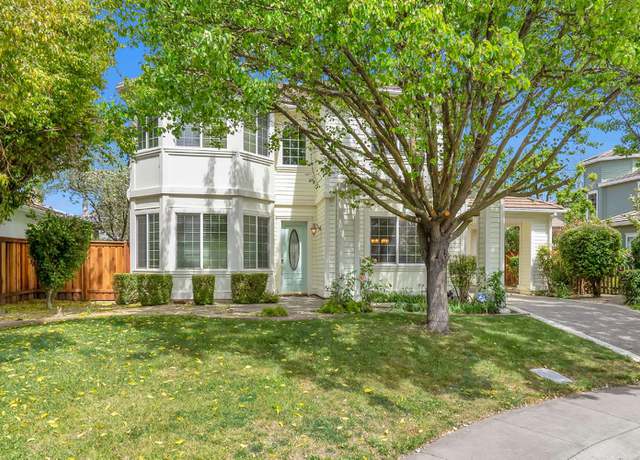
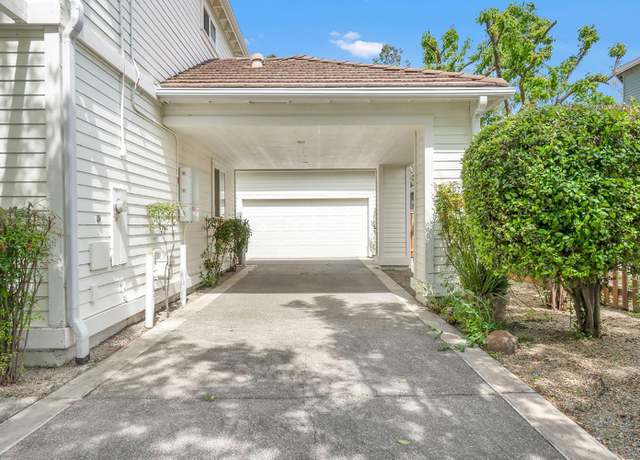
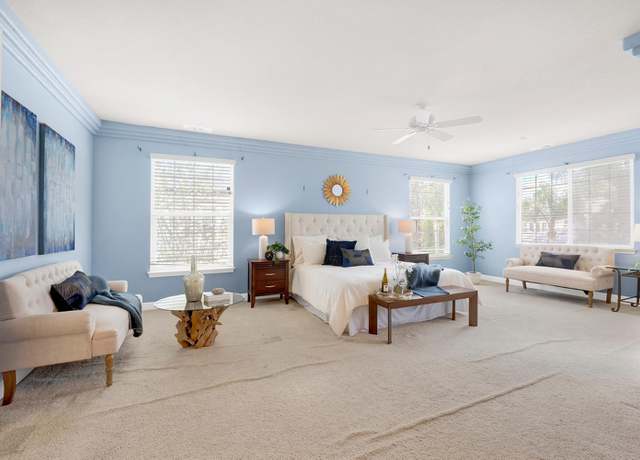
Don't miss the opportunity to put your own finishing touches on this custom, one owner 3,169square foot, 4 bedroom, 2.5bathroom home. Located in the desirable neighborhood of Lake Alhambra in East Davis, you will love the open and functional floor plan with separate living room, family room and dining area, as well as a laundry room with cabinets and outside access. The kitchen features tile granite counters, lots of storage space and views to the backyard with pool and covered patio awning. Upstairs there are 4 bedrooms, including a large master suite with a spa sized master bath with double sinks and walk in closet, soaking tub and shower stall. With money saving 5.040Kw pre-paid leased s
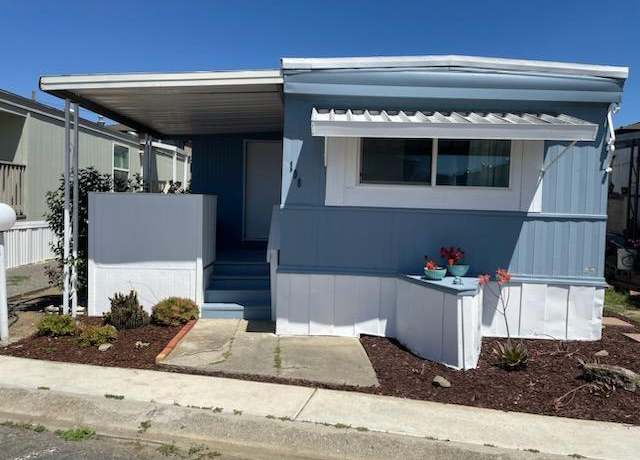
Own your own home in Desirable Davis for UNDER $100k. This lovely renewed home boasts an open and airy space with a second addition making this a 3 bedrooms with laundry/storage area. Newly double rolled roofing, newer windows, refreshed paint through out home with open floor plan. Perfect for anyone looking for the right home at the right price. This is a must see.
This charming remodeled home offers a blend of comfort and sophistication that is sure to impress. Stepping through the elegant French doors, you are greeted by a private brick courtyard, perfect for hosting gatherings or enjoying quiet evenings outdoors. The home's meticulous updates shine throughout, with travertine and wood flooring providing a touch of luxury. The kitchen features pristine granite countertops and white cabinets. The transformation from a four-bedroom layout to a large two-bedroom configuration allows for an extra-large master suite. This master haven includes a cozy sitting area and direct access to the backyard through sliding glass doors, creating a seamless indoor-ou
Discover the perfect blend of comfort and convenience in this stunning single story home, nestled on a peaceful cul-de-sac in the sought after Woodbridge neighborhood of South Davis. Built in 1998, this property boasts a spacious layout spread across 2,554 square feet, situated on a generous 0.238 acre lot. This home features four well-appointed bedrooms and 2.5 bathrooms, including a large master suite with a walk-in closet and a luxurious master bathroom equipped with a jetted soaking tub, ideal for unwinding after a long day. High ceilings enhance the open and airy feel throughout the home, complemented by solar light tubes that bath the space in natural light. The heart of the home is t
FIXER! This is a diamond in the rough. The house has very nice architectural features in the living room and has great potential for an open-concept renovation. Bring your toolbox to replace the floors and the kitchen. One full bath was renovated within the past 5 years. This is a West Davis, premier Stonegate neighborhood. Included in the HOA membership are: access to the lake view clubhouse, tennis court, swimming pool, free pedal boat, and workout room. Located in a cul-de-sac with nice backyard privacy. Enjoy five ceiling skylights that make the house very bright during the daytime. Excellent house orientation, cool in summer, warm in winter. Low maintenance front yard. Renovation plans
Beautifully remodeled home in desirable South Davis. This home features an open floor plan, 3 bedrooms, 2 baths, abundance of natural light & modern amenities. Luxury vinyl flooring & baseboards throughout recently added as well as recessed lighting, new front door, updated bathrooms, new closet doors, recent interior & exterior paint, ceiling fans. Master bath remodel boasts new linen cabinet, closet organizer & quartz countertops. The heart of the home is the exquisite kitchen with large dining island; enjoy beautiful Quartz countertops & stunning backsplash, all new appliances, floating shelves, white cabinetry with designer hardware, pantry closet & f
Welcome to this delightful home whose classic charm and welcoming ambiance evoke a sense of timeless elegance. The home underwent thoughtful renovations in the late 1990s to accommodate the needs of a growing family and to enhance its entertainment potential. The spacious and inviting interior marries modern comfort with retro charm. Natural light floods the entry, creating a welcoming atmosphere. The kitchen adjoins a cozy family room; a separate and spacious formal dining room sets the stage for memorable meals. The ground-level primary suite offers a serene oasis, with a door leading to the lush backyard. The downstairs front bedroom would be a perfect office, while the large upstairs be
1/45
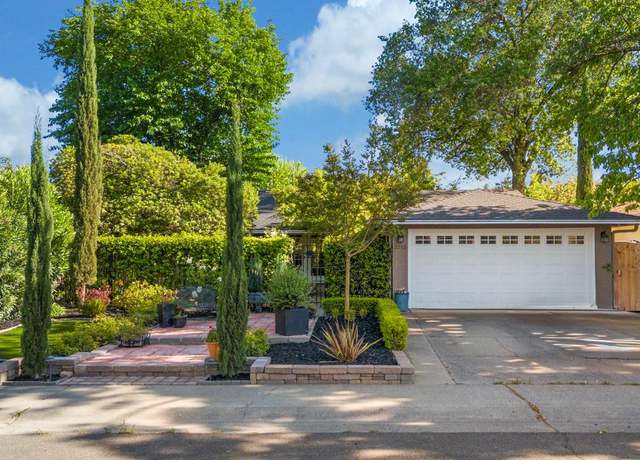
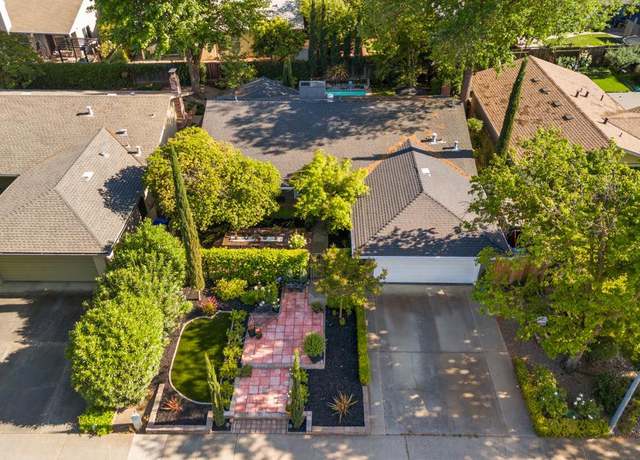
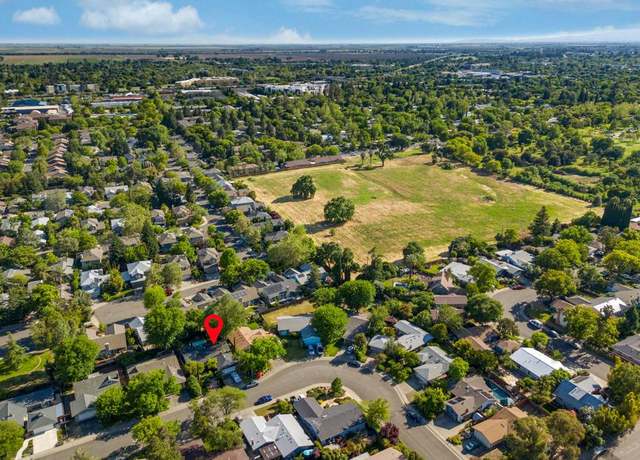
$1,475,000
5 beds3 baths3,097 sq ft0.25 acre (lot)
624 Oak Ave, Davis, CA 95616
RE/MAX Gold, Good Home Group, RE/MAX Gold, Good Home Group
Cozy Single Wide Mobile Home in Davis Creek! This charming residence offers comfortable living in the serene community of Davis Creek. Boasting 2 bedrooms and 2 bathrooms, this single wide mobile home features a newer roof, central heating and air conditioning, and fresh paint both inside and out. The interior has been thoughtfully updated with renovated bathrooms, new flooring, a modernized kitchen, and convenient washer and dryer connections. Residents of this park enjoy access to a range of amenities, including a community pool for refreshing dips on warm days. Additionally, the community center provides a full kitchen and a designated laundry area, enhancing convenience and community li
Introducing a pristine home with stunning views of the Wildhorse Golf Course. This property features four generously sized bedrooms plus additional space for a nursery, office, gym, or cozy sitting area. This large open floor plan beautifully flows from the family room into a modern kitchen equipped with top-of-the-line stainless appliances including a refrigerator and a Culligan water filtration system. The ground floor also has an office with a private entrance, perfect for those who work from home. The large master suite offers privacy and luxury, with a room that adds flexibility to your living space. The property features a substantial laundry room with a built-in sink and cabinets. Co
Take advantage of this RARE OPPORTUNITY to own this Single Story home in the beautiful South Davis community of Oakshade. Spacious Kitchen includes an Island and Stainless Steel Appliances, Fridge is included!! You will love the Open floor plan with newer Laminate Flooring and Tons of Natural Lighting! Beautiful Big Bay Windows and High Ceilings add to this Homes charm! There is also Brand NEW carpeting! LARGE corner lot with impeccable landscaping and garden area with auto-sprinklers and RV parking possible! Transferable solar panel lease with a current rate of $0.17/kWh vs. market rate of $0.39/kWh. Buyer also has the option to purchase the solar panels from Sunrun. Other features include
This distinctive single-story home is just brimming with potential. A large lot on a charming and peaceful tree-lined street in coveted West Davis presents a unique opportunity to create your forever home. The common spaces, which include two separate living areas, offer distinctive design features with open sightlines for entertaining, natural light from multiple skylights, elevated ceilings and uninterrupted backyard views. Refreshed landscaping provides the canvas to create and personalize your ideal outdoor experience. The East-facing back yard, surrounded by mature trees, offers room for a pool, ADU, or expanded gardens and green space. Along with easy access to parks and walking/bikin
Welcome to your meticulously maintained custom-built sanctuary! Step inside to discover an inviting floorplan boasting separate living and family rooms, a charming dining area, and an abundance of natural light. With 3 bedrooms plus an office and 2.5 baths, this home offers ample space to thrive. You'll love the airy ambiance created by soaring ceilings and the corner lot placement. Benefit from leased solar, a front patio for morning coffees, and a spacious master retreat complete with a sitting area, walk-in closet, soaking tub, shower stall, and dual sinks. Outside, enjoy a beautifully landscaped yard, ideal for both relaxation and entertaining, plus plenty of storage to keep everything
Unique ownership opportunity! Current owner took an original Stanley Davis Marin floor plan home and built it up into a 5 bed / 5 bath 2,600+ square foot property which has served as a strong investment for his family for many years. Each bedroom has its own associated bathroom and is currently rented on a month to month basis by the bedroom - rents currently totaling $3,700/mo. Based on current rental comps, I believe the rent collected is at least 10%+ below market. Vacancy has never been an issue, multiple tenants having lived in the property for 3+ years. The nature of this unique property and lease configuration leaves opportunity for creative investors to maximize returns. Come take a
Nestled on the edge of Central Davis, this charming 4-bedroom, 1-bath home is a true gem. Boasting tasteful updates including a modernized bathroom and new flooring, this residence exudes comfort and style. With recent improvements like a brand new roof, water heater, and fresh exterior paint, this home offers not just quality but peace of mind. Step outside to discover a spacious backyard complete with an outdoor storage shed and ample room to craft your own private outdoor sanctuary beneath the canopy of mature shade trees. The addition of central heat and air ensures year-round comfort and climate control for all seasons. Whether you're a first-time homebuyer seeking a cozy abode or an i
A rare find in the highly-desirable, South Davis, Woodbridge subdivision. Beautiful, one story, ADA-designed home with outstanding curb-appeal and a charming porch for watchng all the neighbors go by on their way to the greenbelts. Location provides convenient access to shopping, restaurants, schools, UCDavis and Sacramento, while nestled in a private, tree-lined street. The one-of-a kind, open floor-plan provides high-ceilings with spacious well lit rooms. This home features livin/dining room, opens to office/library, family-room with fireplace, gourmet kitchen, 3 beds, 2.5 baths, huge sunroom for more fun and entertaining, and a 2 car garage. The large, quarter acre, corner-lot is situate
This delightful 3-bedroom, 2-bathroom home offers both comfort & convenience, making it the ideal choice for those seeking a peaceful living space without sacrificing access to local amenities. The interior of the home has been freshly painted, providing a welcoming atmosphere from the moment you step inside. The addition of laminate flooring throughout adds a touch of elegance and ensures easy maintenance, allowing more time to enjoy the things that truly matter. Located in a serene neighborhood, this home is sure to provide a peaceful living environment, ideal for relaxation & family time. The proximity to a park, schools & various shopping options is a significant advan
Live in One Home, Rent the Other. Be impressed with the quality of construction in this beautifully appointed two story Arts & Crafts home in Desirable Central Davis Historic District. Custom built in 2006, the home features all the modern finishes and conveniences today's discriminating buyers expect but in period style. Chef's kitchen featuring high end appliances, farmhouse sink, Carrera marble counters, huge center island and plenty of cabinet space. Convenient setting just a short walk or bike ride to downtown or UCD campus. Three bedrooms, 3 full baths in main house & two car garage. Carriage house offers great rental income or excellent work from home space. Come see this
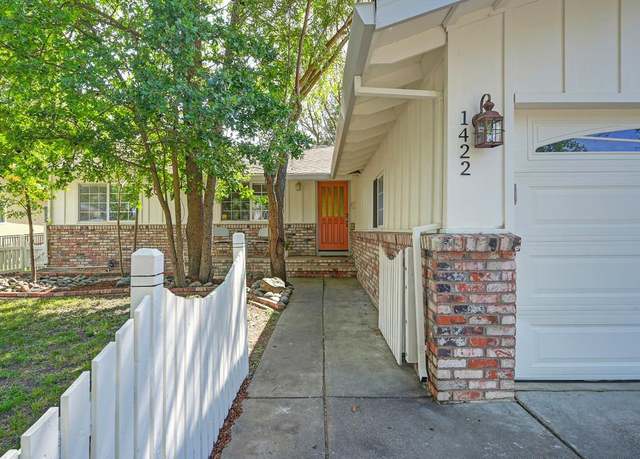
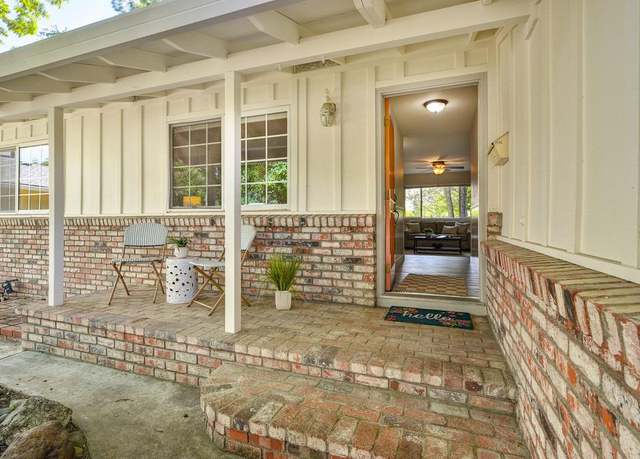
Welcome to your charming oasis in North Davis! This super cute home boasts a private gated courtyard, offering a serene retreat right at your doorstep. Just off the greenbelt, you'll be minutes from schools, playgrounds, the library, Nugget, the Co-op and all of downtown Davis. With three bedrooms and two baths, this bright and cheery abode features skylights that flood the space with natural light, creating an inviting atmosphere for tranquil living. Step inside to discover a welcoming living area complete with a cozy fireplace, perfect for relaxing evenings with loved ones. The well-appointed kitchen is a chef's delight, offering ample storage and a layout designed for convenience and fun
1/47
$668,000
3 beds2 baths1,126 sq ft3,101 sq ft (lot)
2216 Alto Ct, Davis, CA 95616
KW CA Premier - Sacramento, KW CA Premier - Sacramento
Welcome to this stunning Streng built home, meticulously remodeled blending luxurious upgrades with classic mid-century modern charm. Fall in love with the impressive kitchen featuring an added custom pantry, quartz countertops and stainless steel appliances or revel in the updated bathrooms, flooring, roof, HVAC, solar, and more. Enjoy single-level living with 4 beds (3 of which have walk-in closets), 2 baths, and a coveted pool, all just 0.3 miles from Cesar Chavez Elementary and Redwood Park. Enjoy the convenience to nearby UC Davis and downtown Davis, only an 8-minute bike ride. Relax in the backyard oasis or retreat to the cozy hideaway by the primary suite. With low-maintenance landsc
Nestled on a tree-lined avenue in picturesque Lake Alhambra Estates, this residence exudes charm, boasting a spacious two-story layout and delightful gardens in a coveted neighborhood. Spanning 5050 square feet, this home is ideal for multi-generational living. The main floor features a sunlit formal living area with high ceilings, an updated kitchen with quartz countertops and custom cabinets, and a roomy family room. Additionally, there's a generous office space, a bedroom with backyard access, and a full bath. Upstairs, two children's bedrooms and a versatile bonus room await. The expansive master suite includes a spacious bathroom and a private patio overlooking the lush gardens. Adjace
Welcome to 3616 Santo Terrace located in the highly sought after Verona neighborhood of Mace Ranch. This 1751 sqft two-story lovely home boasts 3 bedrooms, 2.5 baths, plus a spacious loft. This home features an open living room, a spacious floor plan and a kitchen with ample cabinetry and plenty of granite countertops creating a spacious area to unwind and entertain. On the second floor, you will find three bedrooms, two full baths and a convenient laundry room. The property also features a convenient 2-car garage for secure parking and Solar by SunPower. This home has been well-maintained and offers a low maintenance yard with a charming patio in the backyard - perfect for outdoor entertai
Nestled within The Cannery community, this single-family residence embodies sustainability and comfort. Offering 3 bedrooms and 2.5 bathrooms with an open floor plan, the home has a net-zero, all-electric system powered by a 4.0 KW owned solar setup, effortlessly offsetting its energy consumption. Inside, the residence features a amazing gourmet kitchen adorned with Caesarstone countertops and backsplash, complemented by top-of-the-line Bosch appliances and an induction cooktop. The kitchen's expansive island comfortably seats four people, serving as a central hub for gatherings and culinary delights. Outside, The Cannery community provides varied amenities, including bike paths, parks, a c
Amazing $165K Price Reduction! Encompassed by lush gardens, this residence infuses traditional design w/ modern details. Wander through the front garden & approach the enchanting interior. A fireplace anchors the welcoming living room while shining hardwood floors guide you through the delightful kitchen where function and form meet. Serve meals in the formal dining room, or enjoy an al-fresco meal on the back patio where the outdoor living is unmatched. Boasting 5BRs, the main home incorporates 2BRs on the entry-level w/ a hall bath. Upstairs, 2BRs accompany the blissful primary suite featuring an incredible walk-in closet & spa-like ensuite. As if this home wasn't abundant eno
Welcome to this cherished 4-5 bedroom, 3.5 bathroom home nestled in the coveted Covell Park neighborhood. Situated at the end of a cul de sac near the North Davis greenbelt, convenience meets tranquility with easy access to parks, schools, and shopping. This spacious abode caters to every need. Downstairs, a versatile room with an attached bathroom and separate entrance is ideal for multi-generational living or a sizable office space. The main floor also features a living room, formal dining area, half bathroom, and an inviting eat-in kitchen leading to a covered patio, perfect for indoor/outdoor living. Upstairs, discover four bedrooms, including a primary suite with an en suite bathroom.
Adorable Cottage in the heart of Central Davis! You will love this beautifully updated/remodeled 2 bedroom, 1 bath home that includes built-in SubZero Refrigerator, Viking Range, Custom cabinets/Quartz countertops, Hardwood floors, Instant Hot water, Stackable Washer/Dryer included, 3 Year old AC, Newer Composition shingle roof, and leaf gutter guards! Zoned R2. Carriage style unattached garage has tons of possibility .
The Owners will miss this special home with loads of character, nestled on an established tree-lined street in North Davis. The gated courtyard immediately welcomes you and your guests with thoughtfully designed landscaping highlighting California native and drought tolerant plants and multiple sitting areas to relax in. This 4 bed 2 bath home boasts a flexible and functional floorplan with a downstairs primary suite and three spacious & bright bedrooms and laundry room upstairs. The back-yard offers peace and privacy with open space behind the home w/ access to miles of walking/biking trails along the North Davis Greenbelt. Conveniently located near shopping, greenbelts, UC Davis,
TINY HOME LOCATED IN DAVIS MOBILE ESTATES ALL AGED PARK. BUILT IN 2022 - 1 BEDROOM, 1 BATH PLUS A LOFT. DON'T MISS OUT ON THIS AWESOME PRICING. THIS HOME IS ADORABLE. KITCHEN INCLUDES: GRANITE COUNTERS, F/S GAS STOVE, GARBAGE DISPOSAL, BUILT IN MICROWAVE, REFRIGERATOR, AND LOTS OF CABINETS. STACKABLE WASHER/DRYER UNIT INCLUDED, DUAL PANE WINDOWS, MINI BLINDS & VERTICAL BLINDS ON THE FRONT SLIDER DOOR. 2 INTERIOR A/C UNITS (ONE IN THE LIVING ROOM & ONE IN THE BEDROOM). HOME HAS LAMINATE LOOKING VINYL FLOORING, ON DEMAND WATER HEATER. NEW TUFF SHED WAS INSTALLED RECENTLY AND INCLUDES 3 WINDOWS AND IS WRAPPED FOR INSULATION. GREAT FLOOR PLAN. CLOSE TO SHOPPING AND TRANSPORTATION.
Rare opportunity! Single family bungalow plus ADU! Your chance to own a piece of Davisville history! This architectural gem was established prior to the University Farm and originally used as a school located on the west side of Davis. Tastefully updated in its current location, the lucky owner will get the best of both worlds: charm, character, central location plus all the modern amenities! It has a modern kitchen, on demand hot water, a wall of windows that light up the dining area and a functional layout with two bedrooms downstairs (cool and quiet!). This sweet bungalow is located in the heart of Central Davis. The Farmers' Market, Central Park, Davis Food Coop, restaurants, art galler
Enjoy your best life, living at the end of a quiet court on El Macero's private golf course. This home boasts fabulous views of hole 6 with tons of natural light. Just a short walk to El Macero Country Club. Vaulted ceilings, 2 bedrooms plus a den and all one story. With a new roof, new electrical panel and freshly painted exterior, this home is ready for a new owner.
Nestled in a serene location, this remarkable residence boasts 5 bedrooms and 4 bathrooms spread across 4,211 sq ft. Enjoy an expansive, light-filled interior complemented by a sprawling, meticulously landscaped backyard, offering a tranquil retreat for relaxation and entertainment. Equipped with a whole-house generator, convenience and comfort are assured at every turn. Retreat to the large master suite featuring stunning views from the patio, epitomizing luxury living. Situated in a peaceful neighborhood with no neighbors behind the property, privacy abounds in this exceptional home.
1/33
$1,975,000
5 beds4 baths4,211 sq ft1.03 acres (lot)
39306 Spyglass Pl, Davis, CA 95616
eXp Realty of California Inc, eXp Realty of California Inc
A beautiful vintage home in the prestigious neighborhood of College Park. The home offers a comfortable floor plan that includes: formal entry, spacious living room, elegant dining room and chariming breakfast area. This gracious home has a basement that is cool year round and perfect for a large collection of wine and a detached 2 car garage and potting shed for that consumate gardener. The first floor has 3 Bedrooms while upstairs there is a large master bedroom with sitting area and library as well as a secondary bedroom. This upstairs suite has a separate entrance and is very private. Original hardwood floors, wood doors, moldings and built-ins add to the unique charm of this home. Loca
A unique opportunity to live in a single story beautiful home nestled in a great neighborhood. This three bedroom, two bath home features formal double door entry way, two separate living spaces with high ceilings and hardwood flooring. Lots of windows bring in natural light throughout the house. Kitchen has great views of the back yard and a custom under-cabinet organization system. The primary suite offers high ceilings and a private outdoor access to large low maintenance backyard with stone patio and a raised planter bed. Spacious 3 car garage with ample space for a workshop, large attic space and good sized side yards are just a few more impressive details. Boasting a prime location,
Welcome to this stunning 4-bedroom, 2.5-bathroom home spanning 1,596 sqft. With $60,000 in recent renovations, this property boasts an inviting open floor plan with luxury vinyl flooring throughout. Step outside to your private oasis featuring a refreshing pool and an upstairs deck perfect for enjoying morning coffees. The kitchen is a chef's dream with stainless steel appliances and a gas cooktop. The living room is a cozy retreat with a fireplace, perfect for gatherings. Conveniently located with easy access to freeway I-80, shopping centers, Wild Horse Golf Club, and restaurants. Don't miss out on this exquisite home!
Charming Davis duplex sits on an oversized corner lot. This property presents an ideal investment opportunity or live on one side and have rent income on the other side. Each side has large bedrooms945 has title floors and 947 has hardwood flooring throughout. Each unit features 2 bedrooms 1 bathroom. Dining area and living room and one car garage. Nice sized backyards that require little care.
Located in the most desired places to live in the city of Davis sits this wonderful home waiting for you to own. Entering you will be greeted with high ceilings and stunning stair way. Open layout with carpet throughout the family room and dining room. A spacious kitchen with long island and well maintained cabinets. Spacious Master bedroom with clean master bathroom. Well kept bedrooms with carpet throughout and wonderful bathrooms. Outside you will be amazed by the big yard with landscaping designed and space for family events. Close by shopping centers, schools, and parks. This home is perfect for first time buyers and investors. Price to sell fast. Dont miss out
Explore 259 Quarter Cir, a delightful 3-bedroom , 2-bathroom residence nestled in Davis' esteemed 55+ Rancho Yolo Mobile Home Park. This charming abode offers approximately 1440 sqft of living space, situated on one of the park's largest lots, ensuring ample room to stretch out and relax. Residents enjoy access to a wealth of amenities including refreshing swimming pools, a clubhouse with library, event spaces, and craft areas, fostering a vibrant sense of community. The home itself has been thoughtfully updated, with a stylish kitchen boasting recent renovations, while the bathrooms have been tastefully modernized. Fresh carpeting adds a touch of luxury to the living rooms and bedrooms, cr
This stunning 10 -acre property offers great privacy and a prime location along the bike trail with proximity to everything. As you enter this home, you will be captivated by the open layout with high ceilings and beautiful wood beams. The attention to detail and high quality of construction is evident throughout the property. Beautiful walnut hardwood floors grace the entire home, The kitchen has been completely renovated with top-of-the-line Wolf and Subzero appliances with two dishwashers, two sinks, ice machine and wine fridge. The master suite features an expansive walk-in closet room with built-ins. One of the highlights of this property is the newly installed swimming pond. Enjoy bre
This area's enrollment policy is not based solely on geography. Please check the school district website for more information.
Elementary schools
Middle schools
High schools
GreatSchools Summary Rating
9/10
Cesar Chavez Elementary School
Public, K-6 • Choice school
8/10
Robert E. Willett Elementary School
Public, K-6
7/10
Pioneer Elementary School
Public, K-6
7/10
Patwin Elementary School
Public, K-6
6/10
North Davis Elementary School
Public, K-6
Only showing 5 of
11 elementary schools.
School data is provided by GreatSchools, a nonprofit organization. Redfin recommends buyers and renters use GreatSchools information and ratings as a first step, and conduct their own investigation to determine their desired schools or school districts, including by contacting and visiting the schools themselves.Redfin does not endorse or guarantee this information. School service boundaries are intended to be used as a reference only; they may change and are not guaranteed to be accurate. To verify school enrollment eligibility, contact the school district directly.
Buy the right home at the right price near Davis with a local Redfin real estate agent.
Homes for sale in Davis have a median listing price of $884K. Some of these homes are Hot Homes, meaning they're likely to sell quickly.
What are some of the most popular neighborhoods in Davis?
Popular neighborhoods include Downtown Davis, Mace Ranch Park, 1917 Core, East Davis, South Davis, Central Davis, West Davis, and North Davis.
How often does Redfin update their new listings?
Most of our new listings in Davis are updated every 5 minutes so you can see new homes as soon as they come on the market. Learn more
What is transportation like in Davis?
Davis, California boasts a well-developed transportation system, with a variety of options for residents. The city is known for its extensive network of bike paths, but for those who prefer to drive, traffic levels are generally moderate, making commuting by car a viable option. Davis also offers public transportation, with Unitrans providing bus services throughout the city and beyond. For longer journeys, Interstate 80 runs just south of the city, offering easy access to other parts of the state. Learn more on our Davis city guide.
What types of properties are available in Davis?
Davis, California offers a variety of single-family home types, including ranch-style homes, contemporary homes, and modern homes, all with different architectural styles and designs. These homes can be found throughout the city, with some located in established neighborhoods and others in newer developments. Most properties in Davis, California feature three to five bedrooms and were built within the past few decades. To explore different property types for sale in Davis, California, use the 'Home type' filter located above the active listings. Customize your search by selecting options like single-family homes, condos, townhomes, and more.
What is life like in Davis?
Living in Davis, California offers a serene and picturesque setting with a beautiful landscape characterized by lush greenery and open spaces. The weather in Davis is typically mild and pleasant, with warm summers and cool winters. The city boasts a thriving job market, with a variety of industries and opportunities for career growth. Residents can engage in a range of activities, including exploring numerous parks and trails, enjoying outdoor sports and recreational activities, and participating in various cultural events and community gatherings. Davis provides a vibrant and engaging environment that caters to diverse interests and fosters a strong sense of community.
What are the schools and amenities like in Davis?
Davis, California offers a wide array of public amenities for its residents. There are numerous restaurants catering to a range of culinary tastes. The city is also home to several parks, providing ample space for outdoor relaxation and recreation. Grocery stores are conveniently located throughout Davis, ensuring easy access to daily necessities. Additional amenities include a public library, a post office, and a community swimming pool, among others.
In the past month, 37 homes have been sold in Davis. In addition to houses in Davis, there were also 11 condos, 1 townhouse, and 9 multi-family units for sale in Davis last month. Davis is a moderately walkable city in Yolo County with a Walk Score of 50. Davis is home to approximately 63,985 people and 28,365 jobs. Find your dream home in Davis using the tools above. Use filters to narrow your search by price, square feet, beds, and baths to find homes that fit your criteria. Our top-rated real estate agents in Davis are local experts and are ready to answer your questions about properties, neighborhoods, schools, and the newest listings for sale in Davis. Our Davis real estate stats and trends will give you more information about home buying and selling trends in Davis. If you're looking to sell your home in the Davis area, our listing agents can help you get the best price. Redfin is redefining real estate and the home buying process in Davis with industry-leading technology, full-service agents, and lower fees that provide a better value for Redfin buyers and sellers.


 REDFIN IS COMMITTED TO AND ABIDES BY THE FAIR HOUSING ACT AND EQUAL OPPORTUNITY ACT. READ REDFIN'S FAIR HOUSING POLICY AND THE NEW YORK STATE FAIR HOUSING NOTICE.
 United States
 Canada