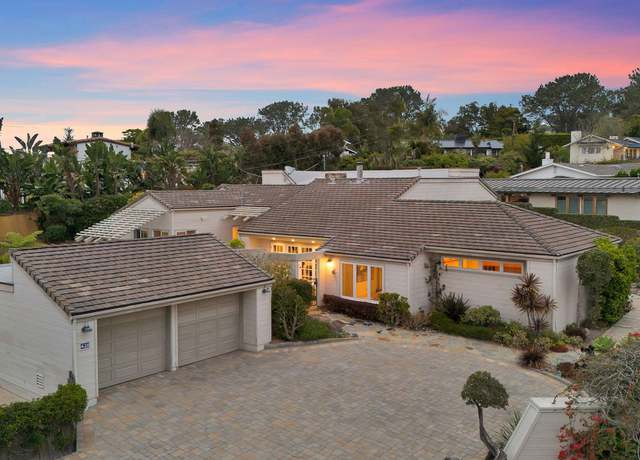
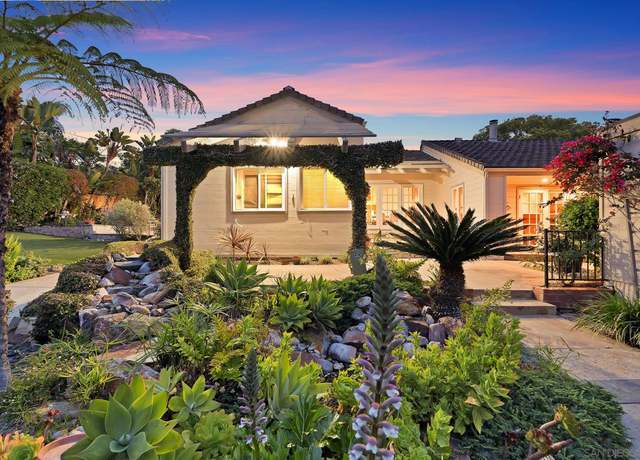
Explore an unparalleled opportunity in the heart of Olde Del Mar! Situated on a sprawling 16,000+ square-foot parcel surrounded by breathtaking landscaping, this remarkable retreat features a spacious country kitchen and versatile living areas, perfect for both gatherings and quiet moments alike. The split-level floor plan allows for great separation between each of the three bedrooms and baths, inclusive of the primary suite with its walk-in closet and remodeled bath. An optional fourth bedroom offers flexibility for whatever best suits your needs. Tranquil outdoor spaces are comprised of a generous front yard showcasing an arbor and colorful gardens, multiple lounging areas, as well as a
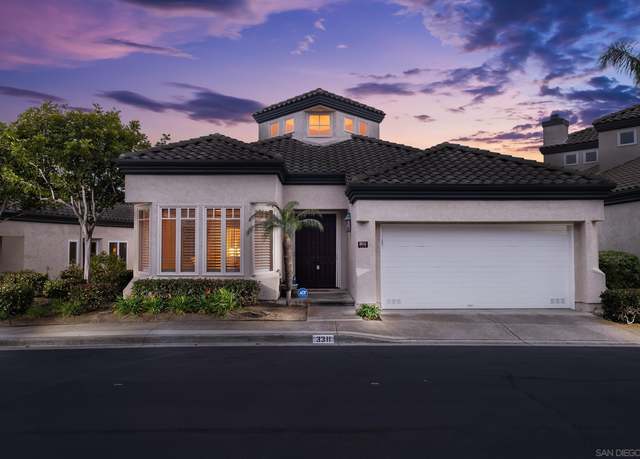
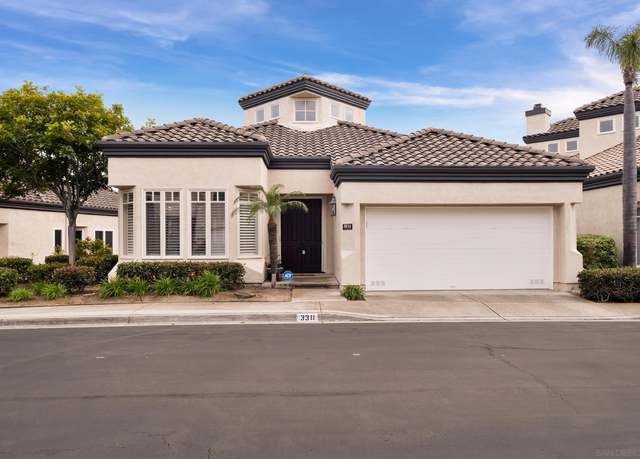
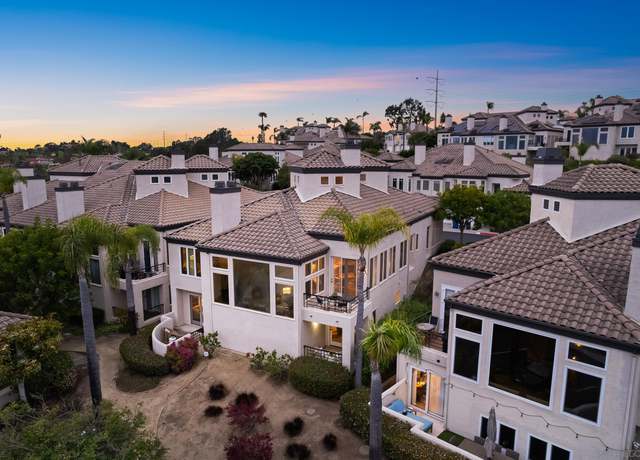
Welcome to your luxurious 3 bedroom 3.5 bathroom home in the exclusive gated community of Cabo Sante Fe in Del Mar! You will fall in love as you are greeted by soaring ceilings upon entry to your top floor main level. The main level includes a formal dining room, kitchen, and cozy family room. The family room overlooks the living room below and has a balcony that offers views of the Del Mar San Dieguito River Park! The living room is located on the drop-down floor with a charming fireplace. The spacious primary bedroom on the first floor, which features an additional seating area with a fireplace, stunning views, and a luxurious en suite bathroom. Pamper yourself in the en suite, complete w
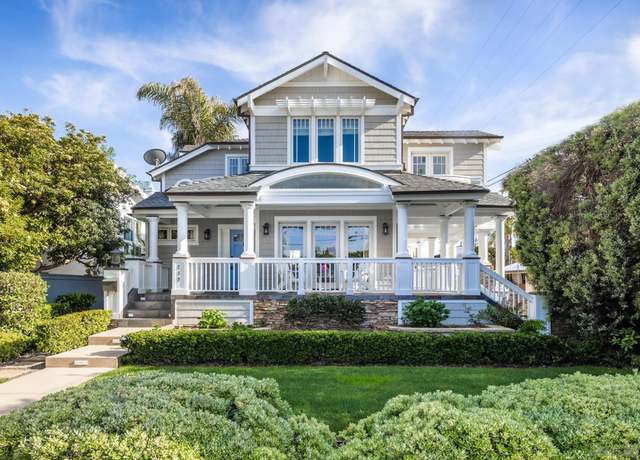
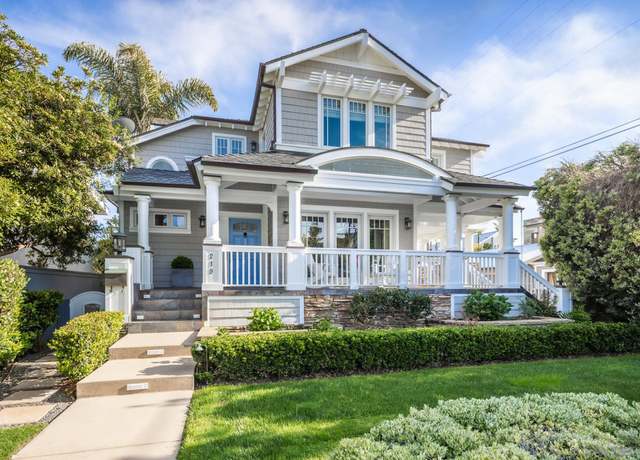
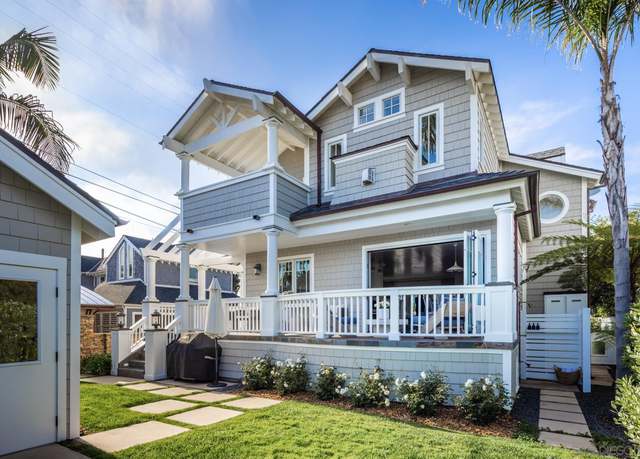
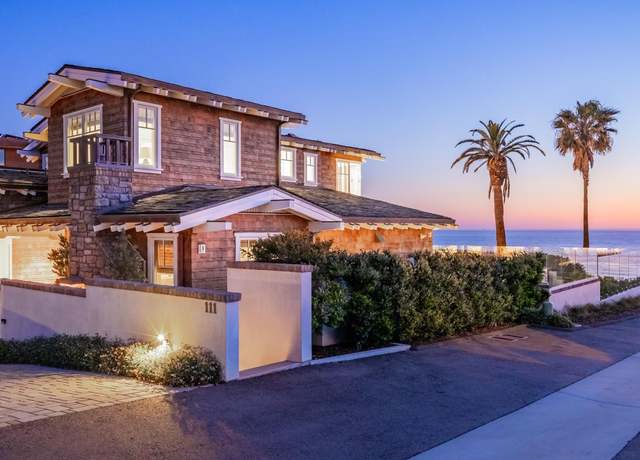
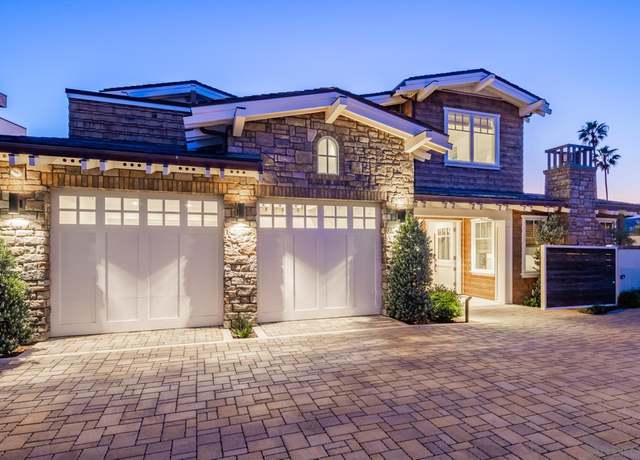
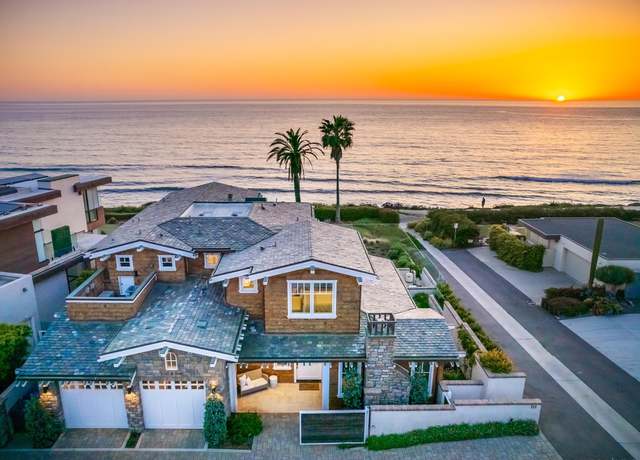
Welcome to 219 27th Street, a sophisticated California Coastal Craftsman located in the highly sought-after Del Mar Beach Colony. This storybook home was designed to complement its idyllic location within walking distance to the Del Mar Village and steps to the beach. Exquisitely crafted and curated by an award-winning team, Wardell Custom Home Builder and Designer Amy Meier seamlessly blend quality materials and luxury finishes to create modern coastal elegance. Don't miss the opportunity to experience the epitome of coastal elegance. This meticulously maintained home represents a rare blend of exceptional design and an enviable beachside location, offering a lifestyle of leisure and luxur
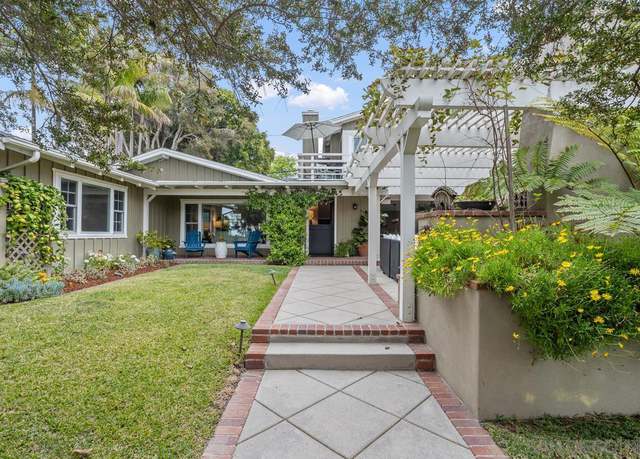
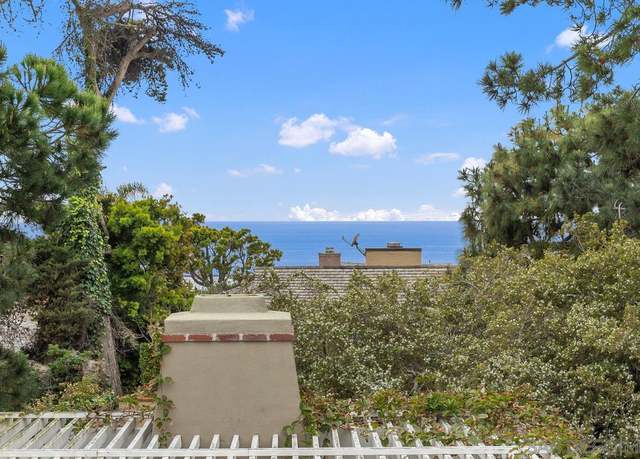
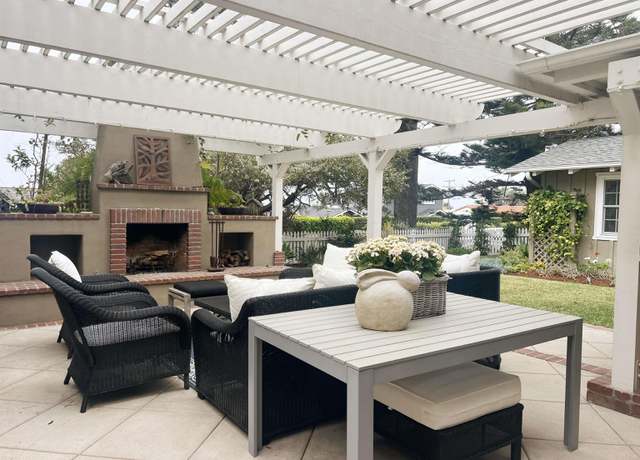
Charming, classic, white picket fenced, fairy book cottage, with ocean views , on the west side, in the heart of Olde Del Mar. Vaulted ceilings, hardwood floors throughout, updated kitchen and baths, open floor plan with beautiful grounds, protected outdoor living area, with BBQ and fireplace, and plenty of off street parking at rear of property. Completely fenced and private, in the heart of everything. Move in and enjoy the best of life in the Village of Olde Del Mar, with room to grow!
The Hamptons meets ocean front living in Olde Del Mar with this custom three-level property with elevator, pool/jacuzzi, movie theater, 3-car garage & massive ocean views down the coastline! Newly built in 2019, this 6,283 square foot 4-bedroom, 6-bathroom home is a true entertainer’s dream. Located at the end of a long drive & privately gated, this prestigious “smart home” property features an ideal open floor plan perfect for indoor / outdoor living. The backyard offers covered dining space, outdoor fireplace, ceiling heaters, evo grill + full outdoor kitchen. The primary suite retreat is on the top floor & offers a private deck & gorgeous bathroo
Original Del Mar charm is exuded from this single story coastal cottage. Nestled at the top of 8th st. , this home sits back on a serene and sizable lot and yet is still centrally located allowing walkability to both the beach and all that Del Mar has to offer. This 3 bedroom, 2 bath is flooded with natural light through a prominent atrium as well as skylights and a wall of windows. The kitchen and bathrooms have been updated as well as the flooring. The open and functional floor plan orients toward an idyllic backyard highlighted by brick and lemon trees as well as a large level astroturf yard area. As you walk passed the attached 2 car garage and into the designated foyer or mudroom, you
Sitting on 2 legal lots, 4,433 SQ FT living space, Modern Contemporary Styling, 5BR/6BA, located in the Beach Colony west of Camino Del Mar just about 200 feet to the oceanfront with direct beach access. Includes a 1BR/1BA guest suite or granny flat with its own separate 1 car garage. The open floor plan with Chef's kitchen is well designed for those get togethers with family and friends. The primary suite is separate and oh so romantic with white water surf views, bath with spa-type vibe, his and hers walk in closets, and a special Juliet balcony perfect for sun bathing and enjoying the ocean breezes. Delight in the swimmig pool & spa. The two (2) car garage is attached to the main
Steps from Del Mar's Downtown Village, Del Mar Plaza, and minutes to the beach, this is an incredibly rare opportunity to own not one, but TWO CUSTOM BUILT CONTEMPORARY HOMES in the heart of one of San Diego's most sought after coastal communities. Masterfully designed by renowned EOS Architects, these two homes situated on a . 25 acre lot offer unprecedented flexibility for you to choose how to live. The property is perfectly suited for a variety of living arrangements: Primary Residence with a Guest Home, Primary Residence with an Office/Work Space, Multi-Generational Family Compound, Vacation Home(s), or Income Producing Investment Properties. As you enter the 2,267 sqft main home throug
Tucked away behind a private gate in an exclusive enclave, this organic contemporary home offers a luxurious retreat. Upon entering, you're greeted by a resort-style pool and spa, complete with a sitting area around the outdoor fireplace. Inside, bi-fold doors reveal stunning views of the polo fields and coastline, while an expansive deck with an outdoor kitchen equipped with a pizza oven is perfect for entertaining. The gourmet kitchen features top-of-the-line appliances. The main floor features a primary suite with a spa-like bathroom, sauna, and garden area, adding a touch of tranquility. Additionally, there is a private tennis court shared by three homes on Arroyo Rosita. Conveniently l
Motivated Seller Has Found Next Property! Del Mar Gated Community Dream At Casa Del Mar! Best Location in the Complex. Ground Level No Stairs Easy Access! Steps to the Pool and Spa. Great for Owner/User, Retired/Senior, or Investment Rental. Minutes to Del Mar Village and Beaches, Coast Hwy and I-5. Gorgeous New Flooring. Two Patios. Oversized Patio off Kitchen / Al Fresco Dinning / Entertaining Area. Additional Patio off Bedroom. Private Laundry in the Unit. Freshly Painted. Convenient Garage location with easy access. One block from Shopping, Fuel, Restaurants, Supermarket and Drug Store. Live your Dream At The Pacific Coast Riviera!
Secluded paradise awaits at this exquisite single-story estate on a sprawling 1-acre lot at the end of a private lane. Timeless elegance with modern appeal, the 5 bedroom main house with 10 foot ceilings, French oak flooring, custom millwork, magnificent lighting and designer details, plus 1 bedroom guest house, offers a polished comfort conveying a sense of luxury without sacrificing coziness. The seamless integration of indoor and outdoor living with over 800 square feet of al fresco space, sparkling swimming pool and more, is a quiet haven for year-round indulgence.
This remarkable property offers a seamless blend of luxurious interiors, awe-inspiring ocean and lagoon views, and a prime location near a host of desirable amenities. Upon entering, you'll be greeted by the grandeur of vaulted ceilings with exposed beams and rich redwood paneling that exudes warmth and sophistication. The center cut redwood flooring adds a touch of natural elegance, complemented by the inviting solar rock fireplace and brass chimney and railings that create a cozy ambiance. The custom kitchen is a chef's dream, boasting custom cabinets and massive windows that frame the spectacular ocean and lagoon views. The main residence features a spacious primary suite, offering a tra
Welcome to Del Mar’s best kept secret! Nestled in a prime cul-de-sac location in Rancho Del Mar Estates, this architectural masterpiece integrates refined elegance with exceptional functionality. Impeccably groomed grounds and softly lit driveway create an inviting entrance bordered by stunning natural beauty. Step into the grandeur of this magnificent home, greeted by a majestic staircase adorned with plush new carpeting and high ceilings. Enjoy exquisite hardwood flooring throughout. The dining and living areas exude elegance with abundant windows and French doors, bathing the space in natural light. The gourmet kitchen boasts top-of-the-line stainless steel appliances, dark wood ca
First time on the market, a one of a kind mid-century modern designed by San Diego Master Architect and Frank Lloyd Wright apprentice Frederick Liebhardt, resting on 3.18 sprawling acres of rolling grass hills and 100 year old trees in the peaceful Montecillo neighborhood. Lovingly enjoyed and maintained by the current owners for the past 58 years, this home is a masterclass in modernist design and has all of its original features; dramatic walls of glass, geometric and angled rooflines, large wood burning fireplaces, high ceilings, clerestory windows and sliding glass doors all designed to bring the outside in. A primarily single level 6 bedroom main residence with a detached pool/tennis h
VIEWS & LOCATION!!! Perched on a hilltop in the exquisite Del Mar gated community of Fairbanks Polo Club, this MAJESTIC estate brilliantly blends PRIVACY with Unparalleled Stunning PANORAMIC VIEWS!! Absorbing the scenery of the Fairbanks Golf Course, the Ultimate Coastal Contemporary Lifestyle awaits you and your loved ones. Meticulously remodeled with a modern palette, and providing a seamless connection between indoor and outdoor living, This architectural showpiece brings poetry and pragmatism to new heights! With floor to ceiling captivating architecture and abundant natural light the Interior Delights include; Fantastic views, Primary bedroom suite downstairs, 3 additional on-su
Here is your chance to create the perfect oasis in Del Mar. This 3 bed/2.5 bath home is on the market for the first time in 35 years. The main living space is 2470 sq. ft. on one level with exceptional views to the east. Downstairs there is a non permitted 1200 sq. ft. apartment with a separate entrance. There is a possibility of connecting upstairs and downstairs with an interior staircase.
This remarkable residence, nestled above the picturesque San Dieguito Lagoon, offers unparalleled views and embodies the essence of Southern California living. Located in the coveted seaside community of Del Mar, this home boasts a spacious layout with two primary suites thoughtfully positioned for privacy. With sliding glass doors seamlessly connecting the indoors to the wraparound deck, the home invites the coastal breeze and natural light to envelop its interior, accentuated by vaulted ceilings and skylights. The gourmet kitchen, equipped with high-end Wolf, Sub-Zero, and Café appliances, caters to culinary aficionados. Outdoor entertainment is elevated with a covered area beneath
Experience coastal living at its finest with breathtaking panoramic ocean vistas and views of Torrey Pines Reserve from every main room at 12858 Caminito En Flor. This prime residence in the prestigious Del Mar Sea Village community offers a sun-soaked southwest exposure, inviting you to indulge in indoor/outdoor entertaining on the spacious patio or lower deck. Step inside to discover a meticulously designed and updated home featuring a versatile large loft, ideal for multiple work-from-home office spaces or accommodating guests in style. The attached spacious 2-car garage provides ample room for beach essentials, with an additional storage space above. Beyond the confines of your abode, t
Just 5 minutes to the beach! This turnkey top floor corner unit offers a perfect blend of comfort and style. Step inside this down to the studs completely remodeled 1-bedroom, 1-bathroom home boasting 800 square feet of living space. Every detail has been thoughtfully considered, with newer electrical, plumbing, flooring, kitchen, bathroom - everything is nearly brand new! As you enter, you'll be greeted by a spacious living area featuring a custom designed wood burning fireplace. Step outside to your private balcony and savor the tranquil surroundings of the lush, mature landscapes in this well-maintained HOA. The living area seamlessly flows into the modern kitchen, creating an inviting a
Custom built in 2016 and two years in planning approval, this Turn-Key Beach Front home offers room for the whole family! There are No Boundaries between the indoors and outdoors, as walls of glass disappear to blend the two as one. A Top Architectural designer brought the project and use of space to a level not often seen with other ocean front properties. The two-story high windows and openness of each room are impressive. The space lives like it is much Larger than it actually is, which is a testament to the incredible design. A stunning home in a gorgeous location! The quality is to the extreme & very best available: Water Works tile in bathrooms, Holly Hunt light fixtures, gourme
Real estate is all about location. The location of 1905 Santa Fe Ave. is ideal. In the coveted Beach Colony area of Del Mar it is a short walk to the beach, to restaurants, the Powerhouse Community Center and the "village of Del Mar. " On the lot of 1905 Santa Fe Ave. sits a perfectly designed, contemporary home. It is light and bright with all rooms opening to patios. Day to day living is easy and relaxing. The primary bedroom and bath are on the main level. The primary bedroom opens to a lovely patio with a house for a sauna is location. Another bedroom is not permitted. Seller has told me that it is built to code.
An uncompromising Coastal Craftsman with 180-degree ocean views lives up to its Seaview address. The 5,459SF 4+BR/5.5BA house reflects tradition—wood shingles, vaulted ceilings, Dutch door—while creating a contemporary vocabulary of coastal living. A fusion of timeless elegance & unmatched quality, it was designed by Bokal Sneed Architects. Ocean views unfurl dramatically throughout the house and the floor plan maximizes outdoor living. It’s a quick jaunt to the village & iconic beaches.
Rarely available single level, fully updated gem with ocean views galore in Olde Del Mar. Situated on a quiet street, this bungalow is tucked away behind a Balinese entry complete with swaying palms. This unique property comes with all of the outdoor amenities including a putting green, built-in bbq with ocean view, fire pit, gazebo complete with pool table and sunset seating, hot tub, 2 car garage on a private street with room to add an ADU. The tropical yard lends itself to outdoor living/dining under a retractable pergola roof and all things Zen. There’s even a structure for your surfboards, boogie boards, e-bikes and more. Walk to everything Del Mar when you’re not enjoying
Ensconced in private gated community on the sand in Del Mar, this oceanfront compound is completely turn-key & comes fully furnished! At almost 4,000 square feet, this spacious home features 5 en-suite bedrooms upstairs including the primary suite retreat with private oceanfront deck & his / her separate closets & bathrooms. Downstairs enjoy a beautiful courtyard, office, family room, kitchen, dining areas, laundry room & 3 car garage + driveway parking for 3 extra vehicles. Relax & catch the sunset or entertain & dine alfresco in the backyard oceanfront deck spanning 50 feet on the best beach in San Diego. Spectacular in every season, this property offer
Enjoy an unobstructed stunning sunrise over the mountains from this beautifully upgraded home in the Del Mar Hills community. Situated west of Hwy 5, the home has a refined foyer illuminated by a skylight with engineered hardwood floors throughout and a luxurious family room with a folding glass doors for perfect inside outside living. There is also a downstairs bedroom and one fully upgraded bathroom. The master bedroom boasts a walk-in closet and a balcony offering gorgeous views. The additional bedroom upstairs offers ample space, as it is the combination of two previous bedrooms. Outside, the well-maintained desert landscaping surrounds a sparkling swimming pool, water feature, and fire
First time on the market since it was built over 70 years ago! Olde Del Mar Charmer! This delightful bungalow sits like the king of the hill on an over-sized (over 12,000 square foot) lot in Olde Del Mar! Nestled in the cool pine trees, there are sweeping views all around! If privacy is what you are looking for, then, look no further; it just doesn't get any cuter! Like to snuggle by a cozy fireplace? Bingo! Cold winter extravaganza! Hardwood floors throughout (OK, little patches of carpet around)! This quaint cottage was built around the mid-1950's, and still retains many of those designer features! A one of a kind gem in the making! You have found your little pocket of gold at the end of
Welcome to 14008 Mira Montana Drive, a stunning residence exuding elegance and charm in the prestigious Del Mar, CA. Completely renovated with luxury finishes and materials, this captivating 4-bedroom, 3-bathroom home offers an impressive 2520 square feet of living space in one of the most desirable neighborhoods in San Diego. Step inside to discover a seamless blend of indoor/outdoor living, complemented by breathtaking mountain views. The spacious living areas are adorned with custom details and exquisite lighting, creating a warm and inviting ambiance. A well-appointed kitchen is a chef's dream, boasting modern appliances and ample storage. The wine room and bar add a touch of sophistica
Welcome to your wellness retreat in the desirable gated community of Rancho Del Mar Estates, with only 28 custom designed residences and just minutes to the beach with close freeway access. This five-bedroom VIEW home, recently remodeled in 2018 to perfection, offers an ideal floorplan with immaculate interiors that seamlessly flow outdoors to your backyard oasis. A spacious and elegant interior, featuring high-end finishes throughout. Soaring ceilings, expansive windows with abundant natural light. Enjoy your very own living room fireplace, perfect for those cool coastal evenings, and enjoy the expansive patio, making it an ideal space for both relaxation and entertainment. Featuring a gou
Calling all horse racing and white water enthusiasts! Tastefully remodeled 4-bedroom coastal modern home offering the perfect fusion of security, convenience and seclusion. Boasting breathtaking views of the Del Mar RaceTrack and white water, this residence is an entertainer's paradise, complete with a temperature-controlled 600-bottle wine wall and a stunning gourmet kitchen featuring exquisite waterfall labradorite countertops. Nestled securely behind gates, this property offers the perfect blend of upscale living with close proximity to restaurants, shopping, and the race track. Whether you have a passion for horse racing or walks on the treasured Del Mar beach, this home is a perfect fu
Indulge in luxury living with this captivating real estate gem. From its picturesque pool oasis to its inviting interiors, every corner beckons you to create unforgettable memories. Welcome home to your own slice of paradise! Every room has direct access to outdoor space; large private front courtyard; tropical backyard with pool and palapa; There is space for possible ADU
Live your dream on the sand in the exclusive Del Mar Beach Colony. No expense was spared in 2016 when it was completely rebuilt with the highest quality level. The contemporary beach-chic styling offers modern amenities and exceptional one-of-a-kind details. Vanishing glass doors open onto the imported wood deck leading to the sandy beach and breathtaking views. Relaxing bedroom retreat with fireplace, private sun drenched patio, spa like bath with steam shower, and heated flooring. Upgrades include smart home automation and security, all new Miele appliances, two wine refrigerators and tankless hot water heater. 1 car attached garage plus 2 additional parking spaces for family and friends.
Nestled in one of Del Mar's most serene oceanfront settings, 516 Stratford Ct sets the pinnacle for luxurious California coastal living. Crafted in collaboration with renowned designer Samuel Amoia and constructed by Zephyr Development, this contemporary masterpiece spans 6,532 square feet with 4 bedrooms, seamlessly blending stunning aesthetics with cutting-edge technology. Immerse yourself in effortless living with fully integrated smart home features, complemented by expansive vanishing pocket doors that open onto over 800 square feet of covered outdoor space, fostering a harmonious indoor/outdoor lifestyle. Revel in the awe-inspiring ocean views from the outdoor living area and infinity
This one-of-a-kind iconic Del Mar Estate is unlike any other property offered in any high-end Southern California coastal community. This inimitable property has over 175 feet of ocean-view frontage situated on a private bluff of approximately 1/2 acre of usable land capturing unobstructed Pacific Ocean, white water and sand views of the Pacific coastline. This secluded home is generously sized with nearly 5,300 square feet situated to the west of Camino Del Mar. This Estate is simultaneously an entertainment haven and a spa-like sanctuary with sounds of waves enhancing its ambience. The state-of-the-art kitchen seats up to 18 guests with the estate seamlessly opening to multiple indoor-out
Welcome Home to this Turnkey Contemporary Masterpiece West of the 5 and just blocks from Torrey Pines beach & Del Mar's iconic 15th Street beach! Every inch of this home has been completely renovated with the highest level of quality and detail, from the full sound-proofing throughout with noise-cancelling insulation, windows and doors, to the unsurpassed level of sophistication & elegance including French Oak wood floors, Thermador appliances, soaring ceilings, open floor plan, paid solar, premium salt water spa, automated blinds, whole home water softener/conditioner/filtration system, sound insulated Low-E windows & doors, smart home system, peek ocean views, and so muc
Welcome to your dream home in the highly sought-after Del Mar Heights neighborhood of Del Mar. Nestled on a generous and secluded lot, this meticulously renovated residence epitomizes coastal luxury living at its finest. The updated kitchen is lightly lived in amidst sleek granite countertops, top-of-the-line appliances, and ample storage space with pull out drawers throughout. With its open layout and chic design, this kitchen is sure to be the hub of countless memorable gatherings. The home boasts hardwood & tile floors throughout, enhancing the inviting atmosphere and offering both durability and easy maintenance. Natural light streams in through newer windows, illuminating every c
Enjoy unobstructed panoramic whitewater views from the living room, kitchen, bedrooms and multiple ocean view decks. This Herb Turner architectural design was built in 1964 on a . 26 acre lot at the very end of the highly sought after Ocean View Avenue.
This stunning modern home in the secluded hills of Olde Del Mar is an entertainer's paradise, featuring an open layout, high ceilings, and abundant natural light. The minimalist white walls invite personal artistic flair. Architect Batter Kay designed this four-bed, three-bath masterpiece with breathtaking ocean views. Enter through the glass door to discover an awe-inspiring interior leading to the primary suite with a private ocean-view deck and a spa-like bathtub overlooking the sea. Two additional guest suites, one with a walk-in closet, and a full bath are also on this level. The lower level houses a fourth bedroom, currently a home gym with an ocean-view deck and plunge pool, ideal fo
Welcome to your DREAM HOME on a 8,572 SF lot in the heart of Del Mar with partial ocean views and only 1,100 feet from the world famous Del Mar beach shoreline! The location of this home is unmatched with walkability to the Del Mar Plaza, Del Mar beach, and the Del Mar Racetrack. As you step through the front doors, you're greeted by a grand foyer that sets the tone for the elegance within. Ascend the split-level staircase to discover the main entertaining level, a true haven for hosting guests or simply enjoying daily life. Here, the gourmet kitchen, living room, family room, and dining room blend seamlessly, surrounded by oversized windows that showcase mesmerizing ocean views and flood t
Welcome to your coastal dream home in Del Mar's sought-after Spindrift neighborhood! This meticulously upgraded townhome, less than a mile from the sun-kissed Del Mar beach, invites you to experience the perfect blend of comfort and luxury. Entertain on your charming patio adorned with enchanting string lights, capturing July 4th fireworks and a mesmerizing ocean view from the living room window. Step inside to discover an airy open-concept floor plan featuring laminate wood-like flooring, plantation shutters, and designer fixtures. With approximately $80,000 in upgrades, including a lifetime-warranted full house re-pipe, new Goodman AC, and a thoughtfully revamped kitchen with stainless st
Simply charming single level home on . 31 acres, fully usable, with panoramic ocean views. Large backyard with deck and majestic torrey pine trees. The ocean views are enjoyed from multiple locations on the site and home. Ideal site for a new spectacular Del Mar estate on the highly sought after Ocean View Avenue. Trust Sale.
School data is provided by GreatSchools, a nonprofit organization. Redfin recommends buyers and renters use GreatSchools information and ratings as a first step, and conduct their own investigation to determine their desired schools or school districts, including by contacting and visiting the schools themselves.Redfin does not endorse or guarantee this information. School service boundaries are intended to be used as a reference only; they may change and are not guaranteed to be accurate. To verify school enrollment eligibility, contact the school district directly.
Del Mar, California, offers a variety of transportation options, including a well-established public transportation system. The city is served by the North County Transit District, which provides bus and train services, making commuting convenient for residents. Traffic levels for driving can be high during peak hours, especially in the downtown area, so plan your car journeys accordingly. Additionally, Del Mar is conveniently located near Interstate 5, providing easy access to nearby cities and attractions. Learn more on our Del Mar city guide.
What types of properties are available in Del Mar?
Del Mar, California offers a variety of single-family home types, including ranch-style, contemporary, and modern architectural designs. These homes can be found throughout Del Mar, with some located near the beach and others nestled in the scenic hillsides. Most properties feature multiple bedrooms and were built in various years, catering to different preferences and needs. To explore different property types for sale in Del Mar, California, use the 'Home type' filter located above the active listings. Customize your search by selecting options like single-family homes, condos, townhomes, and more.
What is life like in Del Mar?
Del Mar, California offers a unique living experience with its picturesque landscape that includes stunning ocean views and rolling hills. The weather is characterized by mild winters and warm summers, providing residents with a comfortable year-round climate. The region boasts a thriving job market, with a variety of professional opportunities available across industries such as technology, finance, and healthcare. Del Mar offers a vibrant social scene, with numerous recreational activities to enjoy, including hiking, surfing, and exploring the local dining and shopping options. Additionally, residents can participate in community events and engage in local initiatives to enhance their sense of belonging.
What are the schools and amenities like in Del Mar?
Del Mar, California, offers a variety of public amenities to cater to the needs and interests of its residents. There are numerous restaurants in the area, offering a wide range of cuisines to satisfy diverse culinary preferences. For those who enjoy outdoor activities, there are several parks available for leisure and recreation. Grocery stores are also conveniently located within the region, ensuring easy access to daily necessities. Additionally, there are other amenities such as fitness centers, libraries, and community centers that contribute to the overall quality of life in Del Mar, California.
In the past month, 7 homes have been sold in Del Mar. In addition to houses in Del Mar, there were also 4 condos, 1 townhouse, and 1 multi-family unit for sale in Del Mar last month. Find your dream home in Del Mar using the tools above. Use filters to narrow your search by price, square feet, beds, and baths to find homes that fit your criteria. Our top-rated real estate agents in Del Mar are local experts and are ready to answer your questions about properties, neighborhoods, schools, and the newest listings for sale in Del Mar. Our Del Mar real estate stats and trends will give you more information about home buying and selling trends in Del Mar. If you're looking to sell your home in the Del Mar area, our listing agents can help you get the best price. Redfin is redefining real estate and the home buying process in Del Mar with industry-leading technology, full-service agents, and lower fees that provide a better value for Redfin buyers and sellers.
 REDFIN IS COMMITTED TO AND ABIDES BY THE FAIR HOUSING ACT AND EQUAL OPPORTUNITY ACT. READ REDFIN'S FAIR HOUSING POLICY AND THE NEW YORK STATE FAIR HOUSING NOTICE.
 United States
 Canada