Nestled in a prime location, this charming 3-bedroom, 2-bathroom home awaits its new owner. Situated on a generous 10,150 sqft lot, the backyard presents endless possibilities with space for an ADU, pool, and convenient RV/boat/car side access. Step inside to discover two inviting common areas, w/ tile flooring seamlessly flowing into an updated kitchen adorned with cherry wood cabinets, granite countertops, and stainless steel appliances. Downstairs, enjoy the privacy of the primary bedroom, while upstairs features 2 cozy standard bedrooms with wood flooring throughout. With its warm ambiance and versatile layout, this must-see home offers countless opportunities for any buyer seeking comf
This delightful home boasts three bedrooms and two full bathrooms, recently enhanced with new flooring and a fresh coat of paint throughout. The bright kitchen with lots of storage showcases updated appliances and recessed lighting for a modern touch. Open kitchen, dining and living area. Outside, raised garden beds in both the backyard and side yard await, perfect for cultivating fruits, vegetables, and other greenery. Situated on a corner lot, this home offers convenient RV access in gated yard. Solar is leased and will transfer to new buyer. These long time owners have raised their family here for over 40 years and are ready to find it's next owners.
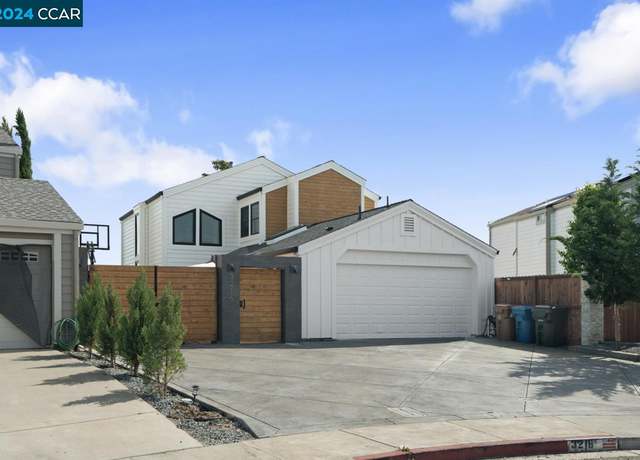
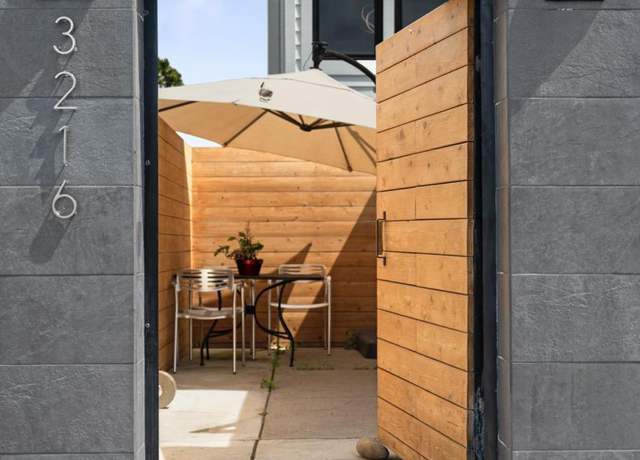
Welcome to 3216 Islewood Ct. in Antioch! This completely custom-designed, remodeled two-story home offers an exceptional living experience. Boasting 3 bedrooms and 2.5 bathrooms, it features a converted garage ADU with a full kitchen and separate entrance, ideal for generating rental income or accommodating multigenerational families. Nestled in the Hillcrest Park neighborhood, this home showcases a stunning modern kitchen with top-of-the-line appliances, an island with a breakfast bar, and access to a deck offering breathtaking views all the way to the Delta. With over 2100sqft of luxury living space in the main house, adorned with luxury vinyl flooring. The remodeled modern bathrooms, inc
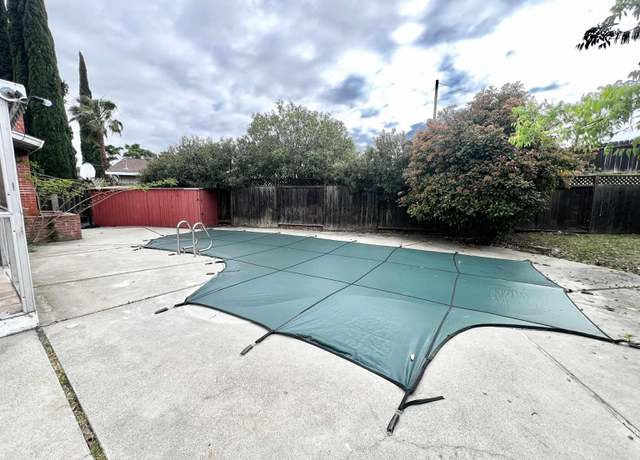
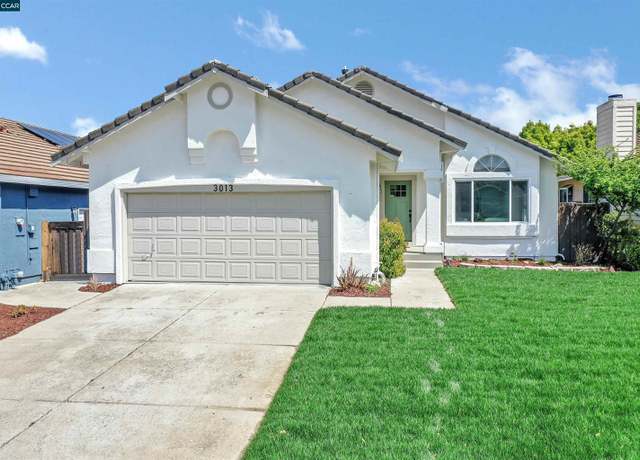
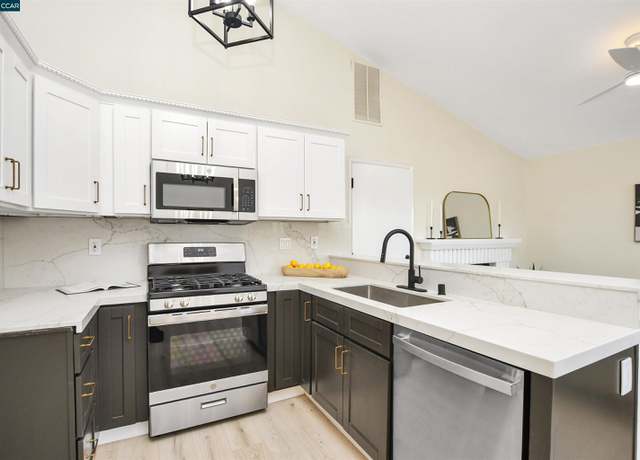
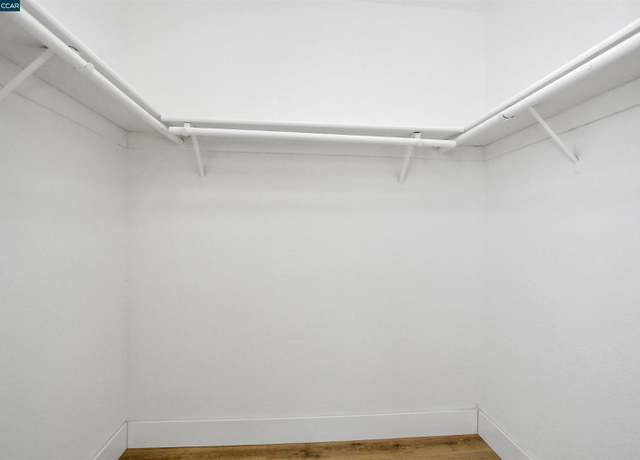
You cannot beat this court location! This single story home is in close proximity to shops, restaurants and public transportation. This home has the capability of having an ADA compliant ADU. Three bedroom, three bath house that you can make into your dream home. One bathroom has been taken down to the studs, making it easy for you to come in and finish it to all of your preferences! While the home is equipped with a swimming pool, it is in need of repairs in order to be operational. Bring your dreams and your sweat equity to make this home a unique one of a kind home in the neighborhood.
This beautifully renovated three bedroom, two bath home features a freshly painted interior/exterior, and a newly landscaped yard complete with sprinklers. Inside, you’ll find new flooring, modern lighting fixtures, and upgraded plumbing fixtures throughout. The kitchen boasts updated cabinets, elegant countertops, and state-of-the-art appliances. The low-maintenance front and back yard make this property even more appealing. Plus, it’s conveniently located close to schools, shopping, and transportation. This home is pristine and move-in ready!
Welcome to this newly remodeled two-story home in a desirable family friendly neighborhood in Hillcrest Park. A beautiful and spacious 4-bedroom, 3-bath home situated on a massive over 10,000 sq ft lot. First floor offers high vaulted ceiling in living room, wood burning fireplace in family room, and formal dining room overlooking the backyard with plenty of natural light. Upstairs features three spacious bedrooms and a large master suite. Updated master bathroom offers his and hers sinks, and a large walk-in closet. New paint throughout the interior and exterior of the house. New HVAC System. Oversized backyard with deck which is prefect for outdoor entertain and relax. Community amenities
Ground floor home in a Gated Community. Relax by the pool or in your private patio. This single floor home sports upgraded kitchen and bathroom, new stainless steel appliances, new flooring, patio, private Laundry closet, and new central heating and air system! A MUST SEE! Conveniently located adjacent to Hwy 4, shopping, restaurants, and close to BART. Enjoy plenty of closet space and convenience of a deeded carport. HOA enforces rental restrictions.
Welcome to your dream home! This charming residence boasts an array of delightful features. Step into the heart of the home and discover a remodeled kitchen, where culinary adventures await amidst modern appliances and sleek countertops. Fresh interior and exterior paint breathe new life into every corner. With a spacious rear yard offering ample room for relaxation and recreation, envision endless gatherings under the stars or the potential for an ADU (Accessory Dwelling Unit) to accommodate your unique lifestyle needs. Convenience meets comfort with a full bedroom and bathroom downstairs, ensuring flexibility and accessibility for all. Retreat to updated bathrooms, where luxurious ameniti
Charming and well-maintained home offered by Original Owner. Features include new laminate floors installed less than a year ago, remodeled primary bathroom, spacious family/living room combo with fireplace and an Andersen sliding door to rear yard, plus a covered patio on a large corner lot. Eat-in kitchen includes refrigerator. Check out this one-owner home, centrally located near shopping, public transportation and much more.
Welcome to this beautiful 3-bedroom, 2-bathroom home with a pool, nestled in the picturesque Lake Alhambra neighborhood! This charming home opens into a Formal Living / Dining area when you walk in. The beautifully appointed Kitchen showcases granite countertops, recessed and pendant lighting, upgraded cabinets, a convenient breakfast bar, and stainless-steel appliances. The open-concept design seamlessly connects the Kitchen to the large Family Room, creating an ideal space for gatherings and relaxation. Enjoy plenty of natural light through the dual pane windows. The hall Bathroom has been updated with a new tile surround and sleek shower doors. The Primary Suite features a generously siz
This delightful single-story home boasts 3 bedrooms, 2 baths, and 1,058 square feet of comfortable living space. Step inside to discover a well-appointed interior featuring ample natural light or venture outside to your own private oasis, where a tranquil walking trail awaits just beyond the backyard. Convenience is key with this home's prime location, offering easy access to Bart, major freeways, and a variety of dining options just moments away. Say goodbye to long commutes and hello to effortless living! Don't miss your chance to make this wonderful property your own. Schedule a showing today and experience the best of comfortable, convenient living.
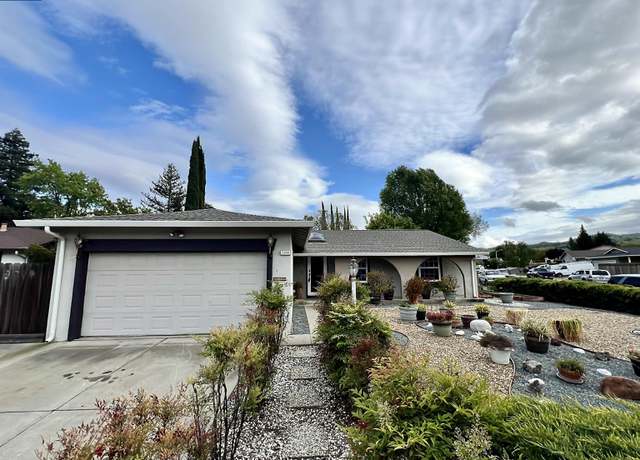
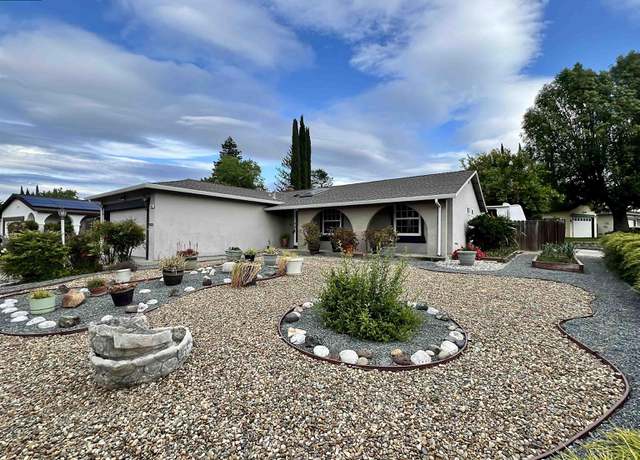
Fabulous Single Story offering 3 bedrooms, 2 baths over 1400 sq Feet with side yard to park your trailer or boat with no rear neighbors. Laminate flooring throughout. Newer interior and exterior paint. Updated bathrooms. Low maintenance landscaping. Close to schools, freeways and shopping.
If you are looking for an open-concept floorplan, you have found it here! This very well maintained 2 bedroom, 2 bath manufactured home is situated on a corner lot in the prestigious Delta Villa Estates, a 55+ community! Entering the front door you will find a very large living room with an area for dining & there's also built-in shelving! The kitchen has tons of cabinets for storage, with tile countertops & all of the appliances are included! There's a nice size guest bedroom and the guest bathroom has a shower over the tub & right outside of the bathroom is a linen closet! The primary bedroom is very spacious & the bathroom has double sinks, a large walk-in sh
Welcome to your dream home 5500 Mountain Ridge! This magnificent contemporary 3311 sq ft residence is located on a desirable community Park Ridge. The main level features a spacious living room with high windows and stunning vaulted ceilings which allow for lots of natural lighting. Open concept family room/kitchen combination features a fireplace and ample seating. This level also has an in-law bedroom and a full bathroom. The upper level offers a cozy loft, one master bedroom, and 2 regular bedrooms. Close to Shopping and just minutes away from Freeway access and E-Bart!
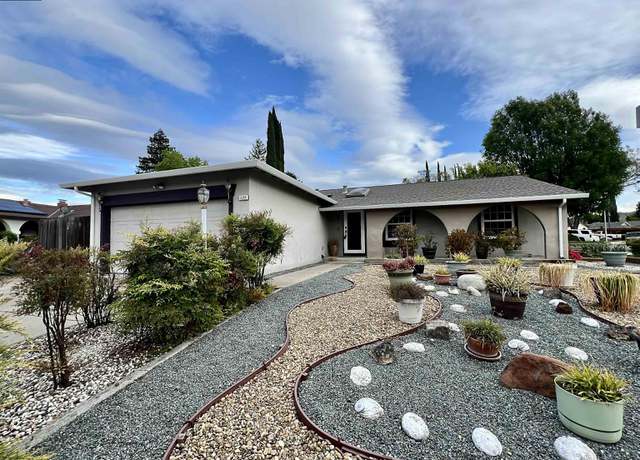
Highly updated single story home located on a quiet Cul-de-sac in prime location of Antioch. This delightful home sits a quarter acre lot with stunning hill view. The large front yard driveway allows to park 6 cars simultaneously. Favorable Northeast facing brings home abundant natural lighting, plus new LED recess lights throughout. The gourmet kitchen boasts upgraded cherry cabinetry, SS appliance, sleek granite countertop & backsplash. The dining area provides a perfect setting for family gatherings with hill view. The bright and spacious family room leads out to a balcony with panoramic view and backyard oasis, where you'll find a private retreat perfect for enjoying warm Californ
This two-story multi-family home in Antioch boasts four bedrooms and three full bathrooms, with the possibility of a fifth bedroom downstairs adjacent to a full bathroom. Nestled on a court, the property offers a tranquil setting and a sense of community. Its spacious layout and potential for customization make it perfect for accommodating various living arrangements. Ideal for families seeking comfort and convenience, this home presents an inviting opportunity for relaxed living in Antioch.
Price reduced to $69,000! * Will consider all offers * SENIOR 55+ GATED Mobile Home Park * Seller to credit buyer 2 months free rent at closing * Must be Park approved and income must be 2 - 3 X the amount of the rent * Well maintained Senior Park * Very clean 1080 sq ft, 2 large bedrooms 2 bathrooms. * Oversized Living room * Dining room, Kitchen has gas stove, dishwasher, refrigerator, laundry room with washer & dryer that stays * Lovely remodeled clubhouse with pool tables, tennis table, swimming pool, spa. * Clubhouse may be reserved for your personal parties. MOVE IN CONDITION! CAN BE FAST CLOSE AND OCCUPANCY. SHOWN BY APPOINTMENT ONLY!
Welcome to 2909 Enea Way! This charming single-story residence offers 3 bedrooms, 2. baths, and 1,496 sqft of living space on a 6,270 sqft lot. Upon entry, you'll be captivated by the wood flooring that perfectly complements the home's aesthetic. The heart of the house, the kitchen, stands out with its stunning cupboards and stainless-steel appliances. Step outside into the backyard oasis featuring a refreshing pool, offering the ideal spot to cool off during those hot summer days, ideal for entertaining guests. The brand-new roofer, RV Parking, and new interior and exterior paint. Perfectly situated near schools, hospitals, parks, and local shops, this home offers the ideal blend
Beautiful upstairs unit. This one-story, two-bedroom, one-bath condo has been recently renovated and features a modern kitchen and bathroom. The kitchen is equipped with a fridge, dishwasher, and electric range. There is a two-car garage with storage. It is close to the freeway and Bart. The HOA includes water, garbage, sewer, security, common area maintenance, insurance, and more. Ready to move in.
Welcome home! This adorable, move in ready home offers 3 bedrooms, a nicely updated bathroom, laminate flooring throughout, and a spacious backyard. Owned solar for reduced energy bills. Close proximity to highway 4 access and eBART. OPEN HOUSE Saturday 4/27 and Sunday 4/28 from 1-3pm.
Welcome to this stunning single-story home in Antioch! Featuring 5 spacious bedrooms and 2 elegant bathrooms, this property offers the perfect blend of style, comfort, and functionality. The inviting family room boasts luxury vinyl plank flooring, newer paint, and ample natural light. The upgraded kitchen is a chef's dream, complete with stainless steel appliances and quartz countertops. The primary suite offers a luxurious en-suite bathroom with a soaking tub and a separate shower. The additional bedrooms are generously sized & the living room has been converted into a 5th bedroom with a closet providing even more space & versatility to the home. Functional upgrades to this pro
This charming 2 bedroom, 1.5 bath craftsman was built in 1918 by the seller's great grandfather. This was one of the first houses built in Antioch, and has a lot of potential for someone with the right vision. Located near Fremont Elementary School, Antioch Middle School, and Antioch High School. There is a supermarket less than four blocks away, and easy access to the freeway. The seller would like to keep the stained glass doors of the hutch in the living room, and the wall heater in the living room.
Nestled within a serene gated senior park (55+), this inviting mobile home offers a tranquil retreat. Boasting 2 bedrooms and 2 baths, the residence exudes comfort and style, with recent renovations. The spacious newly painted interior is adorned with stunning Italian wood laminate floors and soft plush carpeting in the bedrooms. The bathrooms are tastefully updated. Both bedrooms have generous walk-in closets. The open kitchen has a new refrigerator and stove. For added convenience, there is a laundry closet complete with a washer and dryer. Throughout the home are dual pane windows adorned with shutters. The family room features a charming free-standing electric fireplace, adding a touch
Great opportunity for SENIOR 55+ GATED Mobile Home Park * Must be Park approved and income must be 2 - 3 X the amount of the rent. Well maintained Senior Park 1248 sq ft, 2 bed 2 baths. Living room overlooks private covered deck. Dining room, spacious Kitchen and countertop, gas stove, refrigerator, laundry room with washer & dryer that stays. As is condition at this reduced price. Lovely remodeled clubhouse with pool tables, tennis table, swimming pool, spa, exorcise. Close to shopping and transportation. MOVE IN CONDITION! CAN BE FAST CLOSE AND OCCUPANCY. SHOWN BY APPOINTMENT ONLY!
Welcome to your perfect haven at Chandler! Step into a world of effortless luxury, where open-concept living takes center stage. This stunning 2021-built 5 bedroom, 4.5 bath residence offers nearly 2700 sq ft of luxurious living space. Picture-perfect gatherings come to life in the inviting great room, effortlessly flowing into the outdoor room—ideal for alfresco dinners! Step inside to discover tasteful upgrades and modern finishes at every turn, including elegant engineered wood flooring, upgraded kitchen sink and Vent, plush upgraded carpets, sleek quartz countertops, top-of-the-line stainless steel appliances included in the sale, chic two-tone paint, and a fully finished two car
Welcome to your spacious oasis at 2704 Hyacinth Ct, Antioch! This 4-bedroom, 2.5-bath home offers ample space for comfortable living. Four generous bedrooms provide flexibility for family, guests, or home office needs, while 2.5 baths ensure convenience and comfort for all. Conveniently located near freeways and shopping, this home offers easy access to everything Antioch has to offer while providing a peaceful retreat from the hustle and bustle. Enjoy the convenience of nearby shopping centers for all your daily needs, while being just moments away from major freeways for effortless commuting. Don't miss out on the opportunity to make this spacious and well-located home yours! Schedule a v
Super charming well maintained home w/ 3 bedrooms & 2 full baths. Located in East Village Neighborhood. Cozy pellet stove in living room that really puts out some heat. Partially covered rear patio with ample room for outdoor dining. A generous area of the patio allows for gardening. Close Proximity to Park, Walking Trails, Shopping, Schools & Freeway Access.
Shiny and bright describes this beautifully updated 3 bedroom 2 bath home. It’s been lovingly maintained by its owners and features new paint, new flooring, updated baths, a sizeable living room with recessed lighting and fireplace, granite countertops and stainless steel appliances in the kitchen, a separate dining room and so much more. The spacious backyard has many fruit trees and is the perfect place to spend get-togethers and barbecues with friends and family. The epoxy finished garage with an extra full-bath can serve as a game room, office, gym, extra bedroom for guests or provide extra storage. It's close to freeways and many amenities such as Los Medanos College, Walmart, wa
This home has 3 bedrooms and 2 bathrooms, making it a practical choice for families or anyone looking for a comfortable living space. With three bedrooms, there's enough room for everyone, and the two bathrooms add convenience for daily routines. It's a simple and functional layout, the front and backyard have ample amount of space for entertaining.
Gorgeous from the curb appeal to the gated entry/raised home entrance to a step down open concept floor plan. This customized 2 story home on a private cul-de-sac location offering 4 CAR GARAGE PARKING WITHIN 2 SIDE BY SIDE ENCLOSED GARAGES + lush front yard landscape + extensive custom stucco/rock accent edged rock/brick with columns & boundary walls to compliment the stunning exterior appeal. Enter into the upgraded kitchen rounded edged granite counters/front lined granite breakfast bar with upgraded stove & counters with beautiful cabinetry. New customized flooring throughout all the downstairs living area. Stunning downstair bath with tiled walls/edged in complimentary tile
Your chance to snag an incredible deal at 1521 Lipton St, Antioch, CA! This 3-bed, 2-bath home is priced below recent comparable sales, offering unbeatable value. It's a cosmetic fixer with recent upgrades: newer roof, gutters, updated kitchen & appliances, updated primary bath, & updated heating and central AC. This home has a large yard featuring fruit trees, is close to BART, freeway access, restaurants, & shopping and more. Don't miss this golden opportunity!
Nestled in the finest neighborhood of Antioch, 5172 Judsonville Dr stands out with its impressive features and location. Boasting a spacious 4,239 sq ft floor plan, this home welcomes you with high ceilings and large windows that flood the interiors with natural light, creating a warm and inviting ambiance. Step outside to discover a park-like garden, perfect for relaxing or entertaining guests. The property spans an expansive 0.35-acre lot (15,390 sq ft), offering plenty of space for outdoor activities and potential expansion. Inside, four gas-burning fireplaces add charm and comfort, while the entire home has been freshly painted and features new carpeting, ensuring a move-in ready experi
Beautiful home in the coveted Park Ridge Community, right on the Antioch/Brentwood border. This home features an expansive great room, refined kitchen with upgraded counters, stainless steel appliances, and a walk-in pantry. The generously sized bedrooms include a convenient downstairs bedroom, while the luxurious primary bathroom features a separate soaking tub, dual sinks, and dual walk-in closets. The family room features a cozy fireplace, creating a warm ambiance. Situated in a desirable location close to all amenities. Conveniently within walking distance to grocery stores such as Trader Joes, In-N-Out Burger, Lowe's, Home Depot and much more. This property offers an unparalleled level
Don’t miss this beautiful house near Lone Tree Golf & Event Center! Features with 5 bedrooms and 3 bathrooms, this 2-story SFH is spacious for your family. Open floorplan with high ceiling allows lots of natural light fill in your home. Open kitchen connect with breakfast nook. Fresh paint, new carpet and new lighting. One bedroom suite downstairs. Upstairs offers a large master suite with retreat. Walk-in closets. Well-built bathtub and walk in shower. Decent side backyard with built-in BBQ. 3 car garage and wise driveway. Central AC & Heat. No HOA. Premium neighborhood. Make it your home today!
This beautiful home in the highly desirable Eagle Ridge neighborhood has been renovated with new exterior windows, siding, paint, and newer roof. The glass accent door opens to the diagonally set tile flooring. Follow the tile into the powder room, as well as the gourmet kitchen and upstairs bathrooms. The beautifully updated eat-in kitchen boasts gorgeous dark cabinetry, brushed nickel pulls, designer tile backsplash, stainless sink and appliances, and skylight. The living, dining, and family rooms feature an inviting laminate floor. The family room is accented with a brick fireplace. The family room and laundry room also feature the matching cabinetry to carry the style throughout the dow
Welcome to 2117 Lemontree Way, an impeccably updated upstairs flat in Antioch, California. This charming residence features luxurious vinyl plank flooring and fresh interior paint throughout, creating a bright and inviting atmosphere. The remodeled kitchen is a chef's delight, equipped with modern amenities and ample space for culinary endeavors. With 925 square feet of living space, including two cozy bedrooms with mirrored closets and a bathroom with a tub and shower combo, comfort is guaranteed. Residents also enjoy access to the community clubhouse and pool, perfect for social gatherings and relaxation. Conveniently located near Highway 4 and the BART train station, commuting is effortl
Located in the coveted Delta Estates neighborhood, this well maintained ranch-style residence exudes charm and comfort. Boasting 3 bedrooms and 2 bathrooms, this 1,290 square foot house offers an ideal blend of space and functionality. Situated on a generous 8,000 square foot lot, the property provides ample room for outdoor recreation and relaxation. Enjoy the convenience of urban amenities paired with the tranquility of suburban living, as this home is conveniently located near parks, schools, and a plethora of dining options. Nature enthusiasts will appreciate the proximity to scenic walking trails and the serene waters of the Delta, perfect for leisurely strolls or adventurous explorati
Welcome to 2640 POINT ANDRUS CT! This charming single-story residence offers 4 bedrooms, 2. baths, and 1,286 sqft of living space on a 9,600 sqft lot. Upon entry, you'll be captivated by the wood flooring that perfectly complements the home's aesthetic. The heart of the house, the kitchen, stands out with its stunning cupboards and stainless-steel appliances. Step outside into the backyard oasis, offering the ideal spot to cool off during those hot summer days, ideal for entertaining guests. Perfectly situated near schools, hospitals, parks, and local shops
Adorable Almondridge home on court location! This single story home offers 3 bedrooms, 2 bathrooms, an eat in kitchen with a garden window, cozy wood burning fireplace in the living room, and a low maintenance backyard. Great location across from Almondridge park, close to freeway access, and eBART.
This area's enrollment policy is not based solely on geography. Please check the school district website for more information.
Elementary schools
Middle schools
High schools
GreatSchools Summary Rating
6/10
Loma Vista Elementary School
Public, K-5
5/10
Orchard Park School
Public, K-8
5/10
Grant Elementary School
Public, K-6
5/10
Mission Elementary School
Public, K-5
4/10
Diablo Vista Elementary School
Public, K-5
Only showing 5 of
18 elementary schools.
School data is provided by GreatSchools, a nonprofit organization. Redfin recommends buyers and renters use GreatSchools information and ratings as a first step, and conduct their own investigation to determine their desired schools or school districts, including by contacting and visiting the schools themselves.Redfin does not endorse or guarantee this information. School service boundaries are intended to be used as a reference only; they may change and are not guaranteed to be accurate. To verify school enrollment eligibility, contact the school district directly.
Homes for sale in Antioch have a median listing price of $615K. Some of these homes are Hot Homes, meaning they're likely to sell quickly.
What are some of the most popular neighborhoods in Antioch?
Popular neighborhoods include South Oakley, Dallas Ranch, Bridgehead, Downtown Antioch, Downtown Johnson City, East Lone Tree, Neroly, Contra Loma, Black Diamond Estates, and Black Diamond Canyon.
Transportation in Antioch, California is diverse, with options for both car travel and public transportation. For those preferring to drive, traffic levels can be high during peak hours, particularly in the downtown area. Antioch is well-connected with nearby highways and freeways, making it convenient for car owners. Public transportation is also available, with the Antioch-Pittsburg Amtrak station and the Tri Delta Transit bus service offering reliable commuting options. Learn more on our Antioch city guide.
What types of properties are available in Antioch?
Antioch, California offers a variety of single-family home types, including ranch-style homes, contemporary homes, and modern homes with open floor plans and spacious layouts. These homes can be found throughout the city, with many located in established neighborhoods and newer developments. Most properties feature 3-4 bedrooms and were built within the last 20 years. To explore different property types for sale in Antioch, California, use the 'Home type' filter located above the active listings. Customize your search by selecting options like single-family homes, condos, townhomes, and more.
What is life like in Antioch?
Antioch, California offers a unique living experience with its diverse range of landscapes, including rolling hills, picturesque valleys, and stunning waterfront views. The region experiences a Mediterranean climate, characterized by mild winters and hot summers, allowing for a variety of outdoor activities year-round. The city provides a range of job opportunities across various industries, including manufacturing, healthcare, and education. Residents can enjoy a vibrant arts and culture scene, with local theaters, galleries, and community events. Additionally, the city offers numerous recreational options, such as hiking trails, parks, and sports facilities, catering to different interests and preferences.
What are the schools and amenities like in Antioch?
Antioch, California offers a variety of public amenities to its residents. The city boasts a number of restaurants, catering to a wide range of culinary tastes. For those who enjoy outdoor activities, there are several parks available for leisure and recreation. Grocery stores are also plentiful, providing residents with easy access to daily necessities. Additionally, Antioch offers more amenities such as schools, libraries, and healthcare facilities, ensuring a comprehensive living experience for its residents.
In the past month, 67 homes have been sold in Antioch. In addition to houses in Antioch, there were also 20 condos, 8 townhouses, and 3 multi-family units for sale in Antioch last month. Antioch is a minimally walkable city in Contra Costa County with a Walk Score of 41. Antioch is home to approximately 101,929 people and 18,855 jobs. Find your dream home in Antioch using the tools above. Use filters to narrow your search by price, square feet, beds, and baths to find homes that fit your criteria. Our top-rated real estate agents in Antioch are local experts and are ready to answer your questions about properties, neighborhoods, schools, and the newest listings for sale in Antioch. Our Antioch real estate stats and trends will give you more information about home buying and selling trends in Antioch. If you're looking to sell your home in the Antioch area, our listing agents can help you get the best price. Redfin is redefining real estate and the home buying process in Antioch with industry-leading technology, full-service agents, and lower fees that provide a better value for Redfin buyers and sellers.


 REDFIN IS COMMITTED TO AND ABIDES BY THE FAIR HOUSING ACT AND EQUAL OPPORTUNITY ACT. READ REDFIN'S FAIR HOUSING POLICY AND THE NEW YORK STATE FAIR HOUSING NOTICE.
 United States
 Canada