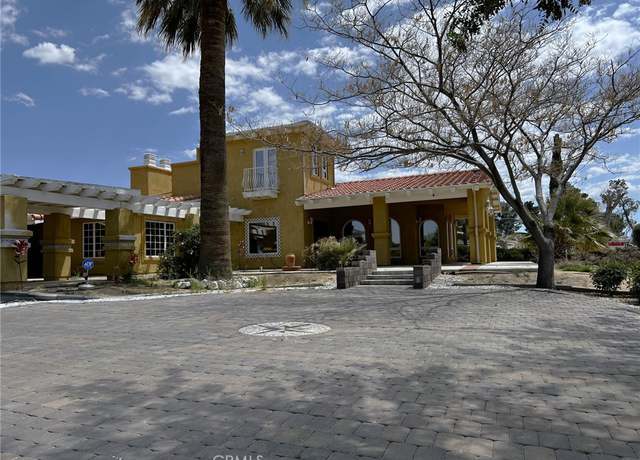
Discover an exciting income-generating opportunity. From the moment you set eyes on this home, you'll notice that this home stands out from the rest. It's not just another cookie-cutter house; it has character and charm that are hard to find elsewhere. The architecture, layout, and features are carefully curated to create a one-of-a-kind living experience. Every aspect of this home has been meticulously crafted with care and attention to detail. From the intricate woodwork to the updated appliances, you'll find evidence of craftsmanship throughout the entire property. The kitchen has undergone impressive renovations, valued at over $100,000 by the seller, and the thoughtfully designed floor
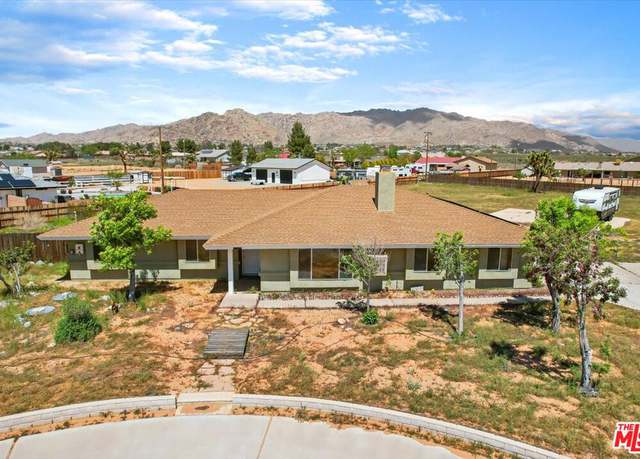
Easy access to Hwy 18 and freeway. Newly renovated kitchen with new cabinets, appliances and stunning quartz counter tops. 3 bedroom 2 bath house with a den that is being used as a 4th bedroom. Large . 69 acre corner fenced lot. Exterior has just been completely painted. Large covered patio. In ground pool will be filled before close of escrow. Beautiful mountains provide a majestic backdrop for the pool area. Circle driveway in front for convenience. Rv parking. Plenty of room for toys and for pool parties and BBQ's in the backyard.
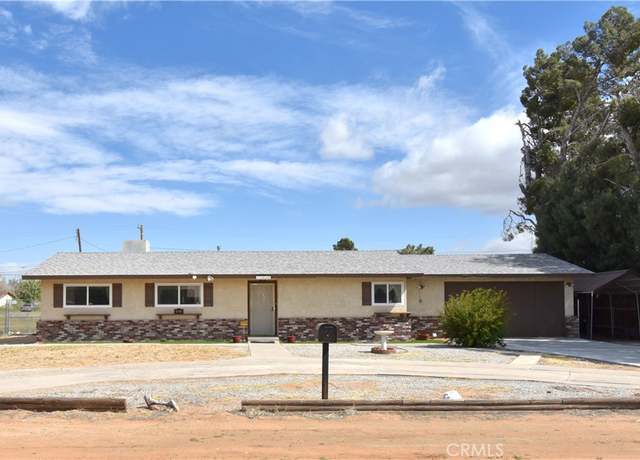
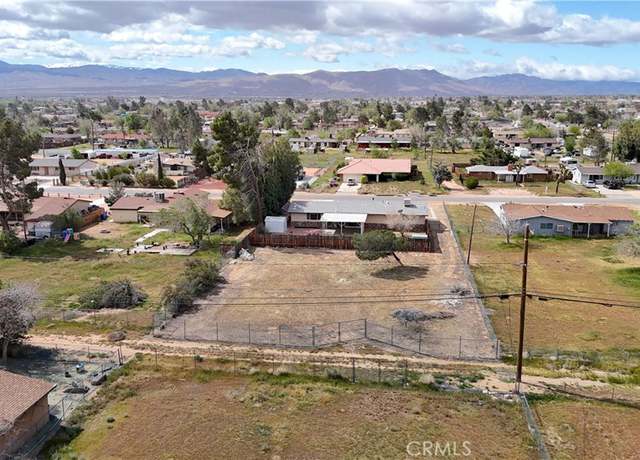
This home has 3 bedrooms and two baths and the garage was converted into a very large living room with a gas stove heating unit that looks just like a wood burning stove. This room also has the washer and dryer in an enclosed area with folding doors. The kitchen has upgraded oak cabinets and built-in dishwasher , dual kitchen sink , gas stovetop and gas oven. The family room has a 10 foot slider that leads to a large covered patio and a cozy backyard . The house has a newer Lennox heating furnace and cooling is a roof evaporative cooler and the septic system was replaced just last year. The lot is fenced and cross fenced and has plenty of room for a detached garage if desired.
Fall in love with the beautiful curb appeal of this 3 bed, 2 bath home sitting on a 1 ACRE CORNER LOT. This spacious home is filled with massive potential. Offering a large living room with cozy fireplace, master suite with walk in closet, FULLY PAID SOLAR and central heat/air. It features a circular driveway, 2 car attached garage with plenty of room for multiple vehicles and space for RV/toys. The exterior of the home has new stucco and it was recently painted. You will also find a storage shed in the yard along with a dog run area. It is located in a nice neighborhood surrounded by many custom homes. Take advantage of the endless opportunities.
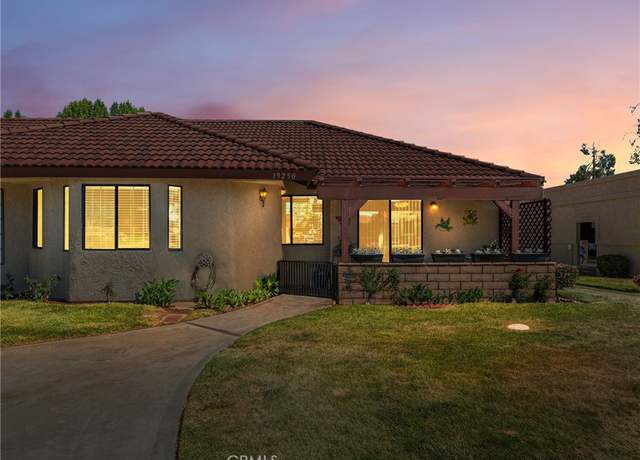
Make 19250 Cottonwood Drive your new address and start living your best life today. This stunning residence is a 2 bedrooms, 2 bathrooms, and 977 square feet. From the moment you step through the door, you'll be captivated by the attention to detail and upgraded finishes that define every corner of this home. The recent remodel in 2019 with highlights including hand-textured ceilings and walls, tile floors, raised hallway ceiling height, solid wood interior doors, brushed nickel hardware and plumbing fixtures, granite window sills, faux wood blinds, ceiling fans, and shaker-style soft-close cabinets throughout. The kitchen is a delight, featuring granite countertops, glass backsplash, a far
Welcome to Apple Valley Mobile Home Lodge. Come see our quaint corner home located to the rear of the park with tons of parking for family and guests. This 2 bedroom 2 bath with office and indoor laundry is perfect for starter home and those looking to downsize. Enjoy the fenced backyard with room for a small pet and private storage shed. Mobile park has community pool and small park. Interior has recently replaced subflooring, electrical outlets and electric panel. Low monthly space rent, buyer must obtain park management approval. Call to schedule your showing.
Welcome to the beautiful and highly desirable 55+ Community known as Del Webb. Indulge in resort-style amenities and live the vacation lifestyle every day! This turnkey, charming 2 bed, 2 bath home provides an open floor plan as well as a bonus Den that could be converted into a 3rd bedroom. with the gorgeous kitchen located in the the center of the home while also providing a split floor plan that has the second bedroom and bathroom opposite of the large master suite. Kitchen has been painted and updated with a large island that is opened up to the living room. This split floor plan offers privacy and the beautifully appointed master bath features a large garden tub and step in shower as w
CHECK THIS ONE OUT!!! Located on a LARGE CORNER LOT with RV PARKING in the highly desirable DESERT KNOLLS community is this GREAT home with AMAZING ADU potential. Home features garage space for 4 cars - which includes an attached 2 car garage with circular driveway AND an additional DETACHED 2 car garage spaced from the home with its own driveway to really bring in the possibilities to convert to an ADU for multi generational living or supplemental income. The interior of the home has been beautifully updated with WARM WOOD FLOORING and Neutral colors. The stepdown Living Room creates a conversation area and features a large picture window with a SHOW STOPPING VIEW of the snow capped mount
Don't miss out on this gem! Take a look at the photos and you'll see this stunning property speaks for itself! New pool, spa, most of the backyard landscaping, putting green, solar, roof, and water heater were all just added last year. Please note there is a loan for the solar and roof work which must be assumed by the buyer(s).
Welcome to this cozy and very spacious home located in the heart of desert Knolls with PAID OFF/FULLY OWNED SOLAR. It is situated on an acre lot that is fully fenced, it has a new Alumawood patio with fans and electrical outlets, a cinderblock courtyard to host parties, new garage door and garage door motor. This home boasts an open floor plan that has three bedrooms and three bathrooms, indoor laundry room, a wood burning stove, new matching black stainless steel appliances, new front doors, newly remodeled bathrooms and remodeled kitchen that has quartz countertops and quartz sink, new windows throughout the house, and wood tile flooring. Sunroom is fully permitted and usable. Come see th
2 bedroom 2 bath condo in Jess Ranch. Beautiful plantation shutters throughout to open to beautiful views. Newer tankless water heater! Large back patio with entry doors from the master bedroom and living area. Laminate wood flooring. Walk in shower in hall bath and bathtub/shower in master. All appliances stay, to include washer/dryer and refrigerator. 1 Car garage with cabinets for extra storage will stay.
Welcome to 12183 Iroquois Road, Apple Valley, CA, 92308 – a well-maintained property that offers an excellent opportunity in a tranquil neighborhood. Currently going through probate, this home presents a unique chance for buyers looking to personalize their space seeking a place of their own. Nestled in a serene part of Apple Valley, this home has been lovingly cared for and is ready for its next chapter. The estate sale, is scheduled for the first week of June, which will include various items from the home, providing an opportunity for the new owners to acquire unique finds at the estate sale if needed. The interior boasts a functional layout that accommodates both relaxation and en
* * Beautiful Apple Valley Home * * This gorgeous 3 bedroom 2 bath home recently fully upgraded with SPC flooring through out, custom kitchen cabinets with quartz counter tops. All new recessed lighting with high vaulted ceilings giving this home all the modern day vibes. This home is fully equipped with all the security your family will need from the front entry security gate to the ADT home security alarm and cameras. Newer landscaping in front and back with grass and plenty of space to park all your desert toys this back yard also features a beautiful oversized deck. Making this the ultimate hosting house for all your friends and family to come together.
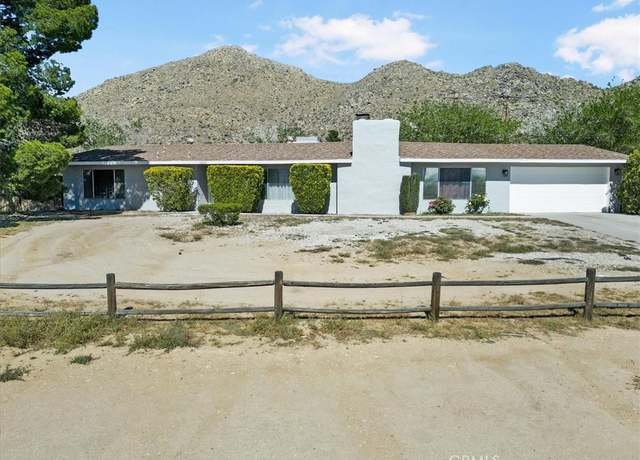
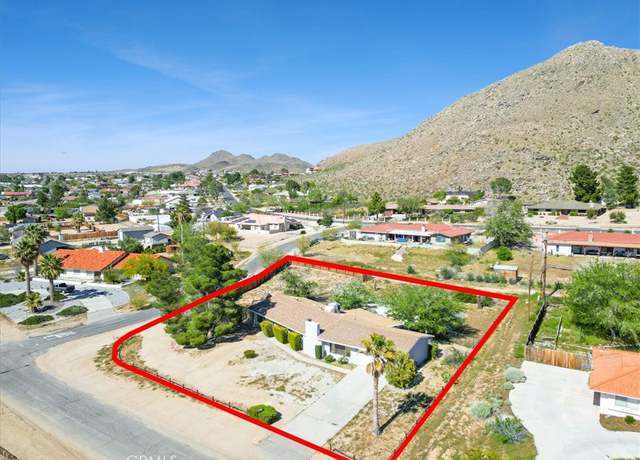
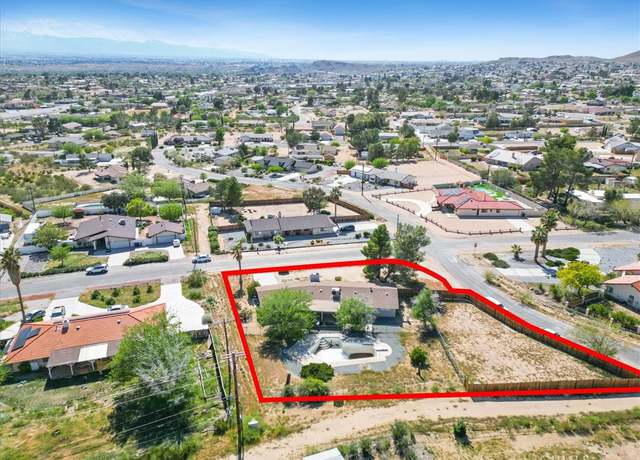
Don't miss this great opportunity to own this nice sized, ranch style home in the heart of Apple Valley! This home is centrally located in town and is easier to access from the freeway ever since the completion of the Yucca Loma Bridge. Schools and shopping are nearby and when you get home you can either hang out and enjoy the view of the Mariana Hills or take a walk on the jogging trail adjacent to your property. The neighborhood is mature and very family oriented. Take advantage of the community activities such as the concerts in the park near the town hall. This home has over a half an acre of land with 4 bedrooms and 2 bathrooms. You can't lose with this home.
The Serenity floor plan is absolutely stunning, 2 bedrooms, 2 bathrooms, well cared for home in the Gated 55+ community of Apple Valley. This entertainer's dream features a huge family room with the open kitchen concept with granite countertops, and separate formal dining room makes it great layout for entertaining. The built in custom appliances and pantry are all perfect additions to the beauty of this home. This home features storage galore throughout! The Master bedroom is nice sized and the adjoining master bath has a soaking tub and a walk-in shower is located near the oversized walk-in closet. The large indoor laundry has an abundance of cabinet space. The extra room can be used as a
Welcome to the Ultimate Find! Move in Ready! 13493 Mesquite Rd Apple Valley this 3-bedroom 2- bathroom 1542 square feet home; sits on half an acre of land. Home features: New water heater, new carpet, new paint throughout the home. Kitchen remodeled, Quartz counters, Beautiful Backsplash, Farm Style Sink, Large pantry. New appliances: New Range, new dishwasher, and new microwave, with one year warranty. Laminate flooring throughout. Upgraded dual paned windows. The front is fully landscaped gorgeous river rock. Corner lot only one neighbor next to you. Back yard is a dream; New Concrete backyard with fire-pit. Relaxing Mountain View’s, Privacy fencing, brick wall, Covered patio. RV P
Welcome to your dream retirement oasis! This impeccably maintained, almost-new gem nestled in a serene 55+ community is a haven of comfort and style. Step inside to discover a spacious 2 bedroom, 2 bath retreat spanning 1,511 sq ft of modern living space. The open concept layout invites you to unwind and entertain effortlessly. The heart of the home, the kitchen, boasts elegant granite countertops, gleaming stainless steel appliances, including a refrigerator, pantry, a cozy breakfast nook, and a convenient eating counter/bar for casual dining or mingling with guests. Your primary sanctuary awaits, complete with upgraded flooring, a mounted 54" TV for evening relaxation, and a soothing
POOL HOME APPLE VALLEY - This gorgeous pool home is located in the desirable Vineyard community of Apple Valley. This beautiful home is split living/open floorplan concept with tall ceilings, great curb appeal and an oversized drop in lined pool. There are 5 bedrooms, 3 bathrooms, indoor laundry open living room to kitchen with formal dining area/sitting area, and tons of space for family gatherings. The 3-car garage has extra space and there's plenty of parking in the front of the home as well as a driving through double gate to the back yard to store boats/RV or trailers. The backyard is large enough to build a second garage or second dwelling. The master bedroom has double doors and is o
Welcome to 18899 Munsee Rd, a stunning, picture perfect 3-bedroom, 3-bathroom home that combines comfort with endless possibilities for entertainment and relaxation. Nestled in the welcoming community of Desert Knolls Heights in Apple Valley, this house offers 2,152 sqft of living space with recent upgrades including a 2 year old updated roof. Inside, the house has plenty of natural light, creating a warm and inviting atmosphere. The spacious living areas combined with the dining area and kitchen truly make this the heart of the home. All bedrooms are generously sized with the primary bedroom having its own ensuite bathroom. The home is on a generously sized 0.80 acre lot that provides ampl
Great investment opportunity for a completely rebuild in 2023. Great mix of 2 beds/2 baths, carports, balconies, and fenced patio, gated secure access and ample land to play around. Delivered fully occupied with room to grow. Stucco build with great bones needing minimal management. Priced to sell at an attractive cap rate. PORPERTY FEATIRES THE FOLLOWING: COMPLETELY REBUILD IN 2023 NEW HVAC, FLOORING, KITCHENS, BATHROOMS, WINDOWS DESIRABLE MIX - ALL 2BEDS/2BATHS BIG LOT WITH ROOM TO ADD MORE ADUs LOW DROUGHT, WATER - EFFICIENT LANDSCAPING EASE OF MANAGEMENT WITH SUPER LOW MAINTENANCE AMPLE PARKING WITH LAND TO SPARE
LOCATION - This nicely upgraded Apple Valley 4-bedroom, 2 bath home sits on a corner lot in a nice quiet neighborhood. The home was recently updated with waterproof wood laminate flooring, quartz countertops, interior & exterior paint, and a new roof. Walk in and feel the oversized living space with a dining area or formal dining area off the kitchen. The seller added new cabinets, windows and new stainless steel kitchen appliances, with a farmers sink and stand-up pantry near built-in nook for the refrigerator. The seller added a white backsplash and black hardware throughout the home. All the bedrooms are nice sized and there's plenty of cabinets for linens and storage. You won't be
* * L O C A T I O N & P A I D O F F S O L A R * * Don't miss the opportunity to purchase a home in this highly desirable location! Great school zoning and only minutes from shopping and dining. Arriving to this home you will appreciate the curb appeal with low maintenance landscape and tons of cement. Property is fully fenced, cross-fenced has RV parking and has a dog run area. Inside you'll notice tile flooring through high traffic areas and plantation shutters through out. Living room has a newly updated fire place. Dining room leads you outside with a new slider door. Kitchen has been upgraded with newer cabinets, countertops, back splash and appliances. Off the kitchen is
Turnkey single story home in the private Active Adult 55+ Community, Solera by Del Webb! This guard-gated community’s amenities include indoor and outdoor pools and spas, gym/fitness center, tennis courts, meeting rooms, library, ballroom, billiards room and endless community activities including bingo and billiards tournaments. Boasting three bedrooms, two bathrooms, and 1,632 square feet of living space, this residence offers a seamless blend of style and functionality. Upon entry, upgraded vinyl plank flooring simulating a wood look spans the main living areas, enhancing both aesthetics and maintenance ease. The open floor plan effortlessly connects the kitchen—featuring gran
Nestled in the picturesque city of Apple Valley, this charming single-story family residence offers comfort, convenience, and breathtaking views. Recently renovated, this home boasts modern updates while retaining its cozy appearance. Property features 3 spacious bedrooms and 2 beautifully appointed bathrooms; this home provides ample space for family living. Enjoy the benefits of recent renovations, ensuring a fresh and contemporary atmosphere throughout the home. Perfect for outdoor enthusiasts or those with recreational vehicles, the property offers convenient RV parking along with a wrap-around driveway for additional parking space. Situated on a sprawling 15,000 square foot lot, there'
This stunning home in Apple Valley, CA, offers spacious living with two master suites, a 4-car garage, and beautifully landscaped grounds. Boasting 2978 square feet, 4 bedrooms, and 3 bathrooms, it exudes comfort and style. Built in 2002 and recently sold for $550,000, it's nestled in a quiet, family-friendly neighborhood near schools, parks, and shopping at Jess Ranch. Inside, enjoy a bright, airy interior with a modern kitchen featuring stainless steel appliances and granite countertops, a cozy living room with vaulted ceilings and fireplace, and a luxurious master suite with walk-in closet and ensuite bathroom. Perfect for families or those seeking ample space and convenience, this home
Welcome to your dream home! This charming and cozy property is perfect for those seeking comfort and sustainability. Tucked away in a serene neighborhood, this gem offers a roomy living area, complete with an updated kitchen, a built-in pantry that’s both stylish and functional, and with a bonus room, you have the flexibility to create a home office, hobby/ work room or more. Outside, you'll love the expansive lot—perfect for gardening, entertaining, or just enjoying the fresh air. Plus, this home has PAID solar, you can look forward to lower utility bills. Don't miss this opportunity—schedule your private tour today and experience all this property has to offer!
A turnkey home in Apple Valley with lots of upgrades. Recently updated kitchen, dual pane windows, septic tank, exterior paint and HVAC system. This home sits on a large lot with plenty of room to accommodate any extra toys. A single story home with over 2200 square feet of living space with 4 bedrooms and 2 full baths. A must see to appreciate what this home offers. A fully landscaped backyard with low maintenance makes it perfect for gatherings.
Welcome to your dream home at 18520 Cocqui Rd in the serene Apple Valley, CA. This remarkable residence boasts a spacious layout with 4 bedrooms and 3 bathrooms, making it perfect for families or anyone seeking ample space. The large lot provides generous outdoor space for entertaining, gardening, or simply enjoying the beautiful California weather. The property features a highly desirable RV garage, catering to adventure seekers or those in need of extra storage. Additionally, comfort is guaranteed year-round with two AC and heating units ensuring the ideal temperature no matter the season along with two evaporative swamp coolers. Situated in a tranquil area, this home offers a peaceful re
* * * Stunning NEW Construction in Apple Valley * * * Just a few short feet from the Pavement * * Natural GAS * * Just under an acre of flat, usable land * * Quartz Counter tops through-out * * * The Kitchen has a nice size Center Island & black Stainless-Steel appliance * * * Custom Light fixtures & Ceiling Fans * * Plenty of Storage * * Split Floor plan with 4 Spacious Bedrooms & 3 bathroom * * Beautiful VIEWS all-around of the Mountains * * Open Concept living * * PAID SOLAR * * This home will not disappoint * *
* * * Stunning NEW Construction in Apple Valley * * * Just a few short feet from the Pavement * * Natural GAS * * Just under an acre of flat, usable land * * Quartz Counter tops through-out * * * The Kitchen has a nice size Center Island & black Stainless-Steel appliance * * * Custom Light fixtures & Ceiling Fans * * Plenty of Storage * * Split Floor plan with 4 Spacious Bedrooms & 3 bathroom * * Beautiful VIEWS all-around of the Mountains * * Open Concept living * * PAID SOLAR * * This home will not disappoint * *
Welcome to this stunning five bedroom, three full bathroom home located on over a half acre of land in the highly sought-after community of Apple Valley. This home boasts updated bathrooms, tile plank flooring, as well as new carpet throughout. The backyard is truly a paradise, featuring a custom fire pit and gazebo barbecue area with built-in benches. The pool is perfect for hot summer days, complete with a waterfall, slide, and Baja step. Additionally, a shed is included for extra storage. The lush grass and palm trees create a beautiful oasis, perfect for entertaining friends and family. Don't miss out on this amazing opportunity to call this gem your own,
Beautiful remodeled single story home in Apple Valley, plenty of space 5 bedrooms, 2 bathrooms, almost 3 quarters of an acre lot plenty of land fully fenced, home has new flooring, new paint inside and outside, open space layout in kitchen and living area, cozy fireplace, 2 A/C units one is brand new the other one is Upgraded. Centrally located near many restaurants and stores, new closet doors, new laminate flooring throughout all bedrooms, kitchen, and living room, tiled bathrooms, Recessed lights in the kitchen, living room and hallways, new ceiling fans, new fixtures throughout, kitchen has been fully renovated with new cabinets, Quartz countertops with beautiful backsplash, new stainle
HUGE CORNER LOT WITH THREE CAR GARAGE!!! This super spacious home is located in the premier mobile home park, Vista Del Rosa. This park is senior living at its best and is ready to be your forever home!! It features a large living room with a rock-faced fireplace and mantle, plus a bar area, perfect for entertaining family and friends. There is plenty of storage, from the kitchen to the large laundry room. The laundry side door exits to the private side covered patio where you have more space to entertain and enjoy the outdoors. The kitchen has great counter space, a greenhouse window that is wonderful for growing herbs or plants, a gas stove, a pantry and a breakfast bar that extends into
Discover this Southwestern desert home where contemporary architecture meets Mediterranean influences, promising a truly unique living experience. This rare gem features recently re-conditioned roof, new carpet in the bedroom, modern gate control with video monitors (Operated via a Convenient Phone App), new irrigation controls and lines, all drains and gutter have been hydro cleaned. This 3,460sqft. home boasts 4 bedrooms and 3 bathrooms spread across three levels. the main level offers floor to ceiling windows that fill the interior with natural light, creating an inviting atmosphere. Sliding glass doors lead you out back to a spacious patio, pool, and spa area, creating the ideal space f
This area's enrollment policy is not based solely on geography. Please check the school district website for more information.
Elementary schools
Middle schools
High schools
GreatSchools Summary Rating
7/10
Endeavour School of Exploration
Public, K-6
5/10
Rio Vista Elementary School
Public, K-6
4/10
Vanguard Preparatory School
Public, K-8 • Choice school
4/10
High Desert Premier Academy
Public, K-12 • Choice school
3/10
Sandia Elementary School
Public, K-8
Only showing 5 of
14 elementary schools.
School data is provided by GreatSchools, a nonprofit organization. Redfin recommends buyers and renters use GreatSchools information and ratings as a first step, and conduct their own investigation to determine their desired schools or school districts, including by contacting and visiting the schools themselves.Redfin does not endorse or guarantee this information. School service boundaries are intended to be used as a reference only; they may change and are not guaranteed to be accurate. To verify school enrollment eligibility, contact the school district directly.
Buy the right home at the right price near Apple Valley with a local Redfin real estate agent.
Homes for sale in Apple Valley have a median listing price of $450K. Some of these homes are Hot Homes, meaning they're likely to sell quickly.
What are some of the most popular neighborhoods in Apple Valley?
Popular neighborhoods include Jess Ranch, Quartzite, Frost, Bell Mountain, Sun City Apple Valley, Desert Knolls, Old Town Victorville, Thorn, Lone Wolf Colony, and Northeast Hesperia.
Transportation in Apple Valley, California, is predominantly car-centric, with the majority of residents relying on cars for their daily commute. Traffic levels can vary, but generally, Apple Valley experiences less congestion compared to larger Californian cities. Public transportation is available, with Victor Valley Transit providing bus services throughout the town. For those who frequently travel out of town, the convenient proximity to Interstate 15 and Highway 18 makes Apple Valley a strategic location for easy access to surrounding areas. Learn more on our Apple Valley city guide.
What types of properties are available in Apple Valley?
Apple Valley, California offers a variety of single-family home types, including ranch-style homes, contemporary homes, and modern homes, each with their own unique architectural styles and designs. These homes can be found throughout the different neighborhoods of Apple Valley, such as Desert Knolls, Jess Ranch, and Mariana Ranchos. Most properties in Apple Valley, California feature 3-5 bedrooms and were built in various years. To explore different property types for sale in Apple Valley, California, use the 'Home type' filter located above the active listings. Customize your search by selecting options like single-family homes, condos, townhomes, and more.
What is life like in Apple Valley?
Apple Valley, California offers a serene and picturesque living experience with its stunning landscape characterized by rolling hills, vast desert expanses, and breathtaking sunsets. The region enjoys a predominantly sunny climate with hot summers and mild winters, providing residents with ample opportunities to enjoy outdoor activities year-round. The area boasts a range of job prospects, including positions in healthcare, education, retail, and manufacturing, fostering a thriving local economy. Residents can engage in a variety of recreational pursuits, such as hiking, biking, and exploring the nearby national parks, as well as enjoying the vibrant local arts scene and community events.
What are the schools and amenities like in Apple Valley?
Apple Valley, California is home to a variety of public amenities that cater to the needs and interests of its residents. The town boasts numerous restaurants, offering a wide array of culinary experiences. For outdoor enthusiasts, Apple Valley provides several parks for leisure and recreation. Grocery stores are also plentiful, ensuring residents have easy access to daily necessities. Additionally, numerous other amenities such as schools, libraries, and fitness centers are available within the town's boundaries.
In the past month, 72 homes have been sold in Apple Valley. In addition to houses in Apple Valley, there were also 5 condos, 1 townhouse, and 7 multi-family units for sale in Apple Valley last month. Apple Valley is a not walkable city in San Bernardino County with a Walk Score of 13. Apple Valley is home to approximately 69,087 people and 12,056 jobs. Find your dream home in Apple Valley using the tools above. Use filters to narrow your search by price, square feet, beds, and baths to find homes that fit your criteria. Our top-rated real estate agents in Apple Valley are local experts and are ready to answer your questions about properties, neighborhoods, schools, and the newest listings for sale in Apple Valley. Our Apple Valley real estate stats and trends will give you more information about home buying and selling trends in Apple Valley. If you're looking to sell your home in the Apple Valley area, our listing agents can help you get the best price. Redfin is redefining real estate and the home buying process in Apple Valley with industry-leading technology, full-service agents, and lower fees that provide a better value for Redfin buyers and sellers.


 REDFIN IS COMMITTED TO AND ABIDES BY THE FAIR HOUSING ACT AND EQUAL OPPORTUNITY ACT. READ REDFIN'S FAIR HOUSING POLICY AND THE NEW YORK STATE FAIR HOUSING NOTICE.
 United States
 Canada