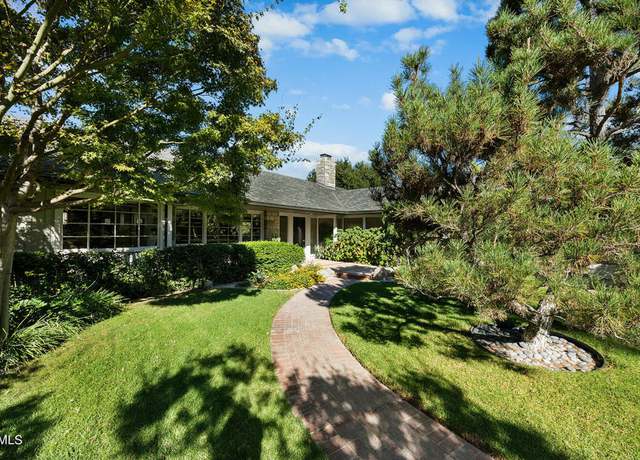
Welcome to 2393 Goodenough Rd. , a stunning mid-century modern masterpiece nestled in Fillmore, CA, designed by acclaimed architects Roy Wilson and John Stroh. This sprawling 4,336 sq ft single-story residence boasts 3 bedrooms and 3 bathrooms, exuding timeless elegance and charm. Situated on two acres in the picturesque Sespe River Valley, with breathtaking vistas of the Padres Mountains, this 1950's home has been lovingly preserved and restored to its original period glory. Step inside to discover spacious rooms adorned with high ceilings, wide hallways, and expansive windows that invite natural light to dance throughout the home, while offering serene views of the surrounding gardens. Th
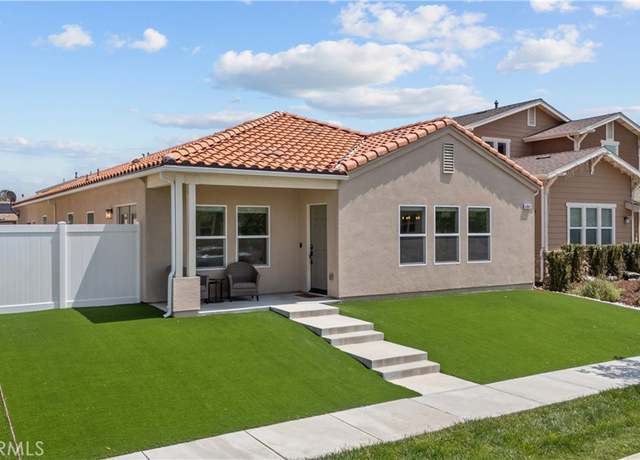
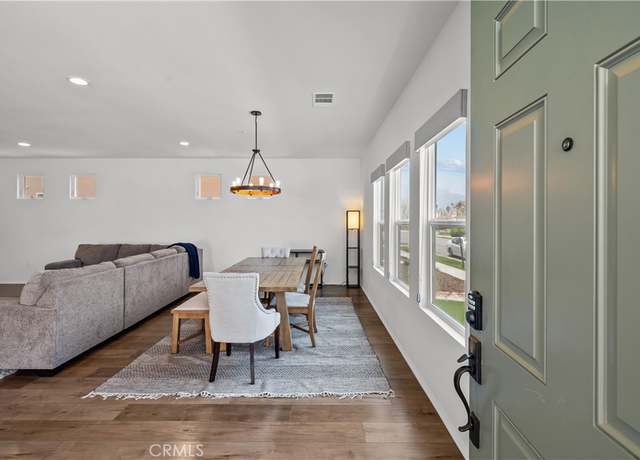
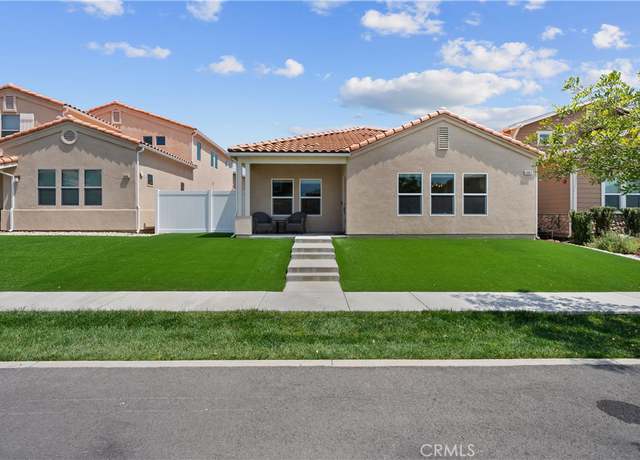
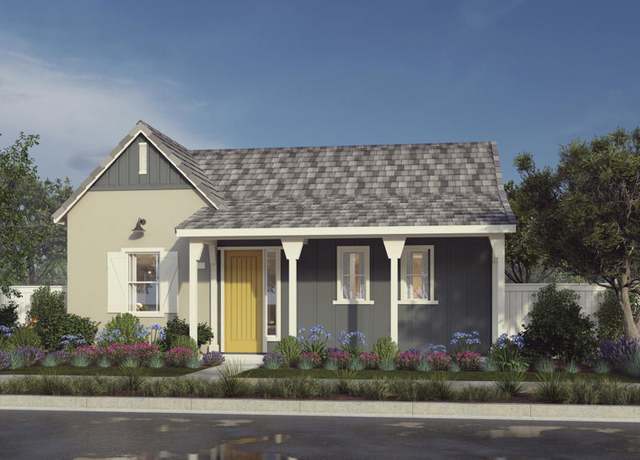
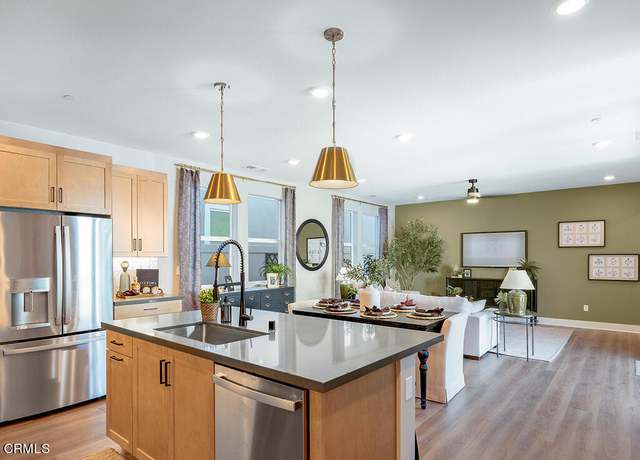
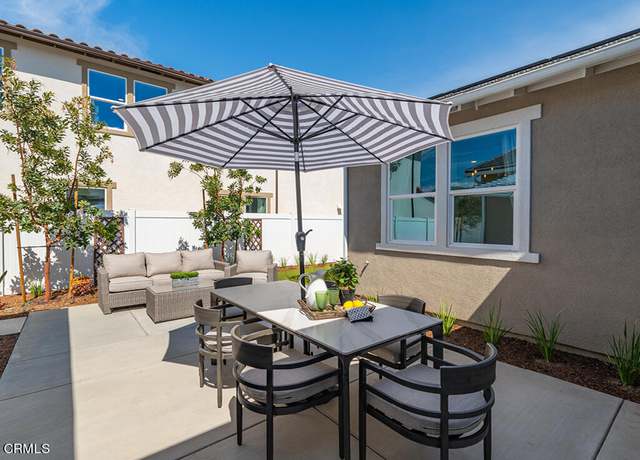
Located in the Piru Gateway community, this previous MODEL HOME was built in 2020. Single Story home providing 1,606 square feet of living, 3 bedrooms and 2 baths. With this popular open floorplan concept the kitchen is great for entertaining providing upgraded granite counter tops with room for seating, maple cabinets throughout, and stainless steel appliances in the kitchen. Some other highlighted features include a whole house attic fan for those summer nights, keyless door entry, Ring doorbell, upgraded floors, granite counter tops in Primary & Secondary bathrooms, epoxy garage floors, tankless water heater, low maintenance front yard with turf grass and indoor laundry. Newly pa
This residence boasts an array of captivating features, prime lot location and priced under market value in Ventura County. This property includes exquisite flooring, plantation shutters, custom closets in all bedrooms, home office, three car garage, balcony overseeing the scenic mountain range, custom saltwater aquarium tank, outdoor waterfall in the back and front yard. Crown molding and fine wallpaper throughout the home. The home is equipped with solar, tankless water heater, salt water pool and spa, outdoor shower, storage, BBQ island with fridge/sink, outdoor Gazebo with gas fireplace, Ring Security throughout the home. Property is located in the highly coveted Fillmore Bridges next t
Slow down, take a deep breath and experience a true sense of place. Finch Ranch, located in Ventura County's Piru, is a new neighborhood where residents can relax, stay, play, gather and enjoy the many comforts and inspirations of home. With the charm of the local Piru neighborhood and the celebration of culture, authenticity and community. Finch Ranch offers a secluded getaway and a return to nature's tranquility. A sanctuary, shielded from the hustle and bustle of modern living. It is where you can listen to the music of leaves and the wind in the trees. It is where the chorus of raindrops becomes a symphony. It is where you can take in the true sense of the soil as it embraces each new s
Single Story 3 Bedroom 2 Bathroom home in move in ready condition located on a cul de sac street. Home has recent landscaping upgrades to the front yard including drought resistant landscaping. Granite countertops in the kitchen with newer cabinets and appliances, forced air heating, air conditioning and solar panels. Back Yard includes covered patio, stamped concrete and above ground spa perfect for entertaining.
Bardsdale is a preferred area near Fillmore with Two Homes! 18.22 Acres of rare Level acres planted to income producing Valencia Oranges, Horse Facilities, Pool/Spa, BBQ Area & Bathrooms plus 2240 SF. of Living Space surrounded by sweet smelling Orange Blossoms. Gourmet Kitchen with Granite Counter-tops, Stainless Steel Appliances, Large island, Custom cabinets & Travertine Floors. 2nd home built in 2004 with over 2000 Sq Ft. , Gourmet kitchen, Granite Counter-tops, Stainless Steel Appliances, Hardwood Floors, Stone Fireplace, AC, Game Room & Plantation Shutters, . Arena/Stalls, RV Covered Parking & 2 car garage. Bonus Room Has Bedroom/Bathroom Downstairs (Three Se
Main residence plus Guest House on 18.22 Acres of high income producing USDA CERTIFIED ORGANIC Valencia and Navel oranges. Quality rebuilt main residence. Victorian wood trim and artisan carved beams throughout the home. Upscale large kitchen with granite counter tops and a large wrap around eating bar to accomodate large gatherings. Stainless Appliances include a Viking Cook top and a top of the line G. E. Monogram BUILT-IN refrigerator. Downstairs master bedroom and bath with additional bedroom & bath. Two bedrooms & bath upstairs. Approx. 1200 sq. FT, guest house with an expansive, covered deck, interior and exterior bathrooms above a six car garage. There are a few permitt
Introducing a Captivating opportunity at 292 Orchid St. Fillmore, CA 93015. Nestled in a vibrant community, this property boasts 2,703sqft, 4 bedrooms, 3 full baths, with a nice size back yard with space for a potential pool or even an ADU. Offering an ideal blend of comfort and convenience. Near parks, walking paths and some schools. With its prime location and charming appeal, this listing presents an enticing prospect for buyers seeking a new chapter in Fillmore's welcoming neighborhood. Don't miss out on the chance to make this your next home sweet home.
Welcome to Your Dream Craftsman Home in Fillmore, CA! Surrounded by lush Green Hills in the heart of Fillmore, California, this stunning Craftsman SINGLE STORY home at 460 Azalea Street is more than just a house; it's a sanctuary of comfort, style, and sustainable living. We're thrilled to present this impeccable property to you, where every detail has been thoughtfully designed to enhance your lifestyle. Step into luxury with this 2000 sq ft home boasting 3 bedrooms and 2.5 bathrooms. Crafted with precision and care in 2022, it exudes contemporary charm while preserving the timeless appeal of Craftsman architecture. Energy Efficient. Say goodbye to high utility bills. Let the Electric Comp
Welcome to this highly upgraded newer construction model home with solar in a gated community. This home has almost every option offered by the builder and offers the largest floor plan in EastBridge at almost 2500 sq. ft. This unique property has all the latest in designer touches, including high-end luxury tile plank flooring, grey quartz countertops in the kitchen, custom designer light fixtures, and window treatments. As you enter the foyer, you are greeted by the large airy open floor plan with tall ceilings. The spacious living area flows into the eat-in kitchen. The kitchen has a ten-foot quartz island with a built-in sink and dishwasher. The kitchen offers many upgrades perfect for
This fixer upper oozes charm. Built in 1915 with an addition, this beauty is on a tree lined street with many fine old homes. The covered front porch welcomes the visitor to a generous living room with hardwood floors. There are four bedrooms, 1 3/4 bathrooms, sunny living room and dining area, large kitchen with space for a convenient 'eat in' dining area. Everyone will enjoy the wide backyard. The property has convenient alley access in the rear offering the owner the possibilities of an additional dwelling unit or room for RV and extra vehicles. The long driveway also allows off-street parking. The new owner can apply their persoanl vision to this handsome home to take advantage of obv
Welcome to your future home! Nestled on a picturesque approximate 3 1/2 acre ranch property, this 2019-built single story home offers a harmonious blend of modern comfort and countryside charm. Amazing views of farms and mountains! Surrounded by lush fruit, sycamore and 100 year old Oak trees, the serene setting provides a tranquil retreat from the hustle and bustle of city life, yet it's conveniently close to urban amenities in Fillmore CA. This well maintained property boasts extensive infrastructure for water and electricity, ensuring uninterrupted utility services. The 3 bedroom, 2 bathroom house exudes warmth and elegance, with a cozy wood-burning fireplace perfect for chilly evenings.
Opportunity time to start with home ownership. This three bedroom 2.5 bath condo is on River Street in Fillmore, adjacent to local shopping and transportation. All bedrooms are upstairs. It has been painted and new flooring has been installed. The half bath is downstairs. Price includes refrigerator, air conditioning and there is a two-car attached garage with direct home access. There are two assigned parking spaces -- number 70 and 23. Guest parking on site. The Association is the Riviera Park Homeowners Association. Monthly fee is $313.
Newer Build Townhouse located in Piru Gateway Community. This townhouse has 3 bedrooms and 3 bathrooms with 2 cars attached garage. Main floor is open floor plan with a modern Kitchen, Central Air /Heat. Perfect for a first-time home buyer or Invesment. HOA $379
Nestled in the new esteemed community of The Orchards at Heritage Grove, 287 Wisteria St. embodies the epitome of modern luxury. This recently developed gem offers approximately 3,200 square feet of living space, featuring five bedrooms and three and a half baths. As you enter, you're greeted by a symphony of upscale touches that elevate every corner of the home. From the stunning tile flooring to the custom built-in cabinets and inviting front porch. The heart of the home is undoubtedly the chef-inspired kitchen, where sleek quartz countertops and top-of-the-line GE Cafe stainless steel appliances make cooking a pleasure. And with a generous walk-in pantry, you'll have plenty of room to st
Great opportunity, if you did not see it before now it is the time. The previous buyers loss is your gain. You are going to fall in love with this beautiful, move-in ready, single story home in a great neighborhood. The property is located within walking distance of two public parks and an elementary school. The home is located on a corner lot at the end of a quiet cul-de-sac with plenty of parking. Some of the features include a brand new coat of interior paint, hardwood floors in the bedrooms, natural colored tile in all the main areas and a remodeled bathroom in the master bedroom. The bedrooms included elegant mirror closet doors for your convenience. You are going to enjoy the low main
Welcome to 2492 Grand Ave in Fillmore - a sprawling 18-acre K9 Ranch with an established and renowned dog kennel boarding business, ''All Dogs Rule. '' This unique property offers a rare opportunity for both comfortable living and lucrative business ownership, nestled in the heart of Fillmore's scenic countryside. At the heart of this expansive ranch is a well maintained farmhouse, originally built in 1943 and recently upgraded to blend historic charm with modern amenities. Featuring two bedrooms and two bathrooms, this residence boasts fresh exterior paint and beautifully landscaped surroundings, offering a serene retreat for its occupants. In addition to the main farmhouse, two separate m
Welcome to your slice of country paradise at 1881 Grand Ave in Fillmore! This charming home offers the best of both worlds - the tranquility of rural living without sacrificing modern comforts. With 1,932 square feet of living space, three bedrooms, and three bathrooms, this home provides ample space for comfortable living. Originally built in 1952, this home has been thoughtfully maintained and upgraded to seamlessly blend its original character with modern conveniences. Step inside to discover new vinyl plank floors, fresh paint, and stylish blinds throughout, creating a welcoming ambiance. The heart of the home lies in the kitchen, boasting Corian countertops and plenty of space for meal
Welcome home to this charming single-story property on a corner lot. Enjoy the expansive front porch and the backyard featuring a professional putting green, an artfully designed landscape combining nature, unity and balance with a covered patio and tranquil dry creek bed. Plus, in the backyard you also have access to 220 power. Inside, the kitchen and bathrooms are adorned with subway tiles and stunning slate shower floors. Quartz countertops and a deep stainless steel sink make the kitchen shine. Electrical upgrades include 20-amp outlets, recessed lighting, ceiling fan wiring, and pendant lighting. Recessed LED lights throughout, extra outlets, and upper cabinets in the laundry room add
Great opportunity to own this beautiful home in a tranquil and desirable community. This property with almost 3,000sqft of living space includes 4 bedrooms, 3 bathrooms, loft, beautiful kitchen with island and granite countertops, large Walk-in Master closet, laundry room, large backyard and a 3-car garage! Perfect location near schools, shopping centers, walking trails, community park, restaurants and less than 18 minutes from the beach!
* * SOLAR PAID OFF & INCLUDED IN PURCHASE PRICE * * BACKYARD COMPLETED & READY FOR YOUR ENJOYMENT! Nestled on a tranquil street and surrounded by a picturesque mountain range, this custom home in the recently developed Orchards at Heritage Grove is a gem. Constructed in 2021, the meticulous homeowners spared no expense, investing over $70,000 in high-end upgrades, including fully paid-off solar system! Priced similar to base models, this home presents exceptional value, offering alluring upgrades in a ready-built package. Boasting approximately 2,600 SF of living space with a well-designed layout catering to both living and entertaining. The home is flooded with natural lig
Nestled in the heart of California's majestic mountains lies a beautiful ranch unlike any other. Surrounded by rolling hills and breathtaking scenery, this sprawling property is a horse-lover's dream come true. At its center stands a stunningly home, featuring 3 bedroom and 2 full bathrooms. With its open-floor plan, laminate floor, contemporary interior design and breathtaking views of the surrounding countryside, the house is a true sanctuary for those looking to escape the hustle and bustle of city life. Big 'lienzo charro' ready for many events, 16 Horse stalls. they can be divided. 4 acres with more than 900 Lemon trees. This is a unique property, with an oversized lot, a fabulous loca
Priced to Sell!! Welcome to this beautiful and exceptionally upgraded 2021 Heritage Grove home, with over $100,000 of interior upgrades, as well as $110,000 of exterior front and backyard professionally-designed landscapes! As you enter, you'll notice the tall ceilings, loads of windows bringing in so much natural light, and the gorgeous upgraded luxury vinyl plank flooring in entire home. Your family gathering space is anchored by the fabulous chef's kitchen with beautiful quartz countertops, enormous center island and top-of-line appliances, coffee bar, and large walk-in pantry. The exceptional kitchen space is open to the living room and dining room, making entertaining a breeze. If you
Take a look at this wonderful home located in a family park in Fillmore, CA! Property features 2 bedrooms 1-bathroom, spacious kitchen with lots of storage and granite backsplash, park features playground and pool great for entertainment!
Wonderful opportunity to own a new home in Fillmore. It includes 4 Bedrooms, 2.5 Baths, Kitchen with Island, Upgraded Kitchen Full Backsplash, Walk-in Master Closet, Laundry Room, Gas Stub at Rear Yard, Rear Covered Patio, with 2-car Garage. All Heritage Grove homes are subject to Mello Roos. This is a MODEL home! Beautiful landscaped front & back yards, gorgeous upgraded kitchen backsplash and other upgrades!
Wonderful opportunity to own a new home in Fillmore. It includes 3 Bedrooms, 2.5 Baths, Kitchen with Island, Upgraded Kitchen Full Backsplash, Walk-in Master Closet, Laundry Room, Gas Stub at Rear Yard, Rear Covered Patio, with 2-car Garage. All Heritage Grove homes are subject to Mello Roos. This is a MODEL home with many upgrades!! Beautiful flooring throughout and upgraded master bath tile surround, and a gorgeous unique fireplace at back patio.
Wonderful opportunity to own a new home in Fillmore. It includes 4 Bedrooms, 3 Baths, Loft, Kitchen with Island, Upgraded Kitchen Countertops and Full Backsplash, Walk-in Master Closet, Laundry Room, Gas Stub at Rear Yard, Rear Covered Patio, with 2-car Garage. All Heritage Grove homes are subject to Mello Roos.
Off a main highway; you enter a private road through a glen flanked by lemon and avocado groves and follow the concrete and brick lined path. You make one sharp curve and continue until you see flowering agapanthus. You arrive at the pinnacle of the rolling hilled valley where you see the country estate spread before you, "Villa Bellissima" with more than 6200 sq ft of living space. You park in one of two oversized garages. You have the choice of driving through the portico or parking nearby. On a moist morning, you can smell jasmine from nearby gardens and in spring , the fragrance of lemon blossoms from your own orchards fills the air. Your 44.7 acres are lush and the valleys ar
This area's enrollment policy is not based solely on geography. Please check the school district website for more information.
Elementary schools
Middle schools
High schools
GreatSchools Summary Rating
4/10
Mountain Vista School
Public, K-5
4/10
Rio Vista Elementary School
Public, K-5
4/10
Heritage Valley Independent Study
Public, K-12 • Choice school
3/10
San Cayetano Elementary School
Public, K-5
-/10
Fillmore Adult
Public, N/A
Only showing 5 of
6 elementary schools.
School data is provided by GreatSchools, a nonprofit organization. Redfin recommends buyers and renters use GreatSchools information and ratings as a first step, and conduct their own investigation to determine their desired schools or school districts, including by contacting and visiting the schools themselves.Redfin does not endorse or guarantee this information. School service boundaries are intended to be used as a reference only; they may change and are not guaranteed to be accurate. To verify school enrollment eligibility, contact the school district directly.
Buy the right home at the right price near Fillmore with a local Redfin real estate agent.
Fillmore, California boasts a well-connected transportation network, making it easy for residents to navigate the region by car. Traffic levels in the city are generally moderate, ensuring smooth drives for most of the day. The city is served by public transportation, including buses, providing an alternative for those who prefer not to drive. Additionally, Fillmore is conveniently located near major highways and freeways, offering easy access to surrounding areas.
What types of properties are available in Fillmore?
Fillmore, California offers a variety of single-family home types, including ranch-style homes, contemporary homes, and modern homes. These homes can be found throughout the city, with ranch-style homes typically located in the outskirts, contemporary homes in newer developments, and modern homes scattered throughout different neighborhoods. Most properties in Fillmore, California feature 3-4 bedrooms and were built within the past few decades. To explore different property types for sale in Fillmore, California, use the 'Home type' filter located above the active listings. Customize your search by selecting options like single-family homes, condos, townhomes, and more.
What is life like in Fillmore?
Fillmore, California offers a serene and peaceful living experience with its picturesque landscape. The region boasts a diverse range of natural wonders, including rolling hills, expansive fields, and breathtaking mountain views. The weather in Fillmore is characterized by mild winters and warm summers, allowing residents to enjoy a pleasant climate year-round. The town provides ample job opportunities across various industries, ensuring a vibrant local economy. In terms of recreation, residents can engage in a multitude of outdoor activities, such as hiking, biking, and exploring the numerous parks and trails in the area.
What are the schools and amenities like in Fillmore?
Fillmore, California offers a variety of public amenities to its residents. The city boasts numerous restaurants, catering to a wide range of tastes and cuisines. For those who enjoy outdoor recreation, Fillmore is home to several parks. In terms of daily necessities, there are multiple grocery stores available within the city limits. Additionally, Fillmore provides other amenities such as schools, libraries, and medical facilities for the convenience of its residents.
In the past month, 7 homes have been sold in Fillmore. In addition to houses in Fillmore, there were also 2 condos, 2 townhouses, and 1 multi-family unit for sale in Fillmore last month. Find your dream home in Fillmore using the tools above. Use filters to narrow your search by price, square feet, beds, and baths to find homes that fit your criteria. Our top-rated real estate agents in Fillmore are local experts and are ready to answer your questions about properties, neighborhoods, schools, and the newest listings for sale in Fillmore. Our Fillmore real estate stats and trends will give you more information about home buying and selling trends in Fillmore. If you're looking to sell your home in the Fillmore area, our listing agents can help you get the best price. Redfin is redefining real estate and the home buying process in Fillmore with industry-leading technology, full-service agents, and lower fees that provide a better value for Redfin buyers and sellers.


 REDFIN IS COMMITTED TO AND ABIDES BY THE FAIR HOUSING ACT AND EQUAL OPPORTUNITY ACT. READ REDFIN'S FAIR HOUSING POLICY AND THE NEW YORK STATE FAIR HOUSING NOTICE.
 United States
 Canada