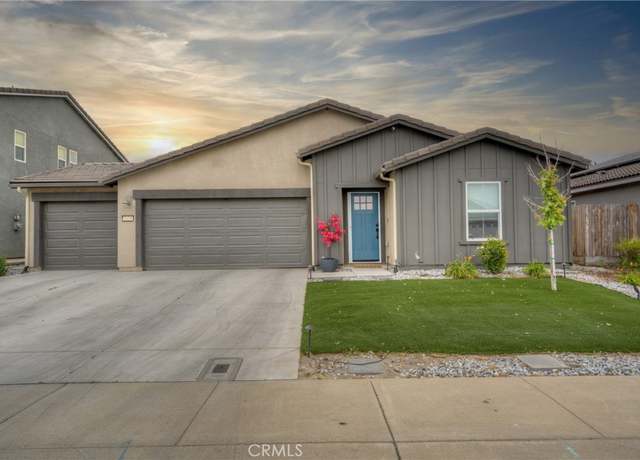
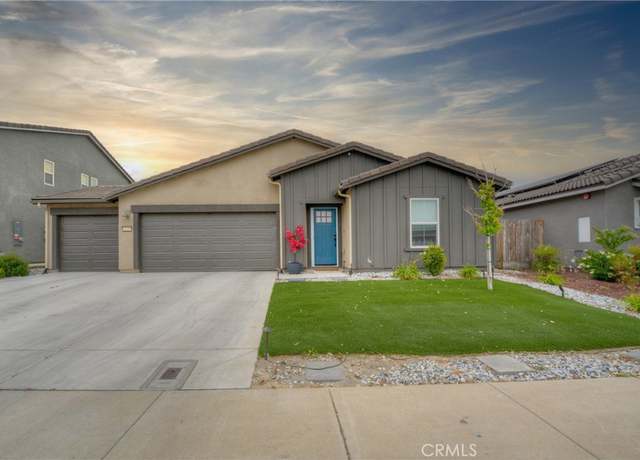
Welcome to your dream home! Nestled within a serene, gated community, this stunning residence offers the perfect blend of modern comfort and sophisticated living. As you step inside, you're greeted by an expansive open-concept floor plan spanning over 1800 square feet, seamlessly integrating the living, dining, and kitchen areas. The kitchen is equipped with state-of-the-art smart appliances that make cooking a breeze, and the sleek countertops, ample cabinetry, and a spacious island provide both functionality and style, make entertaining an effortless and enjoyable experience! The living space is designed for relaxation and entertainment, featuring large windows and offer plenty of open s
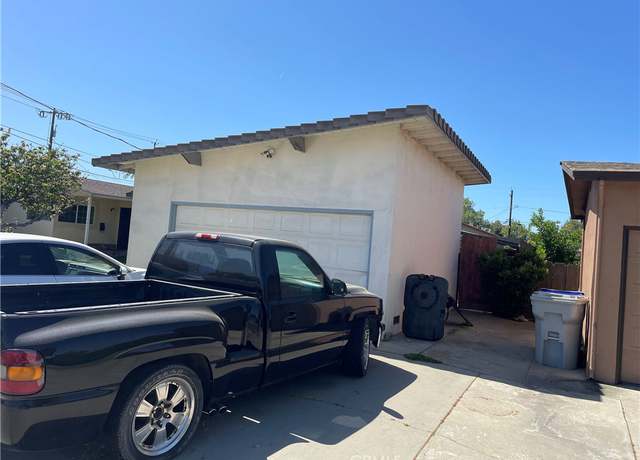
Welcome to 2262 Nebela Drive located in Atwater! This beautiful single story home has so much to offer such as. .. IN-LAW QUARTERS with living room/kitchen, bedroom, and full bath! Yes, you read that correctly. Property also features 4 bedrooms, 3 full baths, approximately 2,257 square feet, spacious living room, kitchen with granite counter tops, stainless steel appliances and pantry closet, Primary Suite with double closets, 2 car attached garage, central heat/air, no neighbor(s) behind backyard, and can't forget, the In-Law Quarters!
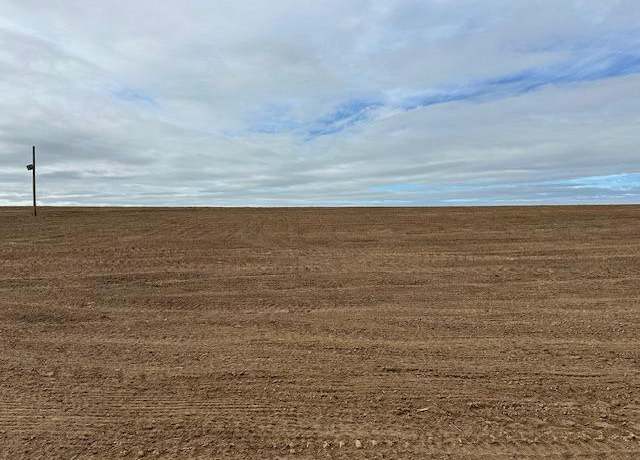
A beautiful custom estate with swimming pool on 67.6 acres of open, irrigated farmland. Located on a quiet country road outside of Atwater, this property has been cared for by the same family since 1974. The land is in Merced Irrigation District and receives water from a dedicated side gate on the adjacent canal. There is a travelling screen and a 4-tank sand media filtration system. An irrigation well supplying a second source of water was developed in 2022. The previous orchard was recently removed and the land has been cleared and prepared for the next owner. Additional improvements include a large solar array and shop. --- Property is in the Williamson Act --- An adjacent property is
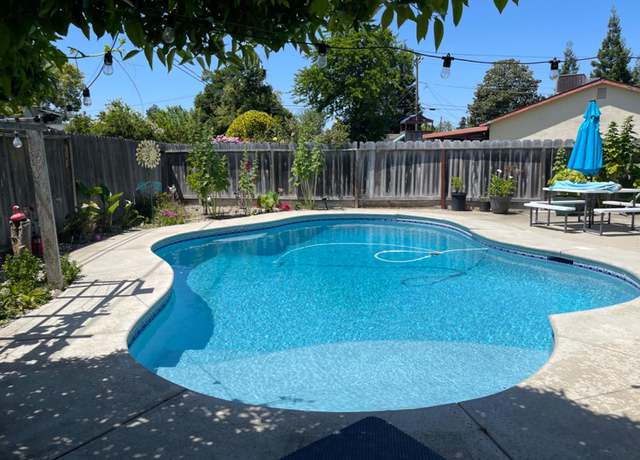
This lovely home features 3 bedrooms and 2 and 1/2 baths with a den on a beautifully landscaped acre that even has a side area that would be great for a garden or 4-H project. Imagine yourself spending time in the beautiful heated pool or in the heated spa with both having separate heaters. The backyard is stunning and beautiful. This magnificent home also features a built in outdoor kitchen with stainless steel insulated cabinets and exhaust hood under a covered patio with skylights and fans. The master bedroom in this home has a see through fireplace between the bedroom and the master bath which has his and her sinks, closets and a jetted tub with separate shower. Home has OWNED solar. AC
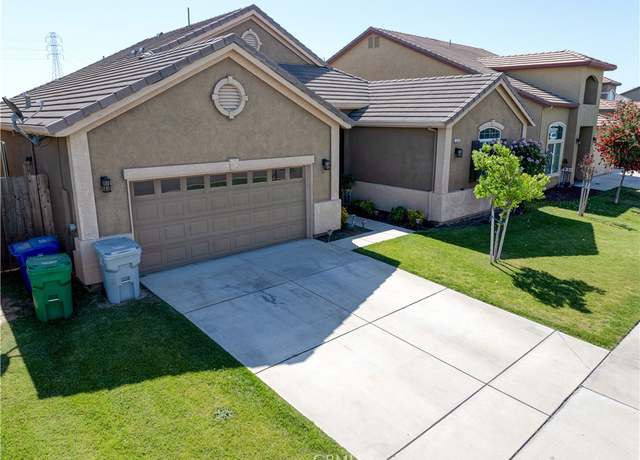
Welcome to this spacious 4-bedroom, 3-bathroom home nestled in the serene community of Atwater, CA, conveniently situated near Buhach Colony High School. Boasting 2,350 square feet of comfortable living space, this residence offers ample room for family gatherings, entertaining guests, or simply enjoying moments of tranquility. The well-appointed kitchen features modern appliances, ample cabinetry, and a convenient breakfast nook. With its blend of comfort, functionality, and location, this property is home sweet home! Schedule your showing today!
Call this cute cottage "Home Sweet Home"! This mobile home is clean & neat as a pin. Attached, there's a one-car carport. The Kitchen has ample space with formica countertops and gas stove/oven. There's a water purification unit under the kitchen sink, dual pane windows, central heat and air conditioning unit. The bathroom has a tub/shower combo unit & additional storage for towels and sheets etc. . Exterior "concrete" type siding w/ 50 year guarantee, double insulated. The refrigerator can stay with the home. Lawn sprinklers are in the front and side of the home. Must see to appreciate.
Nestled on a sprawling lot in the highly coveted neighborhood of McSwain, this enchanting 4-bedroom, 2-bathroom home offers over 2,200 sqft of living space. Adorned with Tudor windows, each room is bathed in natural light, adding timeless charm to the home. A private horseshoe driveway leads to the main entrance, while lush landscaping frames the property, creating a serene ambiance. The backyard oasis boasts a shimmering pool and inviting jacuzzi, perfect for relaxation and entertaining. This home also features an accessory dwelling unit (ADU), ideal for guests or as a rental opportunity. Plus, with a new A/C unit installed last summer, you'll stay cool and comfortable year-round. This dis
LOOK, NO FURTHER THIS IT IS!!!! COUNTRY LIVING AT ITS BEST AND AFFORDABLE. MCSWAIN SCHOOL, FULLY REMODELED WITH NEW APPLIANCES, LARGE DINING AREA, HUGE KITCHEN ISLAND, LARGE OVERRSIZED DECK 40X20, NEW HEAT AND A/C UNIT, BATHROOMS ARE EXQUISITE, ALL NEW WINDOWS, NEW FLOOEING THROUGHOUT, FOUR FRENCH DOORS, NEW FIREPIT, READY FOR ANY AND ALL HOBBIES, HORSES, GO-KARTS, PLENTY OF ROOM FOR A SHOP, RV AND BOAT PARKING, TWO LARGE DRIVEWAY ACCESSES TO BACK OF PROPERTY.
Come and check out this charming home on a very large corner lot in a well-established neighborhood! It is a great opportunity for the first time home buyer! A very nice, 2-bedroom, 2-bathroom home that is located close to shopping and an elementary school. There is a nice size Livingroom as well as a nice open kitchen. Each bedroom is roomy, and the master bedroom has a nice size walk in closet. There are ceiling fans throughout the home and brand new AC recently installed. There is also a nice, covered patio. The property also features a large backyard which is nice for a family BBQ or for the kids to safely play. The home also features a finished 2 car garage with recessed lighting. Th
Don't miss out on your opportunity to be the new owner of this beautiful single story home! Nestled in the city of Atwater, this delightful home shines with comfort, space, and serenity. Situated on a generous . 24 acre lot, this home offers the perfect blend of indoor and outdoor living. This residence boasts four bedrooms, each offering comfort and retreat. Step through the front door to the heart of the home, which lies in its separate living and family areas, with a beautiful brick fireplace and plank vinyl floors. Adjacent to the living space is a beautifully remodeled kitchen, complete with stainless steel appliances and ample cabinetry. A large glass door leads from the family room t
This home features 3 bedrooms and 2 baths. A LARGE, gorgeous lot with RV ACCESS! Open concept living area perfect for entertaining. Vaulted ceilings allow for a spacious feel. An updated and modern kitchen with stainless steel appliances and granite counter tops. The home sits on almost a . 25 acre!! This home is near downtown for easy access to shops and near the 99 Freeway for easy commuting.
Desirable McSwain area. 3 Houses on 2.9 acres total. Main house has wood floors, custom built kitchen cabinets, granite counters and custom shelving throughout the house. Guest house is complete with a kitchenette. The third dwelling was used as a recreation facility complete with kitchen and bathrooms. There is also a work shop and a separate office. Wine making room complete with a climate control settings and temperature controlled walk in closet. This property has over 50 varieties of citrus fruit trees. Solar panels are owned. Septic tank has been well maintained and water well has new pump. Must see to appreciate.
CALLING ALL BUYER'S. .. . This is the home you need to view and be ready to make an offer. Beautiful 5 bedroom/ 4 bath home; two bedrooms downstairs with two full bathrooms. It's in a quiet cul de sac, near schools, parks and shopping.
Welcome to 754 Kadota Ave, Atwater, CAyour next home in a prime location. This 1,515 sq. ft. property features three bedrooms, two bathrooms, and a spacious layout perfect for family living. The highlight is the large backyard with RV access, ideal for outdoor enthusiasts or those seeking extra space. Strategically located minutes from the 99 freeway, this home offers easy access to Rancho Del Rey Golf Club, local shopping centers, and Atwater High. It combines the convenience of city living with the peace of a residential neighborhood. Discover the comfort and accessibility of living at 754 Kadota Avewhere every convenience is just around the corner.
Welcome to your new home, nestled at the end of a serene cul-de-sac with the prestigious Rancho Del Rey Golf Course at the end of the street. This beautiful residence offers a perfect blend of comfort, space, and convenience! As you step inside, you'll be greeted by a sense of grandeur with a separate formal dining area and living room, perfect for hosting gatherings or enjoying quiet evenings with loved ones. Adjacent to the main living area, discover an office space adorned with elegant columns, providing an ideal setting for work. The heart of the home awaits in the comfortable kitchen. Featuring a stainless steel farm-style sink, a spacious kitchen island, epoxy countertops with stylish
Great Location!!! This 3 bedroom 2 bath would make a GREAT STARTER home or an investment property. Tile flooring throughout; Carpet in the bedrooms; separate family room and a fireplace in the living room.
Stunning Single-Family Home with Spacious Backyard located in a Serene Cul-de-Sac! Stunning 4-bedroom, 2-bathroom, single-family home is a must-see! The tile entrance leads to the large open family room which boasts laminate flooring, high ceilings, and a cozy gas fireplace with tile facia. The kitchen has an open floor plan with tile countertops, lots of cabinets, double sinks, and stainless steel appliances such as a gas stove, microwave, dishwasher, and breakfast bar. The refrigerator is included as well. The nook is open to the kitchen and boasts lots of windows providing natural lighting. Additionally, a formal dining room with vaulted ceilings and laminate flooring. The giant maste
Spacious Single-Family Home with Expansive lot! Welcome to your new home! This spacious single-family house boasts an open floor plan with 03 bedrooms, 2 bathrooms, and an attached garage for 02 cars. The living room offers an open floor plan with natural lighting and is complete with a red brick fireplace. The kitchen features an open layout with plenty of cabinets, granite countertops, a stainless steel gas stove and microwave, and tiled floors. Additionally, there is a formal dining area with tile flooring. The bedrooms feature Pergo floors and closet space for each. The bathroom features a tub/shower combo, a single sink, and tile countertops. The house includes a laundry room as well
Check out this stunning ranchette! This spacious 4-bed, 3-bath home boasts two master suites, perfect for guests or multi-generational living. Enjoy ample space for all your toys in the 1500 sqft shop, equipped with solar panels for eco-friendly energy. Pamper your furry friends with the convenient dog washing station. With room to roam and luxurious amenities, this property offers the ideal blend of comfort and convenience.
Welcome to your spacious 4-bedroom, 2-bathroom sanctuary nestled in a tranquil Atwater neighborhood. This inviting home boasts ample living space and modern amenities, perfect for accommodating families or those who love to entertain. Conveniently located near schools, parks, and shopping centers, this home offers the perfect blend of comfort and convenience. With its spacious layout and modern amenities, it's ready to welcome you home to a life of comfort and contentment.
Look no further! This beautifully remodeled home is nestled in the sought-after Falcon Heights neighborhood, conveniently close to churches, groceries, shopping, dining, and Atwater High School. It boasts a vast 13,475 square foot lot—over a third of an acre within city limits—offering ample backyard possibilities like an ADU, pool, garden, or children's play area. The interior features fresh paint, laminate floors, plush carpeting, modern light fixtures, and LED lighting, while the exterior has also been recently painted. The kitchen will impress with its new custom cabinets, granite countertops, Maytag appliances, superb lighting, and an undercounter sink. Both bathrooms are e
Welcome to your dream home! Nestled in a serene gated community, this exquisite property boasts 3 bedrooms, 2 baths, with 2-car garage. Boasting a meticulously maintained interior, it's move-in ready, offering effortless living. Enjoy the luxury of a golf course just across the street, perfect for leisurely strolls or a quick round. This is not just a house; it's a lifestyle upgrade waiting for you. Don't miss out on the opportunity to call this beautiful home yours.
$5K SELLER CREDIT AT CLOSING!!!! Seller is motivated to sell!! Gorgeous Home in Bells Crossing Gated Community - D. R. Horton Adams Plan 1513 aSF with a 3 Car Garage. 4 BR x 2 Baths, Large open floor plan, large lot with potential RV Parking. Open kitchen with large island, beautiful tile backsplash detail, walk in pantry and cabinet storage. Dining area off the kitchen and open to the Living Room. Large primary bedroom suite with walk in closet and private bathroom. Large, fenced backyard is a blank canvas to create your own oasis and there is enough room for a pool too. Park/playground in the gated community is walking distance from the home. Close to shopping, restaurants and more a
3 Bedroom, 2 bath home perfect for first time buyers. This home features newer paint and tile flooring throughout. New water heater, gas stove, central heat and air. Custom security doors. Ceiling fans throughout. Huge back yard with bonus room for storage space.
Country living at it's finest. This fully remodeled home is perfect for a large family. The main home is 3 bedroom, 1 bathroom and the apartment is 2 bedroom , 1 bathroom. Total living space is 2,300 Sq Ft. The double lot is more that 12,000 Sq Ft. Plenty of room for work trucks or toy haulers behind the gated entry. Easy freeway access and located between Merced and Atwater. You've got to come and see this gem for yourself !!
This mobile home is waiting for you. It has a large living room, a kitchen with a good-sized dining area, two bedrooms, and two bathrooms. The master bedroom has a lovely sitting room, making this area spacious for you to enjoy. The fenced-in yard is large, with a shed that will stay and a covered carport. The cabinets were replaced in the kitchen a few years ago. There is an indoor laundry room. The home has a lot of storage and is more expansive than most single mobile homes. The park offers a pool and is dog-friendly.
Fully renovated home! Come see this beautiful 2 bedroom, 1 bath 768 sqft property located in the Rancho Grande Mobile Home Park. Enjoy the open floor plan in the kitchen and living room featuring brand new countertops and stove. The living room is the perfect place for hosting friends with beautiful double paned windows and brand new vinyl flooring throughout the home. The spacious bathroom features a gorgeous vanity, new tile flooring, new mirror, and a new shower. In the bedrooms you’ll find brand new lush, padded carpet. This home also includes a charming backyard area with plenty of shade, trees, and greenery. You’ll also find a handy storage shed perfect for anything you ma
WELCOME TO ASPENWOOD, an FGCHome. Situated in Atwater, this custom home is on a 10,000+ sqft lot. The spacious open concept 4 bedroom 3 bath floor plan features its own private guest suite, a spacious living room with 11 ft high ceilings, a gas-burning fireplace leading out to covered patios, and a master suite complete with rain shower and freestanding tub. The designer kitchen offers stainless steel appliances, a large kitchen island and a spacious pantry. Buyers have options on interior color schemes for homes early in the construction process, so come view this FGCHome today! Buyers have the option to lease or purchase solar system before close of escrow.
Great 4 bedroom, 2 bath home ready for a new owner! Located on a large corner lot across the street from Juniper Elementary and minutes from freeway 99. This spacious home features a formal living room, separate family room, open room concept with kitchen overlooking the family room, granite kitchen counters, ceiling fans throughout, and spacious backyard with patio cover. Don't miss out on this turnkey home!
Resort styly living in this large, well-maintained executive home with over 5000 sq ft and many custom features. Spacious gourmet kitchen with granite countertops and stainless steel appliances. The family room is open to the kitchen and great for entertaining guests. This home also offers a formal dining room with tile flooring and a custom built-china cabinet. Additionally, the backyard was designed for entertainment and includes a large pool, tennis court and outdoor kitchen area and a very large open, grassy area.
Tucked away in a quiet cul de sac, this four bedroom, two-and-a-half bath home is ready for its new owners. The formal dining room or living room upon entry is a perfect space for quiet conversations, family dinners or game-nights! The kitchen is open to a second living space where quiet nights next to the fireplace can be enjoyed. The space is adjacent to the sliding door leading out to the backyard, which is perfect for summer parties or serene nights under the stars. All four bedrooms and two full bathrooms are upstairs, which is a perfect separation of spaces. A half-bath is located downstairs for easy access. This property is in walking distance to shopping and restaurants (Commerce) a
Welcome to 9470 Sunset Drive, Atwater – the epitome of family-friendly ranch living! This charming ranchette sprawls across 3.5 acres of country living. The 2,840 sq ft home boasts 3 bedrooms and 2 bathrooms, providing ample space for your family to grow and thrive. As you step onto the property, you'll be greeted by the tranquil ambiance of mature walnut trees that surround the estate, casting dappled shade over the well-maintained grounds. A fenced area awaits for those with a passion for animals or 4-H projects, providing a secure space for your furry friend. The property comes complete with a tool shed and workshop, offering the perfect haven for any DIY enthusiast or hobbyist. Fo
Looking for your forever home? Look no further than this beautiful executive home with exquisite details. Nestled into a gated community, this home features 4 bedrooms and 2.5 baths, open concept living space, grand kitchen with eat in dining area, bonus room, Jack and Jill bath, walk in closets, 4 car garage and much more, all on a one-acre lot in the city limits of Atwater. Home has many energy efficient amenities including solar and MID power. Schedule a showing today and picture this home as your next.
This cozy residence situated in the desirable community of Rancho Grande. With over thirteen hundred square feet this mobile home offers plenty of space. It was renovated two years ago with laminate flooring throughout , updated kitchen. Plus updated restrooms. Definitely a must see .
Charming well cared for home with a great floor plan. This home features 3 bed 2 full baths with just over 1500 sqft. , separate living room and family rooms, a brick fireplace with gas insert, large 2 car garage, a good size back yard with shed included. This is a great starter home and don't forget to ask about possible down payment assistance programs!
Here is a stunning, immaculate house located in a nice and well established neighborhood. This 3 Bed, 2 bath home, offers over 1,700 Sq Ft of living space with a large hight voluted Great Room. The kitchen, dining and living rooms with its great open floor plan is the perfect space for entertaining . The living room is warmed up by a beautiful brick fireplace. This home sits on a large corner lot with incredible landscaping. In this beautiful home, please find its 2 and half car garage and plenty of street parking. Lets not forget the crystal clear water swimming pool and a new fully paid off 15 panel Solar system. This home is nicely located within walking distance to an Elementary and Hig
This area's enrollment policy is not based solely on geography. Please check the school district website for more information.
Elementary schools
Middle schools
High schools
GreatSchools Summary Rating
8/10
Elmer Wood Elementary School
Public, K-6
7/10
Peggy Heller Elementary School
Public, K-8
6/10
Bellevue Elementary School
Public, K-6
6/10
Thomas Olaeta Elementary School
Public, K-6
6/10
Shaffer Elementary School
Public, K-6
Only showing 5 of
7 elementary schools.
School data is provided by GreatSchools, a nonprofit organization. Redfin recommends buyers and renters use GreatSchools information and ratings as a first step, and conduct their own investigation to determine their desired schools or school districts, including by contacting and visiting the schools themselves.Redfin does not endorse or guarantee this information. School service boundaries are intended to be used as a reference only; they may change and are not guaranteed to be accurate. To verify school enrollment eligibility, contact the school district directly.
Atwater, California boasts a well-connected transportation network, with a variety of options for residents. The city experiences moderate traffic levels, making driving by car a convenient mode of transport for most. Public transportation is available in Atwater, offering an alternative for those who prefer not to drive. Additionally, Atwater is conveniently located near major highways and freeways, further enhancing its connectivity and ease of travel.
What types of properties are available in Atwater?
Atwater, California offers a variety of single-family home types, including ranch-style homes, contemporary homes, and modern homes, among others. These homes can be found throughout the city, with some located in established neighborhoods and others in newer developments. Most properties feature multiple bedrooms and were built in various years. To explore different property types for sale in Atwater, California, use the 'Home type' filter located above the active listings. Customize your search by selecting options like single-family homes, condos, townhomes, and more.
What is life like in Atwater?
Living in Atwater, California offers a unique experience with its picturesque landscape, featuring rolling hills, lush farmlands, and scenic views. The weather in Atwater is characterized by mild winters and hot summers, making it an ideal location for outdoor enthusiasts. The city provides a range of job opportunities across various industries, including agriculture, manufacturing, and retail. Residents can enjoy a variety of recreational activities, such as hiking, biking, and exploring local parks. Atwater also boasts a vibrant community with numerous cultural events, festivals, and local markets, providing ample opportunities for residents to engage and connect with their neighbors.
What are the schools and amenities like in Atwater?
Atwater, California offers a variety of public amenities for its residents. The city boasts a selection of restaurants, providing a range of culinary experiences. Parks are also available, offering open spaces for relaxation and recreation. Grocery stores are conveniently located within the city, ensuring easy access to daily essentials. Additionally, the city provides other amenities such as schools, libraries, and healthcare facilities, enhancing the quality of life for Atwater residents.
In the past month, 33 homes have been sold in Atwater. In addition to houses in Atwater, there was also 1 condo, 0 townhouses, and 2 multi-family units for sale in Atwater last month. Atwater is a minimally walkable city in Merced County with a Walk Score of 41. Atwater is home to approximately 27,435 people and 4,568 jobs. Find your dream home in Atwater using the tools above. Use filters to narrow your search by price, square feet, beds, and baths to find homes that fit your criteria. Our top-rated real estate agents in Atwater are local experts and are ready to answer your questions about properties, neighborhoods, schools, and the newest listings for sale in Atwater. Our Atwater real estate stats and trends will give you more information about home buying and selling trends in Atwater. If you're looking to sell your home in the Atwater area, our listing agents can help you get the best price. Redfin is redefining real estate and the home buying process in Atwater with industry-leading technology, full-service agents, and lower fees that provide a better value for Redfin buyers and sellers.


 REDFIN IS COMMITTED TO AND ABIDES BY THE FAIR HOUSING ACT AND EQUAL OPPORTUNITY ACT. READ REDFIN'S FAIR HOUSING POLICY AND THE NEW YORK STATE FAIR HOUSING NOTICE.
 United States
 Canada