This luxury townhome is an end unit and in a private alcove of 6 homes. Exquisitely renovated throughout with top of the line everything! Featuring a large patio off the kitchen and second outdoor space off the living room area! Attached 2 car garage leads you up to the main level and hosting all living spaces and guest bath. The kitchen is to die for, with marble counters, stainless steel appliances, custom backsplash, custom cabinets, farmhouse sink, & perfect lighting. Kitchen is open to a breakfast nook & expands out to the front deck. Notice the upgraded hardwood flooring throughout! Large greatroom style living & dining room with brick fireplace, perfect amount of nat
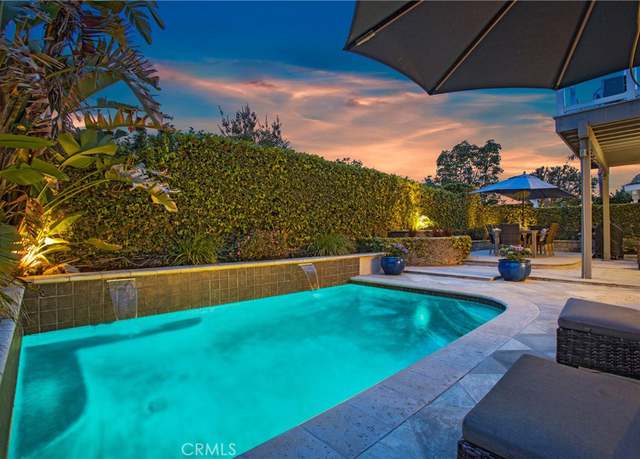
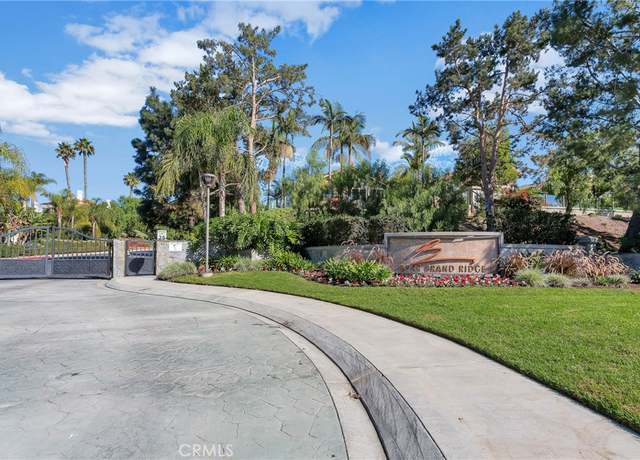
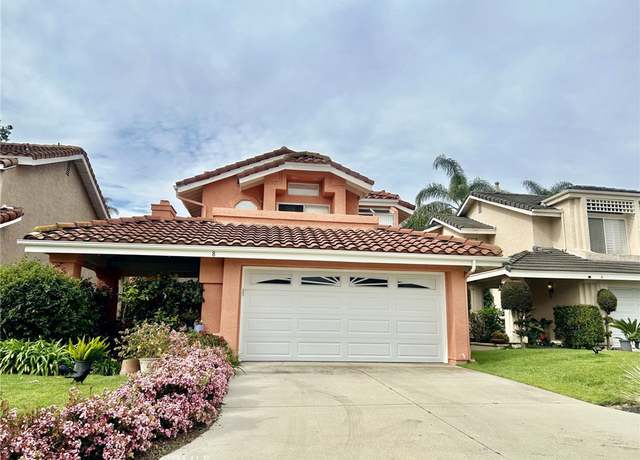
OCEAN VIEWS FROM THE HIGHEST CUL DE SAC STREET IN GATED BEAR BRAND RIDGE. This is a stunning 5 bedroom home (with one on the main floor with double doors) and one that is an oversized/bonus room that can be used as a versatile bedroom, upstairs family room, office, gym or study room. Countless upgrades in every room including California Classics wood flooring, full PEX repipe, and new interior doors. Cathedral ceilings in the formal living & dining rooms. Spacious upgraded kitchen w/ granite counter tops, new light fixtures, & lots of natural light which opens up to the kitchen nook with door out to backyard. The yard has a pool plus ample space for dining al fresco. The kitchen
Welcome to your new home! Feel like picking new paint for your new home's exterior? The seller thought this was an approved color, but the HOA said no. The seller is providing a $25,000 credit toward a new coat of paint and other upgrades you might want inside. This is a wonderful three-bedroom, 3-bath home with a remodeled kitchen, two ensuite bedrooms upstairs and a one bedroom downstairs with a hallway bathroom and a walk-in shower! A perfect fit for just about everyone. It needs some work, but you have the sellers money to do things. Enjoy the large, spacious great room as you enter with plenty of light and cathedral ceilings, This home does not back to other homes. You get added lig
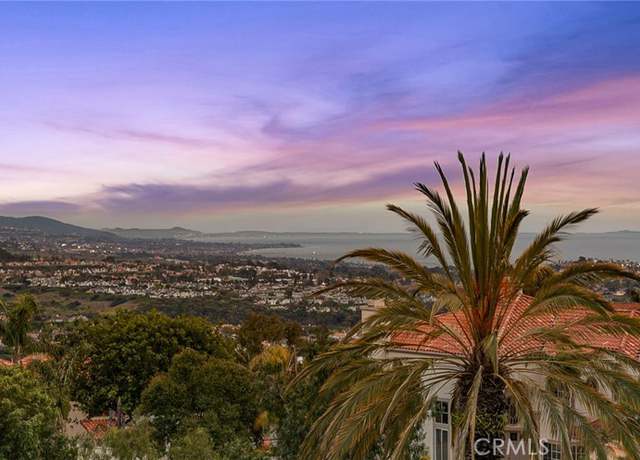
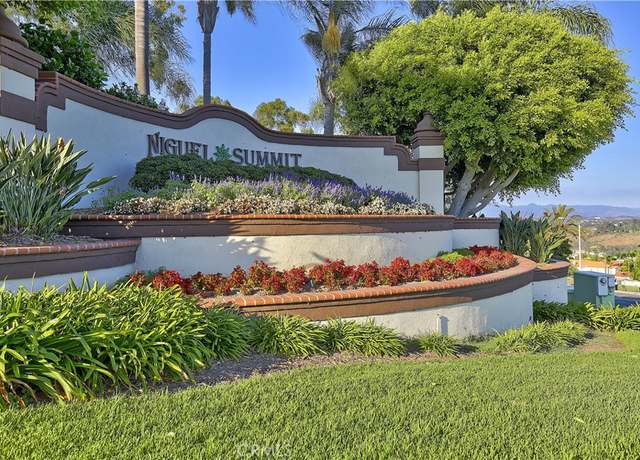
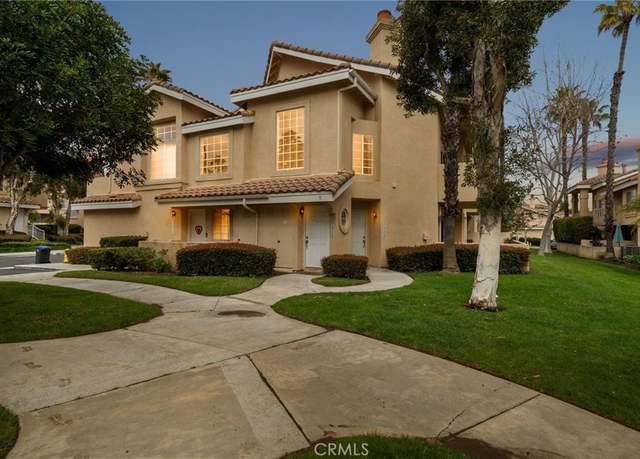
Immerse yourself in this captivating Ocean View Estate at the end of a private cul-de-sac—a rare jewel nestled within the sought-after Belle Maison enclave of Niguel Summit. This beautiful Mediterranean home offers a flowing, open floorplan vibrantly imbued with natural sunlight, surrounded by various garden spaces planted with Fig, Pomegranate, Lemon, Apricot, and Plum trees, paired with breath-taking panoramic views of the magnificent Pacific Ocean lapping away at shimmering city lights, Tuscan-like rolling hills, and majestic mountains cascading upon the vast horizon; sights that immediately enchant you upon first stepping through the homes ornamental French doors. Its simple, yet
Welcome to your dream home at 27914 Via Janeiro, Laguna Niguel, CA. This luxury resort-style townhome in the beautiful community of DEL PRADO offers a modern and elegant living experience just minutes from Salt Creek and South Laguna. Step into this 3-bedroom, 2-bathroom home, boasting 1702 square feet of magnificent living space. Upon entry, you'll be greeted by a dream open floor plan with highly desirable soaring vaulted ceilings that add a touch of elegance to the space. The main suite features a spacious layout, a soaking tub for relaxing candlelight baths, a walk-in closet, dual sinks, and its own deck. The chef's kitchen is a culinary delight, offering ample cabinet space and upgrade
Welcome to this "BEAUTIFUL" Family Neighborhood. .Loaded with "CHARM And CHARACTER" Lots of Trees in the area. . Single Story Home . .Walk up to a Private Courtyard, open the door into a LOVELY open Floor Plan. .Living Room, Vaulted Ceilings, Formal Dining Room and Fireplace, Gourmet Remodeled Kitchen, Den off the Kitchen area. . Main Level Owners Suite, with Private Bathroom. .Originally a 4 Bedroom home. .2 Bedrooms were converted to one Large Bedroom, Great for a Teenager. .This bedroom also has Vaulted Ceilings. 3 Sliding Glass Doors, off Kitchen/Den, Living Room and Owners Suite. .. looking onto a Large Back Yard and Patio area. .. .This home has lots of Windows a
Nestled within the coveted community of Laguna Niguel, 24702 Queens Court beckons with its timeless elegance and unparalleled comfort. This stunning residence, situated on a tranquil cul-de-sac, offers a sanctuary of luxury living amidst Southern California's coastal splendor. Step inside this meticulously-crafted and cared for home and be greeted by a seamless blend of comfort and style. With four bedrooms, three bathrooms, and just under 3,000 square feet of living space, every corner of this residence exudes warmth and sophistication. Brand new luxury vinyl flooring and brand new carpet lay out the highly-desirable floor plan, with fresh paint and many new fixtures also just being comple
Vintage coastal charm abounds in this Laguna Niguel ranch-style gem! Perched on a bluff affording panoramic views and light ocean breezes, this single-story pool home offers nostalgic elegance coupled with modern upgrades. You’ll love its eminently livable open floorplan situated to maximize views, and the freshly painted, warm neutral palette throughout that’s ready and waiting for you. Reclaimed antique built-ins create unique accents and add to the home’s distinctive allure. Authentic hardwood floors throughout speak of comfort and quiet luxury. Juxtaposed are modern efficiencies: new owned solar, new roof, new tankless water heater, whole-house water filtration, full P
Nestled in the welcoming community of Niguel Hills in Laguna Niguel, this charming single-story home offers three bedrooms and two baths on a spacious 9,000 square foot lot tucked away in a peaceful cul-de-sac. Step through the inviting double doors and into a comfortable open floorplan, featuring a remodeled kitchen and a cozy family room with a fireplace—perfect for relaxed gatherings. The kitchen boasts ample counter space and cabinetry, along with a generous eating area ideal for enjoying meals with guests. The bathrooms have been tastefully updated, adding a touch of modern elegance to the home. Outside, you'll find your own private outdoor retreat, complete with a relaxing spa&m
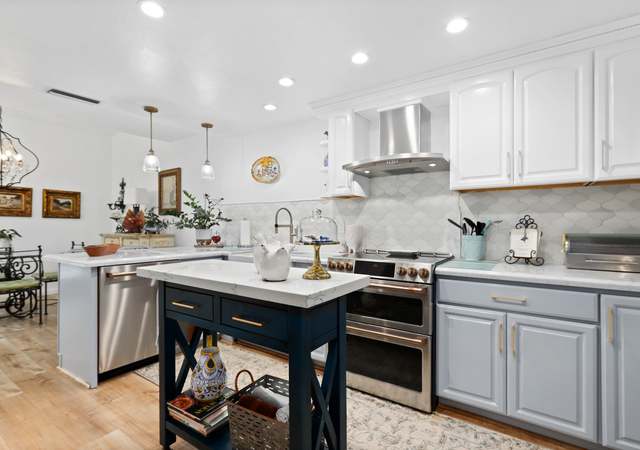
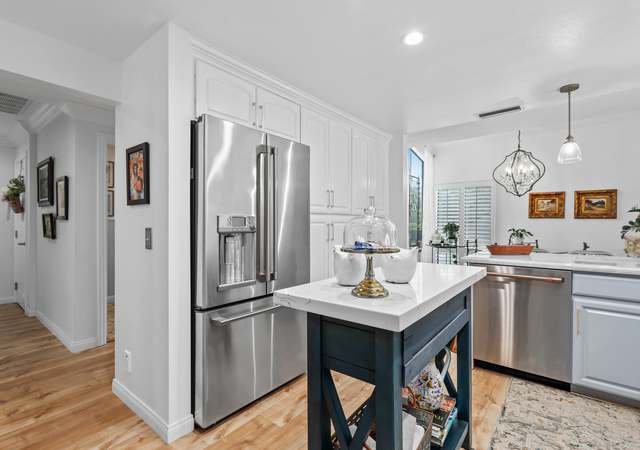
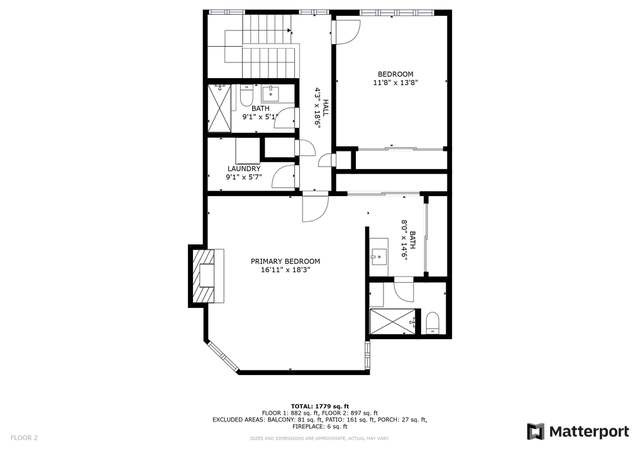
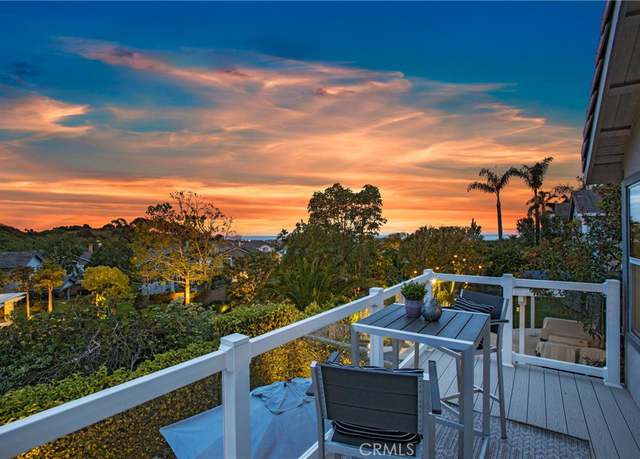
SINGLE-LEVEL home, with a VIEW. .. This remodeled TURNKEY residence is ready for you. It sits on a single-loaded street with no homes directly behind, offering spectacular sunsets and a beautiful city lights view from the backyard, main living area, and primary bedroom. The kitchen is remodeled and features a cute breakfast nook which gets perfect morning sun. From the main living area you can see the great view while seated at the dining room or on the couch. Two additional bedrooms share a hallway bathroom. There is direct access to the 2-car garage with a built-in tool bench and plenty of storage. Completing the interior is a spacious primary bedroom with remodeled en-suite bathroom. The
Be ready to fall in love with this gorgeous townhome in the sought-after community of Village Niguel Gardens. This 1,419 square foot residence features 3 spacious bedrooms, 2.5 baths and direct-access 2-car garage along with fantastic west-facing views! The open living area feels spacious and bright, with soaring ceilings and statement windows that fill the space with natural light. Beautiful wide-plank, wood-look flooring adds to the contemporary look, and the living room fireplace offers a cozy spot for friends to gather. Prepare unforgettable meals in a kitchen where stunning quartz countertops contrast with fresh white cabinetry for a sleek, modern appeal. Your glassware will sparkle in
Tucked away on a lovely single loaded street, this immaculate pride of ownership home offers not only privacy, peace and quiet, but also greets you with spectacular views from the first moment of entering the home. The very generous square footage, an abundance of natural light, high ceilings, freshly painted white walls, and a dual sided staircase offer a dramatic sense of space and as well as a blank palette to make it your own. Dual sided fireplaces between the living room and dining room and between the upstairs office retreat and primary bedroom, as well as one in the family room offer a sense of warmth and comfort as well. The flexible floor plan offers 4 rooms upstairs. The spacious
Rancho Niguel at it's finest! Enjoy the July 4th fireworks from your backyard! Luxuriously upgraded 4 bedroom, 3 bath home with breathtaking views and walking distance to the prestigious "Rancho Niguel Club", trails and Laguna Niguel Regional Park. Open and spacious floor plan with 1 bedroom and bath down. 3 bedrooms up with custom built in Mahogany cabinets in the study that's perfect for a kids study area. The kitchen has been remodeled with cherry cabinets and granite counter tops and all bathrooms have been remodeled as well. Re-piped with PEX, newer dual pane windows on all West facing windows and doors. Designer lighting throughout, upgraded baseboards and moldings, Master b
Adorable Cape Cod home in the coveted and rarely available neighborhood of Concord Hill. Situated on the bluffs overlooking San Juan and convenient to all Marina Hills activity this 3BR, 2BA, 1,547 sqft home offers an inviting and open living concept with tons of light and good yard space. Inside the home you will find real hardwood floors, granite counters, a gas fireplace, a 48& quot; Viking oven, tiled bathrooms and raised ceiling in the living area. This single level floorpan has the master bedroom opening to the private backyard and the third bedroom has exterior access to the side patio. The master bath features dual vanities and a walk-in shower as well as private toilet while th
Amazing corner lot opportunity in the great neighborhood of Marina Hills. Remodeled single-story 3-bedroom, 2-bathroom home located in the beautifully landscaped and quiet street in Laguna Niguel. Upon entry, you are welcomed by an open floor plan consisting of a fully upgraded kitchen with brand new white cabinets and gorgeous countertops/backsplash, new stainless steel appliances and lighting next to an open kitchen nook with plenty of cabinets, a bright dining area with plenty of natural light, a large living room with vaulted ceilings and a fireplace in the center. The floor is covered in glamorous ceramic tiles throughout most of the house. Double doors lead to a spacious primary bedro
Experience the charm of Laguna Niguel in this beautifully updated 2-bedroom, 2-bath turn-key home, nestled within the highly sought-after Crystal Cay community. Upon entering, you’ll immediately notice the open-concept living room, complemented by a welcoming fireplace and a direct view of your stunning kitchen. The modern kitchen features a peninsula design with a quartz waterfall countertop, soft-close cabinets, an expanded pantry, Carrara marble tile backsplash, and stainless steel appliances. Moving down the hallway, you'll find a convenient laundry closet w/ stacked washer and dryer, the updated guest bathroom, and both bedrooms. The primary suite offers plenty of space, an updat
Inside and out, night or day this home makes a strong statement with a unique floor plan that offers 2 bedrooms on the main floor and a full bath. One of the main floor bedrooms makes an ideal space that can be used as a flex space, gym, office or play area. . The moment the front door opens the upgrades and the attention to detail cannot be missed. Cathedral Ceilings bring in the natural light over the lovely wood floors, raised baseboards, accents through the entire home. Amazing kitchen with gorgeous cabinets, highlighted by the large counter bar with Cambria Quartz. Appliances, fixtures, faucets have all been upgraded. The home has 2 fireplaces located in the family room and living ro
Absolutely gorgeous Mediterranean-style cul-de-sac home offers an open and airy floor plan with magnificent vaulted ceilings and windows galore! So light and bright! Travertine floors downstairs, carpet upstairs. Main floor bedroom and full bath. This is a true four bedroom PLUS a spacious LOFT with bright windows. Large kitchen features granite counters, travertine backsplash, island, and loads of cabinets. Beautiful breakfast nook with large window and view of the garden! Brand new top of the line stove, dishwasher and microwave installed this week! Elegant living and dining rooms, with wet bar, and well-appointed fireplace in family room. Separate laundry area downstairs. Oversized maste
Nestled within the prestigious Bear Brand Ranch, an exclusive 24/7 gated community, this exceptional 5-bedroom, 6-bathroom custom estate epitomizes a seamless fusion of luxury and functionality. Recently refreshed, this home was part of the newer construction in the development and exudes a meticulous attention to detail and offers captivating open living spaces, perfect for upscale entertaining. The grand foyer, adorned with unique wall treatments, sets a tone of sophistication, while the gourmet kitchen, lavish primary suite, spacious family room, and private elevator reflect a dedication to quality and refined living seen throughout the residence. Step out to the backyard and arrive at y
Discover this elegant BEACON HILL home offering 3 bedrooms, 2.5 baths, and a chef's kitchen featuring Viking appliances and expansive breakfast bar. Inside, you’ll find sophisticated details at every turn with wood floors, granite countertops, French doors, and stone fireplace. The primary bedroom boasts vaulted ceilings, a walk-in closet, and ensuite bathroom with dual sinks and jetted tub. Two spacious secondary bedrooms share a hall bathroom with tiled wainscoting and pedestal sink. The expansive outdoor patio is perfect for dining, while the private side yard off the kitchen is ideal for barbecuing or enjoying morning coffee. Recent improvements include a new roof installed in 202
Perched high atop a lush canyon bluff, this luxurious designer home offers an unparalleled blend of elegance, tranquility, and breathtaking panoramic ocean views. The premier front row location is ideally situated on the end of a cul-de-sac in the exclusive guard gated enclave of Laguna Sur, overlooking picturesque coastline vistas out to Catalina Island and beyond. The custom etched glass double-door entry leads into the grand foyer with soaring ceilings, wrought iron stairway, & marble flooring; all illuminated by a dramatic skylight. The home encompasses three levels of refined living space, each with ocean views and meticulous attention to detail throughout such as crown moldings,
Location, location, location! What a find! Welcome to the beach life! This home simply has it all! The 1st level offers a step-down kitchen, indoor laundry room with European-made cabinets, fully remodeled powder room with high-end German and Italian fixtures, the office featuring Swedish-made/engineered walnut flooring. Both living room and dining room are light and bright. The living room offers a warm and inviting fireplace for those cooler nights to keep you warm and cozy. There are two completely remodeled bedrooms on the 2nd level. Upon entering the 2nd level, you will step onto beautiful, 100% wool carpeting which is also on the stairs and landing. You will love both the Master Bedro
Silvertide at Bear Brand Condo beckons ~ Privately-situated two story end unit w/ 3 bedrooms and 2 bathrooms ~ Beautifully landscaped walk-up to entry w/ an ocean backdrop ~ Thoughtful and contemporary upgrades throughout ~ Luxury vinyl planks ~ Open floor plan ~ Bright, airy and spacious living room w/ vaulted ceilings, tons of windows & cozy fireplace ~ Functional kitchen w/ large garden window over single basin sink, white cabinetry, Quartz counters & Venetian herringbone splash ~ Downstair bedroom w/ full, remodeled bathroom ~ Primary bedroom features two closets, large vanity & private showering quarters ~ Jack and Jill style room is perfect for office, nursery or 3rd
Welcome Home to this beautiful fully remodeled 2 bedroom, 2 bath townhome located in Marina Hills, in the Encore development. This unit is spacious and feels very light and bright and has high ceilings. It has a great layout and you will love all the updates! This home features 2 balconies- one off the kitchen and the other off both of the bedrooms. Also has new flooring, new fireplace, new double pane windows, re-piped with PEX, and many more upgrades. You will absolutely love the remodeled bathrooms as well! This townhouse feels like home and is move in ready. Marina Hills is a highly sought after community. There are two association pool and spas. One set is located within the Encore com
Nestled in the coveted 24-hour guard-gated community of Ocean Ranch, this semi-custom 5-bedroom plus bonus room residence offers a luxurious coastal lifestyle, adorned with grand curb appeal, including two majestic palm trees, and boasting breathtaking panoramic views. Sitting on an expansive 13,835 Sq. Ft. lot, it stands out with a rare 4-car garage and parking for 6 additional cars in the driveway. The foyer welcomes you with double-height ceilings in the living and dining areas, creating an airy, open-concept space. A versatile room on the main floor, with a full bathroom, adds flexibility for use as an office or a bedroom. The gourmet kitchen features elegant granite countertops, a cent
Nestled in the heart of Laguna Niguel’s prestigious guard-gated community of Hillcrest Estates, this stunning residence offers the finest of luxury living! It is 3-houses away from Wood Canyon with access to a park which provides breathtaking panoramic views of the Canyon, city lights, hills and mountains. This home features an open floor plan with approximately 3352 square feet, 4 bedrooms plus a loft, 3 baths, an office, an attached large deck and a 3-car garage. As you enter through the front door you’re greeted by 20-foot soaring ceilings, formal living and dining area with exquisite upgrades throughout. The spacious chef’s gourmet kitchen has been completely remodeled
Nestled in the prestigious San Joaquin Hills guard-gated community, this home offers luxury and functionality in equal measure. With travertine flooring and elegant shutters throughout, the main level features an office that can be converted into a bedroom with a full bathroom, perfect for guests or multigenerational living. The kitchen boasts new Frigidaire appliances and neighborhood views extending into the family room. The master suite provides a private retreat with an ensuite bathroom, additional 3 bedrooms upstairs. Practical amenities include a laundry room and central vacuum. Experience Southern California living at its finest in this serene sanctuary. SJH Community offers 2 Resort
Home is located in a desirable City of Laguna Niguel. 5BR+Retreat room /4BA, Pool (w/ safety fencing) & Spa, 2 Story House, 3,653 sq. ft. , 6,480sq. ft Lot, Solar system. Year Built 1981. A few miles to Laguna Niguel Lake, Shopping malls, Golf course and to access I-5 exit. Views from back yard. Capistrano Unified School District.
Incredible opportunity to live in this move-in ready 3 bedroom PLUS loft beauty in the Del Prado community. This corner unit offers everything you are wanting in your next home-over 1700 square feet of light and bright living space, an open floorplan, two-story ceilings, an attached 2-car garage and the list goes on. You will appreciate the fresh paint and new flooring throughout along with the perfect finishes. All the bedrooms are on the main living level making this almost like single level living. The living room and primary bedroom have private balconies for natural light and to enjoy the weather and beauty that we love. The two secondary bedrooms are generous in size while the loft co
Beautiful quiet 1 bedroom, 1 bathroom upper end unit condo with a 1-car garage that overlooks a greenbelt in the Milano community of Laguna Niguel. Recent updates include, new waterproof flooring and new baseboards throughout Kitchen has new quartz counters and single vessel sink with new faucet, cabinet handles and new LED lighting. Bathroom has a new tub/shower, new quartz counter and sink, new faucets, new toilet and new exhaust fan. Newer dual pane windows with new window blinds. Freshly painted interior walls too. Ready to move in and enjoy. The community has been re-piped in PEX and offers a pool, spa small gym and clubhouse and EV charging available. Easy access to both the 5 and the
Welcome to the prestigious neighborhood of Kite hill. This newly renovated gem offers sweeping views of Laguna Niguel's hills and the majestic Saddleback mountains. Step inside to find a haven of luxury, featuring quartz and marble countertops, soft-close cabinets, and designer light fixtures throughout. The chef's kitchen boasts new Bosch appliances, including a wine cooler and a 6-burner gas stove, perfect for gourmet cooking. A spacious pantry and Kohler farm sink add convenience to the culinary experience. Entertain in style in the open-concept main floor, complete with a three-sided fireplace and a large flat-screen TV. Step outside to the extended patio, where you'll find an in-ground
This magnificent home features 2,614 square feet living space with 4 bedrooms and 3 bathrooms boasts breathtaking panoramic ocean views from both levels with NO NEIGHBOR behind in desirable "Niguel Coast" Community. Magnificent formal living room with high ceilings. The entrance invites you to an open and spacious living room/dining area bathed in ambient light, warm tile and wood flooring and curved staircase with cathedral ceilings. A main floor bedroom with attached bath is ideal as a home office or guest room. The kitchen offers newer appliances, pantry, tile backsplash, granite counters and opens to a breakfast nook and family room with fireplace and wet bar. Upstairs is a la
Spectacular! … is an Understatement! Light & Bright Throughout! Panoramic Views from Mountains to the Ocean! Just Remodeled, Pristine Contemporary Residence, Over 5,000sf with Two Double Garages. Unique Custom Exterior Design. Marble Entry w Leaded Glass Dbl Entry Doors Opens to Two Story Living Room. Formal Dining Room is Perfect for Entertaining. Spacious Gourmet Kitchen w Lots of Cabinet Space, Pantry & Breakfast Island adjoins Huge Family Room. Main Floor Bedroom Suite is Downstairs, in addition to a Wet Bar and Large Laundry, Exercise Room, Powder Room and a Private Office. Grand Stairway with Elegant Chandlier & Custom Glass Rail Fencing leads you upstai
Nestled within the exclusive gated community of Bear Brand Ranch in Laguna Niguel, this magnificent estate illustrates luxury living. This stunning property was rebuilt, boasting 10 bedrooms, 11.5 bathrooms, and an estimated 13,500 square feet of living space on a sprawling 1.41-acre lot, Offering the ultimate in privacy and elegance. Upon entry, you are greeted by a grand foyer with soaring ceilings and exquisite custom woodwork throughout, setting the stage for the unparalleled craftsmanship found throughout the home. The spacious living areas are bathed in natural light and feature custom-designed furniture, creating an ambiance of sophistication and comfort. The gourmet kitchen is a che
From the Saddleback Mountains to the coast of San Diego…this totally remodeled, single level, contemporary beauty has 3 bedrooms, 2 full bathrooms plus walls of windows bringing the beautiful outdoors in at every glance. Stepping inside, the modern living space features an open great room and gourmet kitchen with white quartz countertops featuring a waterfall edge, high-end stainless steel appliances and hood, custom wood cabinets, a breakfast bar, a beverage center and too many kitchen enhancements to list. The living area showcases hand-scraped maple floors and a sleek fireplace. Dramatic vaulted ceilings with wood beams, skylights and custom lighting create luxurious surroundings
Discover comfort living in the heart of Laguna Niguel with this stunning 1,041 sq. ft. single-story condo, nestled in the Salt Creek Community which is situated in West Nine. Enjoy the seamless flow of the open floor plan, where the spacious and bright living area is connected to a private patio, a serene spot to enjoy your morning coffee or the evening breeze with dinner outdoors. Adjacent to the living room, the cozy dining area stands ready for entertaining guests. Moreover, this home has a well-designed kitchen, complete with appliances and complemented with granite countertops and plenty of cabinet space for all your culinary essentials. The master bedroom has balcony access ideal for
A pinnacle of California lifestyle: a fully renovated hilltop estate in the prestigious guard-gated enclave of Monarch Point with unobstructed panoramic coastline, Dana Point, Ritz Carlton, and Monarch Bay vistas from every angle. Recently reimagined with top-of-the-line finishes, this home offers a luxurious backdrop for enjoying all Southern California has to offer. The expansive open main area of this residence, anchored by a linear fireplace, is bathed in natural light with the frameless folding glass doors spanning nearly its entire length, seamlessly creating the ultimate in coastal indoor-outdoor living. Composed of multiple gathering spaces, this entertainer's dream includes a sitti
2 BEDROOMS + OFFICE | Welcome home to luxury living with this captivating single-level residence, gracefully perched atop one of Laguna Niguel's highest points. With commanding panoramic views of the breathtaking South Orange County landscape, this gorgeous turnkey home offers an unparalleled backdrop of nature, city lights, majestic Saddleback Mountain and beyond. Discover a world of modern elegance, where every detail of this impeccably upgraded and meticulously remodeled home exudes sophistication, refinement, and functionality. The open and airy floorplan is accentuated by dramatic vaulted ceilings, rich wood floors, and crisp white walls bathed in natural light. The living room seamles
Step into the coastal lifestyle in this extensively remodeled and rare 5-bedroom home nestled on a private corner lot along a single-loaded street in the heart of Laguna Niguel. Boasting a partial golf course view, picturesque city lights, and rolling hills vistas, this tastefully upgraded home epitomizes the California experience. Upon entry, you will be captivated by the striking Brazilian hardwood floors that set the tone for the home's sophisticated ambiance. The expansive entertainer's kitchen beckons with an oversized island with plenty of seating, a professional 6-burner range, and seamless flow into the spacious family room, a perfect hub for gatherings and relaxation. Uniquely desi
This beautifully updated ground-level one-bedroom and one-bath condo is minutes from the OC's most spectacular beaches. The updates include a renovated kitchen with new cabinets, countertops, and appliances. The bathroom has a new vanity and a ceiling fan in the bedroom, as well as new paint, recessed lights, and vinyl floors throughout the unit. Community amenities include a pool and a clubhouse. This condo is conveniently located within walking distance of shops, restaurants, and Laguna Niguel Library. Take advantage of this opportunity.
School data is provided by GreatSchools, a nonprofit organization. Redfin recommends buyers and renters use GreatSchools information and ratings as a first step, and conduct their own investigation to determine their desired schools or school districts, including by contacting and visiting the schools themselves.Redfin does not endorse or guarantee this information. School service boundaries are intended to be used as a reference only; they may change and are not guaranteed to be accurate. To verify school enrollment eligibility, contact the school district directly.
Homes for sale in Laguna Niguel have a median listing price of $1.5M. Some of these homes are Hot Homes, meaning they're likely to sell quickly.
What are some of the most popular neighborhoods in Laguna Niguel?
Popular neighborhoods include South Laguna, Marina Hills, Rancho Niguel, Bear Brand at Laguna Niguel, Nellie Gail Ranch, Three Arch Bay, South Laguna Hills, Dana Hills, and Bear Brand Ranch.
Laguna Niguel, California, offers a variety of transportation options, including a well-structured public transportation system. The city is served by the Orange County Transportation Authority (OCTA) providing bus services for residents. Traffic levels for car travel can vary, but generally, peak hours can see a significant increase in congestion. For those who prefer to drive, Laguna Niguel is conveniently located near major highways such as the I-5 and the 73 Toll Road, making it easily accessible for commuters. Learn more on our Laguna Niguel city guide.
What types of properties are available in Laguna Niguel?
Laguna Niguel, California offers a variety of single-family home types, including ranch-style, contemporary, and Mediterranean-style homes, among others, with options ranging from 2 to 6 bedrooms and varying year built. To explore different property types for sale in Laguna Niguel, California, use the 'Home type' filter located above the active listings. Customize your search by selecting options like single-family homes, condos, townhomes, and more.
What is life like in Laguna Niguel?
Laguna Niguel, California offers a serene living experience with its picturesque landscape that seamlessly combines rolling hills and stunning coastline. The region enjoys a mild Mediterranean climate, characterized by warm summers and cool winters, making it ideal for outdoor activities throughout the year. The city boasts a thriving job market, with diverse employment opportunities across various industries, including technology, healthcare, and finance. Residents can indulge in a range of recreational pursuits, such as hiking, biking, and exploring the numerous parks and nature reserves in the area. Additionally, the city hosts a vibrant arts and culture scene, with art galleries, live performances, and community events to engage in.
What are the schools and amenities like in Laguna Niguel?
Laguna Niguel, California offers a variety of public amenities to its residents. Yes, the city boasts a wide selection of restaurants to cater to diverse culinary tastes. For outdoor enthusiasts, numerous parks provide spaces for relaxation and recreation. Grocery stores are conveniently located throughout the city, ensuring easy access to daily necessities. Additionally, Laguna Niguel offers more amenities such as fitness centers, libraries, and community centers to enhance the quality of life for its residents.
In the past month, 60 homes have been sold in Laguna Niguel. In addition to houses in Laguna Niguel, there were also 54 condos, 8 townhouses, and 1 multi-family unit for sale in Laguna Niguel last month. Laguna Niguel is a minimally walkable city in Orange County with a Walk Score of 33. Laguna Niguel is home to approximately 62,720 people and 14,714 jobs. Find your dream home in Laguna Niguel using the tools above. Use filters to narrow your search by price, square feet, beds, and baths to find homes that fit your criteria. Our top-rated real estate agents in Laguna Niguel are local experts and are ready to answer your questions about properties, neighborhoods, schools, and the newest listings for sale in Laguna Niguel. Our Laguna Niguel real estate stats and trends will give you more information about home buying and selling trends in Laguna Niguel. If you're looking to sell your home in the Laguna Niguel area, our listing agents can help you get the best price. Redfin is redefining real estate and the home buying process in Laguna Niguel with industry-leading technology, full-service agents, and lower fees that provide a better value for Redfin buyers and sellers.


 REDFIN IS COMMITTED TO AND ABIDES BY THE FAIR HOUSING ACT AND EQUAL OPPORTUNITY ACT. READ REDFIN'S FAIR HOUSING POLICY AND THE NEW YORK STATE FAIR HOUSING NOTICE.
 United States
 Canada