Discover the charm of this exquisite 3-story gated European-style estate, boasting captivating views stretching to Catalina and beyond! Nestled at the end of a serene street, overlooking the city, this generously proportioned residence offers both seclusion and expansive living spaces indoors and out. Enjoy leisurely days by the sparkling pool and spa, entertain guests with ease in the outdoor kitchen, or unwind amidst the inviting gardens and lighted tennis court. Inside, the house exudes old-world charm while offering breathtaking vistas of rolling hills, verdant trees, and twinkling city lights. Step into the foyer, adorned with rich mahogany woods and a dazzling crystal chandelier, and
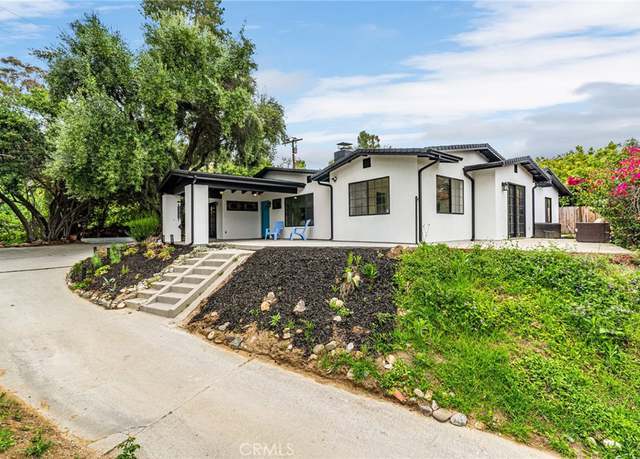
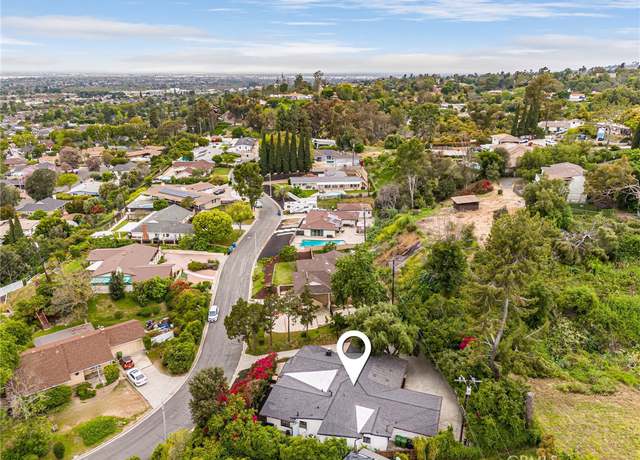
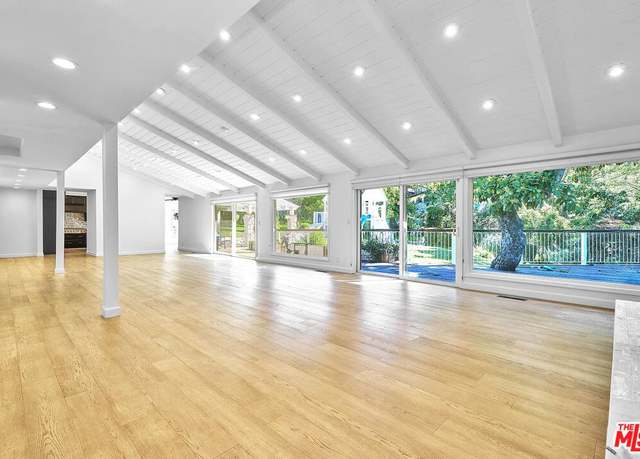
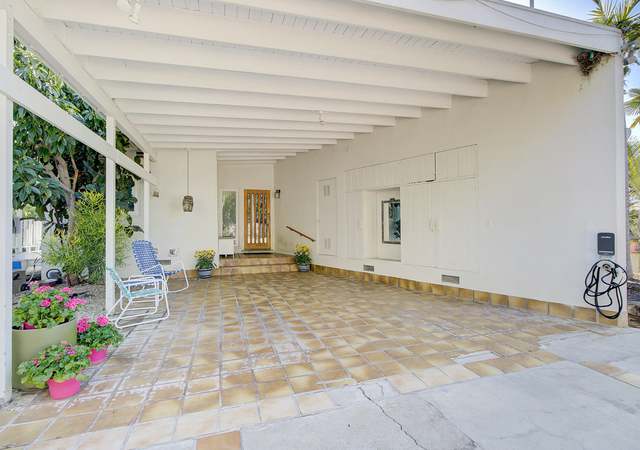
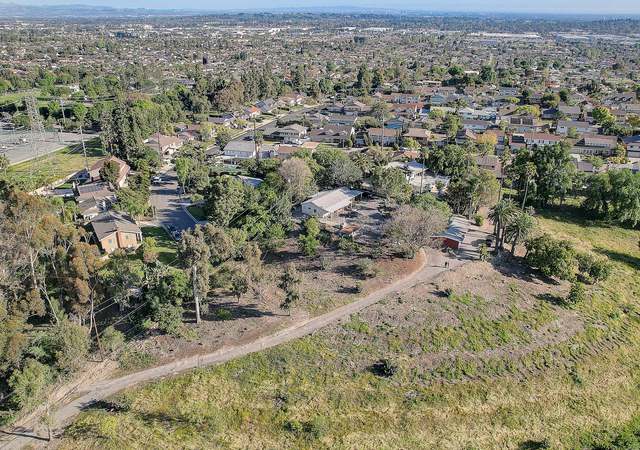
Welcome to your newly renovated peaceful & private oasis in this highly sought after neighborhood of Whittier. Located on the edge of nature on a tranquil hilly street, just a short drive to town & shopping. This 2,405 square foot property features four bedrooms, two bathrooms, an office, fully renovated kitchen & bathrooms, new flooring and LED lighting throughout. The primary bedroom features an en suite bathroom with double sinks. As you head up the driveway to your elevated lot, you are welcomed by peace & quiet, amongst greenery, nature, and cool breezes. Entering through the bright front door, you are met with an open floor plan with multiple entertaining areas
Come into this beautiful single story La Habra Heights home with a 4,234 SF open floor plan on an expansive lot that is nearly an acre. 1550 N Walnut Street is a gem of a house. A renovated luxury home boasts a gourmet chef's kitchen with Viking stainless steel appliances, engineered hardwood flooring, a gorgeous master suite, 2 fireplaces, a lush park like backyard with a playground, plenty of storage and guest parking, and RV parking. Enjoy the sun-filled high ceiling living areas looking through the large set of windows to your backyard deck. The gourmet kitchen is a beauty with quartz countertops and dark brown cabinets featuring an island with a breakfast bar. The kitchen opens to a br
Experience elevated living… with an unparalleled location, innovative design, and breathtaking views, this hilltop retreat offers a lifestyle of elegance, privacy, and serenity. This residence spans 3927 sqft across multiple levels of living space showcasing contemporary trends and inspired architecture. Situated on 3.3 acres with views of the Orange County coastline, Catalina, Long Beach, and the LAX area you can testify to the beauty of Southern California. Most notable about the parcel is the large, flat lot providing space for gatherings, events, or simply relaxing under the stars. The property is stunning the moment you pull down the driveway. With gorgeous copper and glass door
Welcome to an unparalleled opportunity for development and luxury living in the serene enclave of La Habra Heights. Nestled on approximately 5 acres of sprawling land, this estate offers the epitome of seclusion and privacy, making it a dream retreat for those seeking tranquility amidst breathtaking natural surroundings. Comprising two distinct residences, this property presents endless possibilities. The primary single-family home boasts 3 bedrooms and 2 bathrooms spread across approximately 2,267 square feet of meticulously designed living space. Meanwhile, a secondary residence offers 2 bedrooms and 1.5 bathrooms within approximately 1,200 square feet, providing ample accommodation for g
Nestled at the quiet end of a dead-end road in prestigious La Habra Heights, this expansive property offers serene living on a mostly flat acre with limitless possibilities. Imagine your days in a spacious 5-bedroom home (plus a potential 6th from the office), featuring a vast master suite with an enormous walk-in closet, and three baths. The property boasts extensive parking options and accommodations for RVs and trailers. Envision a new pool, ADU, or even horse amenities on open land ready for customization. The single-car garage includes a massive area perfect for a workshop or extensive storage. Enjoy east-facing views that could be expanded with elevated construction. The peaceful back
One of a kind elegance of an English country estate with private gate and amazing view lot, nestled amongst La Habra Heights. Prime custom home residential corridor offers over 4200 square feet of living space, including 4 bedrooms + study room (could be use to 5th bedroom), 4 bathrooms, an eloquent grand foyer entrance with beautiful custom double doors, spacious paneled billiard room, pub room offers cozy fireplace and high ceiling. Enjoy stunning city lights view, sunset view and disneyland firework from night. Elegant formal dining room with high ceiling and richy unique feel, large family room with fireplace and wet bar. Chef's kitchen 
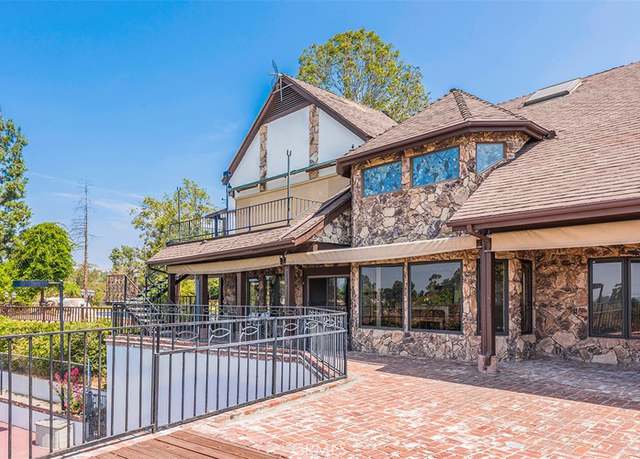
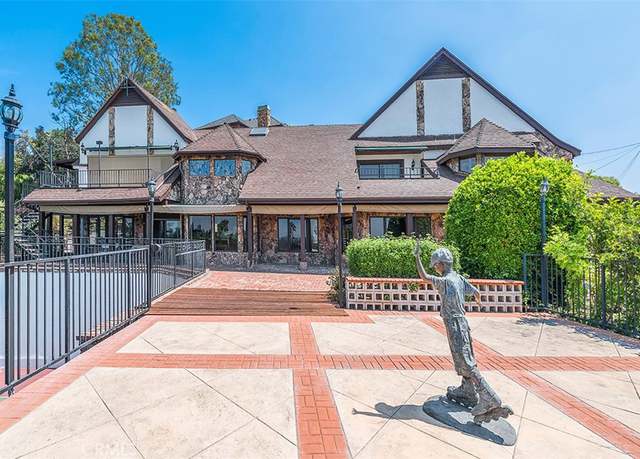
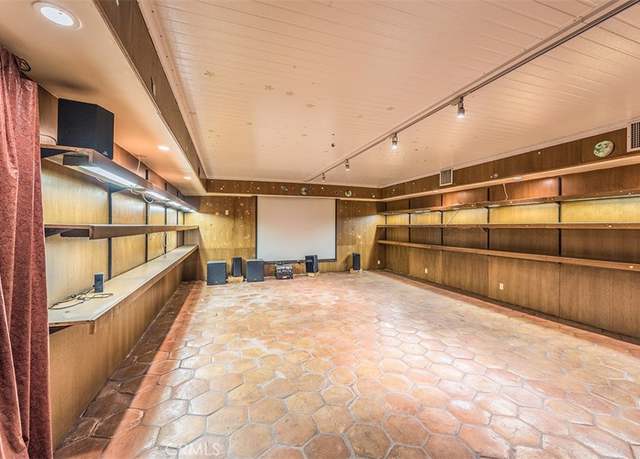
Spanish style home with Guesthouse built in 1992, 4 bedroom, 6 baths, living area appx 7,011 square foot with guesthouse above the garage, this home consists of a library, Den/ office area. Approximately 45,740 Square foot lot, gated entry with remote control of a roundabout driveway leading to a private entrance, 2-car garages with plenty of parking within the premise. Custom built wine Cellar that holds over 1500 bottles refrigerated. Formal front door entry into Grand reception area and leading to an open Living /Dining room, and very impressive Spanish traditional staircase. adjacent to the family room, pool table, games area with a beautiful designed wet bar for entertainment, Fireplac
View! View! View! Fall in love with this stunning custom built estate living with incredible panoramic views of City lights, Disneyland Fireworks and peekaboo ocean view. This exquisite Mediterranean Estate offers 7 bedrooms and 6.5 bathrooms/ 6846 sqft in the main house and over 4,000 sqft in the guest house/entertaining room. The property features a range of amenities, including a full size tennis court, newly updated heated pool and spa, outdoor kitchen and BBQ, landscaping and fruit trees all set on an over 1.97 acres lot. The estate offers 7 guest parking with 4 car garage. It boasts abundant natural light, quality materials and finishes throughout. This property located close to Frien
Pristine custom home built and owned by the original owners. Perfectly situated to enhance the picturesque 360 degree views of the hillsides, canyons and city lights. Welcome to 2034 Virazon Drive La Habra Heights! This 4 Bedrooms and 4.5 baths, an oversized primary suite with a retreat and viewing decks throughout the house. A huge closet that is the size of a small bedroom. Bedroom and bathroom downstairs can also be used as an office. Open floor plan; Family room opens to kitchen the features include high end appliances, custom built cabinetry and island, granite countertops and more. The quality materials and workmanship are notable. A purchased 4,000 Watt solar system, central vac, fir
· Custom built 4 bedrooms/3.5 bathrooms modern Mediterranean style home in a tranquil country like setting , adorned with generous French doors with glass panes throughout to capture natural lights and fabulous panoramic views of city lights, ocean and mountains (Per owner, view of Catalina Island on a clear day and Disney Fireworks. ). Quality hardwood, marble and tiled flooring, crown moldings, and recessed lights throughout the home. · Double front entry doors with high ceiling, overhead stained glass open to welcoming Living Room/Great Room with fireplace and built-in shelves, dining room with French doors leading to entertainer’s backyard, chef’s kitchen w
Welcome to La Habra Heights, where your dream home awaits! This 1.66-acre view lot offers a rare opportunity to create your own sanctuary. Perched atop the hills, you’ll enjoy breathtaking vistas of the surrounding landscape, including city lights that twinkle like stars in the night sky. Surrounded by multimillion-dollar homes, this peaceful community provides the perfect canvas for your architectural vision. Imagine waking up to the sun rising over the hills, casting a warm glow on your future abode. Despite its serene setting, La Habra Heights is conveniently located on the LA/Orange County border. You’ll have easy access to all the amenities you desire, from shopping and din
Exclusive 0.92-acre parcel in prestigious La Habra Heights boasting tranquil hillside vistas amidst a landscape of million-dollar ranches and luxury estates. Positioned near Hacienda Golf Course and Orange County, this coveted lot includes expired plans and soil reports, offering an ideal canvas for crafting a dream residence. Additionally, the adjoining 0.81-acre plot at 1763 Subtropic is available for separate purchase at $120,000, presenting an outstanding investment opportunity for homeowners or discerning developers.
Exclusive 0.81-acre parcel in prestigious La Habra Heights boasting tranquil hillside vistas amidst a landscape of million-dollar ranches and luxury estates. Positioned near Hacienda Golf Course and Orange County, this coveted lot includes expired plans and soil reports, offering an ideal canvas for crafting a dream residence. Additionally, the adjoining 0.92-acre plot at 1875 Subtropic is available for separate purchase at $125,000, presenting an outstanding investment opportunity for homeowners or discerning developers.
Casalero Road an amazing “acre plus” hillside lot serenely secluded “above it all” in the hills of prestigious La Habra Heights! This rare mostly flat lot boasts breathtaking views of the valley below, with a backdrop of majestic snow capped mountains and the distant skyline of the skyscrapers of downtown LA. Only minutes from freeways, shopping & restaurants down the hill with access to all of Southern California. This is truly a hidden gem gazing at & escaping from the world below, in LaHabra Heights! * * * Photo shown is a digital rendering, buyer to verify what is possible.
Incredible opportunity to build your dream home on this expansive 41,244 sq ft land in La Habra Heights! Nested near Hacienda Golf Club, this lot is an absolute dream opportunity for any investor/developer/homeowner. Idea for building a custom home with/without ADU, this location is full of peace and tranquility with abundance of wildlife and nature, while easily accessible to shops, dining and urban life. It is absolutely the best of both worlds! You do not want to miss out on this opportunity, come check it out!!
GREAT OPPORTUNITY TO BUILD YOUR OWN DREAM!! CALLING ALL DEVELOPERS, BUILDERS, and INVESTORS!! Escape to your own piece of paradise with this stunning approx 36,782 parcel of land boasting GORGEOUS City Light, Ocean and Mountain Views. Nestled near Hacienda Golf Club, this prime real estate offers the perfect canvas for your dream home. Key Features: - Easy access from East Rd - Unobstructed, sweeping city light, mountains and ocean views - Serene and tranquil location on a cul-de-sac - Ideal for building a custom home, ADU(s), carports, etc. (a home was already located on this parcel) - Abundant wildlife and natural beauty - Numerous Fruit Trees - Water, electrical and gas accessible
Just up hills from Hacienda golf courses area, idea place to live in, neighboring luxury estate in La Habra heights, the outstanding panoramic 180 degree view. The seller has been submitted in process with city for a 3891 sf of total living space, including 4 beds, 3 bath, 3 car garage with 4 open parking space, the plans is final stage of review.
Exclusive Residential Land Opportunity in La Habra Heights! Are you dreaming of building your perfect home with breathtaking views? Look no further! We present to you a prime 1.17-acre residential land in the prestigious La Habra Heights, where luxury living meets natural beauty. Spectacular Views: Marvel at panoramic views that stretch from the rolling hills to the city lights. This parcel of land offers a unique opportunity to create your dream home surrounded by the beauty of nature. Preliminary Design Included: Imagine a 4-bedroom, 4-bathroom, 3-story home perfectly designed to complement the natural landscape. The preliminary design is already in place, offering you a head start in vis
RESIDENTIAL - VACANT LAND. POTENTIAL TO BUILD A COSTUME HOME IN THE GOOD NEIGHBORHOOD OF LA HABRA HEIGHTS, JUST 2 MILES FROM THE FO GUANG SHAN HSI LAI TEMPLE IN HACIENDA HEIGHTS, WITHIN A MILE TO Hacienda Goff court, VERY WELL ESTABLISH NEIGHBORHOOD
Motivated Seller, offering 30k in concessions to buyer for whatever the buyer wishes to do! 1945 Sharpless Dr. in La Habra Heights presents a 5.3-acre canvas for your dream hillside home or homes! With two road entrances and potential for up to three houses, this coveted spot promises stunning city lights views and access to renowned hiking trails. This sought-after area is renowned for its spacious estates, ranging from 3,300 to 9,000 SF. Seize this opportunity from a motivated seller to create an extraordinary retreat in this prestigious locale.
Over 1 Arce Top of the Hill land, Great view on Top. Some flat and hilly topography . It comes with detail and gorgeous architectural plan around 6000 Sqt inside . The plan has been approved by the City and only look for contractor to build. Neighbor is new built as well. It is gorgeous . it can be sold with 657 E Avocado Crest Rd, La Habra Height, CA, 90631 for 1.4 million.
Nestled near La Habra Heights' Hacienda Golf Course, a captivating vacant land awaits. With stunning views of the Pasadena Mountain and surrounding greenery, this generous expanse offers boundless opportunities for custom design. Located in a sought-after area, it provides a serene retreat while maintaining easy access to urban amenities. Embrace the charm of this picturesque setting and create your dream sanctuary on this desirable land.
Great location with scenery to the West, North and East. The final permits to build almost complete for approval. You will also receive all the available plans and permits. Large lot with large surface to build on and still room for hiking within your own land. It has a small steam running through the property that has running water for several months. Buyer to do all available research to their satisfaction.
Don't let this incredible opportunity to build your hillside dream home on over 3 acres of secluded land in beautiful La Habra Heights pass you by. If you want privacy, serenity, away from the city hustle, and incredible views than building your future home in this piece of land is the way to go. You will get transported from the city chaos to the peaceful hillside living without needing to compromise distance or being remote. Come take a look and fall in love with the area, the ambiance and the location. The peacefulness and serenity in this location can only make room for your imagination of what you could potentially build here.
These parcels have been subdivided into 5 lots. We have all the soil reports, civil and topography reports. We also have preliminary architectural drawings for 5 large custom built single family homes.
Having trouble finding the perfect home? Build it yourself. With this unique parcel of land in La Habra Heights, much of the hard work has all been done for you by the current owner who has engineered this acre+ lot to be ready for your dream home. At the higher elevation of the property, where the home is currently planned to be built, you have a panoramic view toward Catalina Island. The owner has proposed a 2600 sqare foot single story, single family home with an option for either a 3 or 6 car garage with 1000 square feet of deck space over the garage looking toward that fantastic Catalina Island view. Rough grading is already complete and the grading permit is in-hand. Water meter is on
A 360 degree view of City Lights and Hacienda Golf Course! Located in the beautiful serene community of La Habra Heights near million dollar homes this exceptional opportunity is absolutely perfect for investors/developers or homeowners looking to build their dream home and customize every detail to their own design. This is a hard to find FLAT lot situated perfectly at the top of the hill for breathtaking panoramic views. This immediate area has had an increase in current new home starts. Be the next one to start your home. YOU DON'T WANT TO MISS OUT ON THIS AMAZING OPPORTUNITY!!
School data is provided by GreatSchools, a nonprofit organization. Redfin recommends buyers and renters use GreatSchools information and ratings as a first step, and conduct their own investigation to determine their desired schools or school districts, including by contacting and visiting the schools themselves.Redfin does not endorse or guarantee this information. School service boundaries are intended to be used as a reference only; they may change and are not guaranteed to be accurate. To verify school enrollment eligibility, contact the school district directly.
La Habra Heights, California, is a city where the primary mode of transportation is by car. The traffic levels in the city can vary, but generally, residents experience moderate traffic during peak hours. Unfortunately, La Habra Heights does not have a public transportation system, making cars essential for getting around. For those who need to travel further, the city is conveniently located near several major highways and freeways, providing easy access to surrounding areas.
What types of properties are available in La Habra Heights?
La Habra Heights, California offers a variety of single-family home types, including ranch-style homes, contemporary homes, and Mediterranean-style homes, among others. These homes can be found throughout La Habra Heights, California, with many located in peaceful neighborhoods and on spacious lots. Most properties in La Habra Heights, California feature three to six bedrooms and were built in various years. To explore different property types for sale in La Habra Heights, California, use the 'Home type' filter located above the active listings. Customize your search by selecting options like single-family homes, condos, townhomes, and more.
What is life like in La Habra Heights?
Living in La Habra Heights, California offers a tranquil and serene environment surrounded by picturesque landscapes. The area boasts a diverse range of natural beauty, including rolling hills, lush greenery, and breathtaking views. The weather is characterized by mild winters and warm summers, providing an ideal climate for outdoor activities. The region provides a variety of job opportunities across various industries, including technology, healthcare, and education. Residents can enjoy a plethora of recreational options, such as hiking, horseback riding, and exploring local parks and trails.
What are the schools and amenities like in La Habra Heights?
La Habra Heights, California offers a variety of public amenities for its residents. The city boasts a number of restaurants, ensuring a diverse array of dining options for all tastes. Outdoor enthusiasts will appreciate the several parks within the city limits, perfect for leisure and recreation. For your daily needs, there are grocery stores conveniently located throughout the city. Additionally, other amenities such as schools, libraries, and fitness centers are readily available for the residents of La Habra Heights.
In the past month, 2 homes have been sold in La Habra Heights. In addition to houses in La Habra Heights, there were also 0 condos, 1 townhouse, and 0 multi-family units for sale in La Habra Heights last month. Find your dream home in La Habra Heights using the tools above. Use filters to narrow your search by price, square feet, beds, and baths to find homes that fit your criteria. Our top-rated real estate agents in La Habra Heights are local experts and are ready to answer your questions about properties, neighborhoods, schools, and the newest listings for sale in La Habra Heights. Our La Habra Heights real estate stats and trends will give you more information about home buying and selling trends in La Habra Heights. If you're looking to sell your home in the La Habra Heights area, our listing agents can help you get the best price. Redfin is redefining real estate and the home buying process in La Habra Heights with industry-leading technology, full-service agents, and lower fees that provide a better value for Redfin buyers and sellers.


 REDFIN IS COMMITTED TO AND ABIDES BY THE FAIR HOUSING ACT AND EQUAL OPPORTUNITY ACT. READ REDFIN'S FAIR HOUSING POLICY AND THE NEW YORK STATE FAIR HOUSING NOTICE.
 United States
 Canada