Welcome to The Gables Community! This highly desired community single level home features a 2 bedroom, 2 bath, 2 car garage! Comfortable and modern living space situated right next to the swimming pool area in a park like setting. The two-bedroom, two-bathroom unit includes a spacious living room with cathedral ceilings, ample natural light and cozy gas fireplace, perfect for relaxing or entertaining. The open-concept kitchen has plenty of counter space, spacious pantry and cabinets for storage. The dining area is adjacent to the kitchen, providing a convenient and welcoming space for family. The 2 car garage leads you into your own private covered patio great for BBQ's, and access to enter
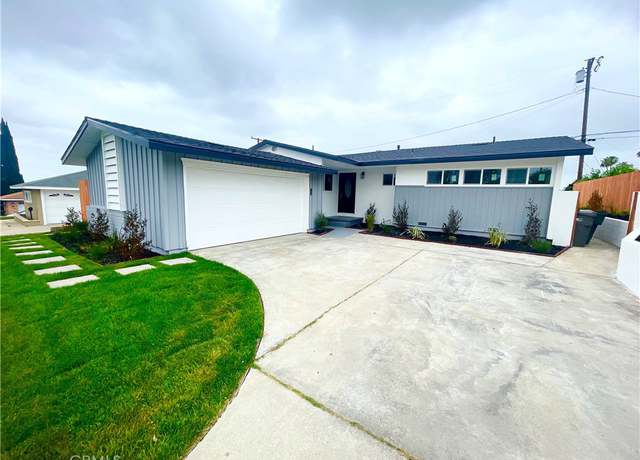
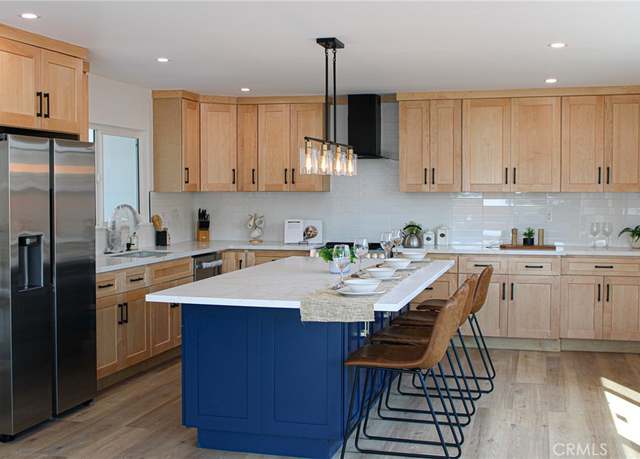
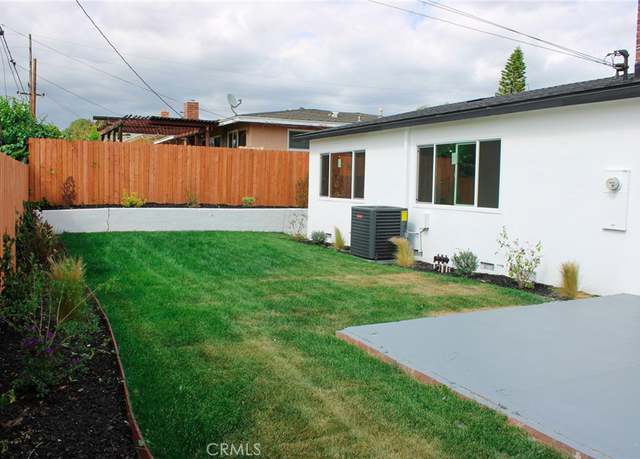
Newest Gem on the market has now arrived to the city of La Habra! Prepare to be astonished by this turnkey property featuring 3 Bedrooms, 2 Bathrooms that have been meticulously remodeled to provide you a true worry-free homeowner experience. Fall in love with the open floor layout leading into a custom designed kitchen with an ideal mixture of maple wood cabinetry, new quartz countertops, new stainless-steel appliances and a large navy blue island that overlooks the living room, dining room and fireplace. This set up is ideal for entertainment purposes as it connects to a sliding door that leads to the backyard which has been beautifully landscaped, including a new sprinkler system, drough
End unit condo conveniently located in the city of Fullerton in the Sunny Hills High School District. Rare to find two master bedrooms, each with its own ensuite bath. Downstairs, you will find a spacious living room complete with a fireplace. The kitchen features a bay window and a dining area that overlooks the lovely backyard with a large patio unlike any other in the complex. This property has a private two-car garage and has been updated with a new kitchen, roof, and whole-house re-piping done two years ago. The community includes a pool and spa and is within walking distance of Laguna Lake and its trail.
CITY LIGHTS, SNOW-CAPPED MOUNTAINS & HILLS VIEWS! A true pride ownership! Beautiful setting in a single load street. Gorgeous property located in one of the best areas of La Habra, nestled in the hills of the exclusive "Country Hills East" community. Very nice development surrounded by lush mature trees and natural ambiance. Near Westridge and Los Coyotes Golf Courses -- great opportunity to live in a very exclusive area. Extremely sharp and executive two story; five bedrooms and 3 bathrooms; fabulous curb appeal; lots of natural light coming through this property. Grand entry with dramatic soaring ceilings and an open concept floorplan. Richly appointed and customized. Warm
A wonderful opportunity to live in a BRAND NEW, END-UNIT condo in the beautiful city of La Habra. This condo is approx. 2,258 Sqft with 3 Bedrooms and 3.5 Bathrooms. It's the ONLY ONE of this floor plan. High ceilings throughout the home makes the entire condo feel extra spacious. Numerous windows throughout which allows for natural light. Wonderful kitchen opens to an enormous great room. Kitchen has soft closing drawers and cabinets. Large kitchen with quartz countertop and a large waterfall island. Brand new appliances (dishwasher, stove, microwave). Vinyl Flooring throughout. 1 Bedroom on First Floor and 2 Bedrooms upstairs. Each Bedroom has its own full bathroom. Primary Bedroom has a
Charming Mid-Century Home in La Habra Explore this inviting four-bedroom, two-bathroom mid-century home in La Habra. Built in 1963, it features a spacious living room with windows filling the space with natural light. You will enjoy the open kitchen that extends into a cozy family room with a brick fireplace. The sliding glass door opens to covered patio and a lush lawn with vibrant spring flowers, perfect for gatherings. While retaining many original details, this home offers ample scope for personalization and modern updates. Embrace the potential of this classic property Bring your designer and make it uniquely yours, blending historical charm with your own design flair.
Great starter home in the heart of La Habra close to La Habra main downtown stores close to schools & shopping centers Corner lot home with lots of potential possibilities garage is completely separate from main house on Heather Ave. Home needs some TLC Home is being Sold AS-IS condition
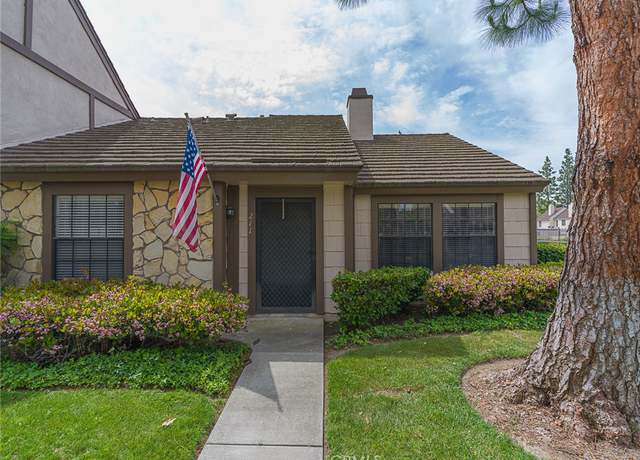
Welcome to a captivating blend of Mid Century Modern aesthetics and contemporary comfort in this meticulously upgraded end unit home located in the sought-after Heritage Village community. Step inside to discover a sanctuary of style, where every detail has been thoughtfully curated. The spacious living area boasts a timeless ambiance, accented by upgraded flooring and recessed lighting, creating an inviting atmosphere for relaxation or entertaining. The heart of the home, the kitchen, received a stunning makeover in 2020, featuring modern upgrades that complement the home's stylish vibe. With its sleek countertops and ample storage space. With two spacious bedrooms and one-and-a-half bathr
Gorgeous and Largest Plan Home in The Exclusive "Tapestry Gated Community". This Lovely Home has 5 Bedrooms and 4 Bathrooms Including One Bedroom and One Bathroom Downstairs for Home Office, Guest or Extended Family. Builder Upgraded Travertine Title Floor Downstairs and Carpet Upstairs. Formal Living Room and Dining Room with Lots of Windows for Bright Lighting. Luxurious Master Bedroom with Spacious His and Her Walk In Closets, Master Bathroom with Spacious His and Her Sink. Separate Shower and Bathtub. Gourmet Kitchen with Granite Countertops. Upgraded Custome Cabinets, Newer Water Softener System and Drinking System, Breakfast Nook, Center Island and Recessed Lighting. Newer
Exceptional home in desirable Country Hills East Tract, La Habra. Beautifully remodeled home with many upgrades! 2883 Sq Ft of open floor plan which includes formal living room, family room off kitchen with outdoor access. Large bedrooms and additional family/ game room upstairs with outdoor deck. Vaulted ceilings, plantation shutters, crown moldings and beautiful light fixtures add elegance. Travertine tile flooring and gorgeous wood tile flooring thru-out. Entertain or bask in the sun in the private backyard oasis! Includes fruit trees: oranges, apples, peaches figs and loquats. Sellers relocating
Location and Views ! Welcome to 1941 Sarazen Court located in the beautiful Westridge Golf Club gated community in La Habra surrounded by Westridge Golf Course. Elegant, and utterly decadent, this view home delivers a spectacle of secluded living. Home is located behind near the top of the community on a large lot in a secluded cul-de-sac. Impressively remodeled, the home carefully balances timeless traditional architecture and a seemingly unlimited amount of preferred upgrades. As you enter through the double glass front door your eyes will be drawn to the two story ceilings in the formal living room, stunning wood flooring and sweeping staircase. Also included on the main floor of this ho
Welcome to your dream retreat atop the prestigious Country Hills neighborhood! First time on the market, this amazing single-story 4 bed and 2 bath home with pool sits on a 10,032 square lot with breathtaking panoramic views of the San Gabriel mountains and city lights and is the epitome of luxurious living. The home boasts a meticulous renovation surpassing $250K in upgrades which includes an exquisitely renovated kitchen complete with quartz countertops, a 36” professional GE range and Zephyr hood, stainless steel GE appliances, custom tile backplash, and a large kitchen island with pendant lights. Designed for seamless entertaining, the open floor plan effortlessly integrates the f
Beautifully Renovated Traditional Style Home! This tri-level home boasts a stunning traditional design, featuring spacious living areas, ample bedrooms, and luxurious bathrooms, perfect for entertaining guests. The foyer and dining room exude elegance, adding to the charm of this entertainer's dream home. Enjoy picturesque views of the lush backyard from the formal living room, complete with a gas fireplace and built-in curio cabinet. The recently remodeled kitchen shines with its white cabinets and quartz countertops, creating a bright and inviting space. Downstairs, you'll discover two bedrooms, a bath, and a spacious family room updated with designer paint colors and new laminate floorin
Welcome to an unparalleled opportunity for development and luxury living in the serene enclave of La Habra Heights. Nestled on approximately 5 acres of sprawling land, this estate offers the epitome of seclusion and privacy, making it a dream retreat for those seeking tranquility amidst breathtaking natural surroundings. Comprising two distinct residences, this property presents endless possibilities. The primary single-family home boasts 3 bedrooms and 2 bathrooms spread across approximately 2,267 square feet of meticulously designed living space. Meanwhile, a secondary residence offers 2 bedrooms and 1.5 bathrooms within approximately 1,200 square feet, providing ample accommodation for g
Presenting a stunning contemporary living LUNA Community! This exceptional townhome, crafted in 2018, showcases a captivating, fully upgraded model home. Luxurious enhancements grace every corner, from the hardwood flooring spanning both levels to the sophisticated marble inlay welcoming you in the foyer. Enjoy the convenience of soft-closing hardware on every cabinet and the elegance of intricate tile work in both showers. A spacious den on the main floor offers versatility as an office or potential third bedroom, enhanced by custom shelving and ambient lighting by the builder. Enhancing the ambiance further, zebra blinds adorn all windows, imparting a sense of refinement. For those with a
This Beautiful La Habra property offers 3 Bedrooms and 1 Bathroom, situated within 1,338 sq ft of living space on a 5,720 sq ft lot. Features include a Remodeled Kitchen with Beautiful Cabinets, Quartz Counters, and New Appliances. This Open Floor Plan offers ample space that would be perfect for hosting. The 3 Bedrooms are Spacious with Ceiling Fans and Natural Light. The Long driveway with detached garage has plenty of room for multiple vehicle parking. The Large Covered Patio in the backyard is a great place to relax and enjoy the view of the many Fruit Trees. Great Central Location to Shopping, Dining, and Entertainment. Walking Distance to La Habra High School and just a Short Drive
Welcome to this wonderful two-story home with 3 bedrooms and 2.5 bathrooms. Upon entering the welcoming home, greeted by a bright and airy open living, dining, and kitchen area. The owner has recently renovated the home with new laminated flooring, brand new carpeting and installed new tankless water heater. Laminated flooring on the first floor with tile flooring in the kitchen area, luscious carpeting throughout the staircase continuing to living quarters upstairs. Taking the stairs up, leads to 2 sizable bedrooms to the left, one of the bedrooms including a walk-in closet. To the right wing of the upstairs sits the laundry room and a large master suite. The spacious master suite features
A wonderful opportunity to live in a BRAND NEW, END-UNIT condo in the beautiful city of La Habra. This condo is approx. 2,188 Sqft with 3 Bedrooms and 3.5 Bathrooms. This is the ONLY ONE in the whole community that has 3 Balconies/Decks. High ceilings throughout the home makes the entire condo feel extra spacious. Numerous windows throughout which allows for natural light. Wonderful kitchen opens to a enormous great room. Kitchen has soft closing drawers and cabinets. Large kitchen with quartz countertop. Brand new appliances (dishwasher, stove, microwave). Vinyl Flooring throughout. 1 Bedroom is on the main floor by the kitchen. 2 Bedrooms are on the third floor. Each Bedroom has it's own
A wonderful opportunity to live in a ENORMOUS, BRAND NEW condo in the beautiful city of La Habra. This condo is approx. 2,385 Sqft with 3 Bedrooms and 3.5 Bathrooms. High ceilings throughout the home makes the entire condo feel extra spacious. Numerous windows throughout which allows for natural light. Wonderful kitchen opens to a enormous great room. Kitchen has soft closing drawers and cabinets. Large kitchen with quartz countertop and a large waterfall island. Brand new appliances (dishwasher, stove, microwave). Vinyl Flooring throughout. First Floor can be utilized in numerous ways (office, game room, guest/4th bedroom since there's a full bathroom on First Floor). Three Bedrooms upstai
Elegantly Redefined Residence in Pristine Cul-de-Sac Discover the epitome of Fullerton luxury at 3821 Lariat Pl, an exquisitely remodeled single-family haven set on a sprawling 10,500 sq ft lot, offering unparalleled privacy and tranquility. Nestled in a serene cul-de-sac, this home epitomizes modern living with its thoughtful upgrades and expansive backyard oasis, perfect for both relaxation and grand entertaining. Key Features: Stylish Comfort: Embrace the warmth of this 4-bedroom, 2-bathroom gem boasting 2,136 sq ft of meticulously designed living space. The open and airy floor plan is accentuated by vinyl plank and wood flooring throughout, creating a harmonious blend of elegance and
Discover pure opulence in this breathtaking 4-bedroom, 2-bathroom sanctuary, nestled within the sought-after enclave adjacent to La Habra Heights. Prepare to be dazzled by the custom remodel adorning every corner, with luxurious hardwood floors setting the stage for an exquisite living experience. The expansive Primary bedroom, primary bath boasting vaulted ceilings, a lavish walk-in closet, and a charming fireplace, elevates the home's allure to unparalleled heights. Step outside to find a sprawling yard awaiting your artistic landscaping vision, perfectly complemented by its proximity to shopping and effortless freeway access. Prepare to be captivated as this home emanates sheer brillianc
Sought-After Portola Park Community, Modern and open model floor plan tri-level END unit, Small setting room at the entrance could be used as an office attached 2 car garage upper level open design Living room half of bath, Spacious kitchen and small dinning room all 3 bedrooms and 2 bathrooms plus laundry room on the 3rd level this home shows great more pictures to come soon!!
GREAT LA HABRA HOME Location, Location! This is a rare opportunity really kept up and maintained throughout the years . This super cute home sits on a corner lot with plenty of room to stretch out and enjoy the outdoors . Front yard has its own private park setting an amazing area for those outdoor events we all enjoy. . Exquisite architecture and craftsmanship all around. This serene home invites you to sit and watch birds in the front and back yard of the abundant gardens. As you glance at the front door you will see the beginning of the characteristics of the entire home. Featuring 3 bedrooms 1 bath huge attic can be utilized as bonus space or storage. It has plumbing ready for a second
Senior Living 55 + This spacious 2br, 2 ba home has been tastefully updated in neutral tones which will complement your furniture. Laminate wood like flooring in living room, den, laundry and guest bath. The open concept kitchen features granite counter tops, newer appliances, garden window, stainless steel farm style sink with breakfast bar. The attached den area has a sliding door which opens onto the patio perfect for entertaining family and friends. The large Master Suite features a wardrobe closet with mirrored sliding doors. Attached bath includes double sinks, walk-in shower, garden style tub, and built-in linen closet. Guest bedroom features a wardrobe and an attached bathroom with
The Executive cul-de-sac home in the highly sought after upscale gated WEST HILLS community! Huge 5 bed, 3 bath home with soaring ceilings. Granite countertop, double sink vanity with fancy faucets and sinks, and upgraded mirror, and oversized walk-in closet and stylish living room has soaring high ceiling and many windows with lots of sunlight and brightness. The large family room includes a refined fireplace and direct access to professionally big backyard. This stylish home includes new luxury flooring (downstairs). There is a park nearby with a private entrance, access to trails and walking distance to a golf course, shopping centers and restaurants.
Charming Mid-Century La Habra Home with Modern Upgrades. This beautifully updated home in La Habra offers comfort, style, and convenience. With 3 bedrooms, 2.5 bathrooms, and an attached two-car garage there is plenty of space to settle down. Some major updates include a new roof, new drywall throughout, updated electrical re-wire, new windows, and electrical panel. The recently installed luxury-vinyl flooring throughout the home adds a touch of elegance. The kitchen boasts new cabinets, countertops, appliances and a two-person island. The home has two and a half bathrooms offering privacy and comfort. Modern vanities enhance the bathrooms’ functionality and aesthetics. The backyard f
PRICE REDUCTION! The owner wants it sold. This is an extraordinarily placed gorgeous, upgraded luxury mobile home in move-in condition. It is in one of the most exquisite 55+ senior community mobile parks in Southern California. The wonderful Lake Park Homes in La Habra provides a well-maintained, I mean WELL-maintained, park-like setting with manicured greenbelt and pristine pathways and driveways. The clubhouse is surrounded by a lake, where you can actually fish, and is a beautiful place for your parties, community gatherings (the pancake breakfast is lots of fun!) or just hanging out for a game of pool or cards with your friends in the billiard/card room. There is pickleball access as w
This move-in ready senior 55+ home offers a perfect blend of modern comfort and convenience. Boasting two bedrooms and two baths, the spacious living room features large picture windows that flood the space with natural light. The open-concept kitchen is a chef's delight , equipped with stainless steel appliances, quartz countertops, and a generously sized center island that can seat 5-6 bar stools, ideal for entertaining. The primary bedroom has an attached bathroom featuring a walk in shower and tub. Recent upgrades include plantation shutters and an AC unit, ensuring comfort year round. There is a good size covered porch/patio. The clubhouse features a heated swimming pool, spa, library,
The heart of this home is the ultra-modern, large kitchen with new appliances. It opens up to spacious dining/family room. At 1440 sq. feet, this home features 2 bedrooms and 2 baths. New dual pane windows throughout. The baths are also upgraded. The master bath is huge and has two closets. There is a wonderful area off the living room that is perfect for an office or breakfast area. So many possibilities. Huge Living room. The home faces a lush greenbelt and it has large porch that is perfect for entertaining or just relaxing. There is an inside laundry room and covered carport. This unit has so much storage in and out. Fantastic 55+ community with so many amenities. Community pool, spa, l
If you want one of the best locations in the park, this is it! Did I mention the priced was just reduced! This unit is across from the pool and features a totally unobstructed view of the clubhouse, pool area and a bit of the lake. No neighbors in front of the porch to block your view. Open floor plan with 2 bedrooms, 2 baths and a huge master bathroom. The spacious kitchen has lots of cabinets, new faucet, recessed lighting. The huge master bathroom has track lights, remodeled tub/shower, quartz counters and loads of storage. The guest bath is also remodeled. The large living room has new carpet, bay window and great views to enjoy. There is a family room with patio door that exits to a p
School data is provided by GreatSchools, a nonprofit organization. Redfin recommends buyers and renters use GreatSchools information and ratings as a first step, and conduct their own investigation to determine their desired schools or school districts, including by contacting and visiting the schools themselves.Redfin does not endorse or guarantee this information. School service boundaries are intended to be used as a reference only; they may change and are not guaranteed to be accurate. To verify school enrollment eligibility, contact the school district directly.
La Habra, California boasts a well-connected transportation system, making it easy for residents to navigate the city by car. Despite the occasional peak-hour congestion, traffic levels are generally manageable, ensuring smooth commutes for drivers. Public transportation is available, with several bus routes servicing the area for those who prefer not to drive. Additionally, La Habra is conveniently located near major highways and freeways, providing easy access to surrounding regions. Learn more on our La Habra city guide.
What types of properties are available in La Habra?
La Habra, California offers a variety of single-family home types, including ranch-style, contemporary, and modern homes. These homes can be found throughout the city, with many located in established neighborhoods and newer developments. Most properties feature two to five bedrooms and were built in various years. To explore different property types for sale in La Habra, California, use the 'Home type' filter located above the active listings. Customize your search by selecting options like single-family homes, condos, townhomes, and more.
What is life like in La Habra?
La Habra, California offers a vibrant community with a variety of amenities and services. The city is surrounded by picturesque landscapes, including rolling hills and lush greenery. The weather in La Habra is pleasant, with mild winters and warm summers. The city provides a range of job opportunities across different industries, catering to various skill sets. Residents can engage in numerous activities such as exploring local parks, participating in recreational sports, and enjoying the city's cultural events.
What are the schools and amenities like in La Habra?
La Habra, California, is a city that offers a range of public amenities to its residents. You can find a variety of restaurants offering diverse cuisines to satisfy your culinary cravings. The city is also home to several parks, providing ample space for relaxation and outdoor activities. For your daily needs, numerous grocery stores are available throughout the city. Additionally, La Habra boasts more amenities such as fitness centers, libraries, and shopping centers.
In the past month, 35 homes have been sold in La Habra. In addition to houses in La Habra, there were also 25 condos, 3 townhouses, and 4 multi-family units for sale in La Habra last month. La Habra is a moderately walkable city in Orange County with a Walk Score of 63. La Habra is home to approximately 59,599 people and 16,441 jobs. Find your dream home in La Habra using the tools above. Use filters to narrow your search by price, square feet, beds, and baths to find homes that fit your criteria. Our top-rated real estate agents in La Habra are local experts and are ready to answer your questions about properties, neighborhoods, schools, and the newest listings for sale in La Habra. Our La Habra real estate stats and trends will give you more information about home buying and selling trends in La Habra. If you're looking to sell your home in the La Habra area, our listing agents can help you get the best price. Redfin is redefining real estate and the home buying process in La Habra with industry-leading technology, full-service agents, and lower fees that provide a better value for Redfin buyers and sellers.


 REDFIN IS COMMITTED TO AND ABIDES BY THE FAIR HOUSING ACT AND EQUAL OPPORTUNITY ACT. READ REDFIN'S FAIR HOUSING POLICY AND THE NEW YORK STATE FAIR HOUSING NOTICE.
 United States
 Canada