
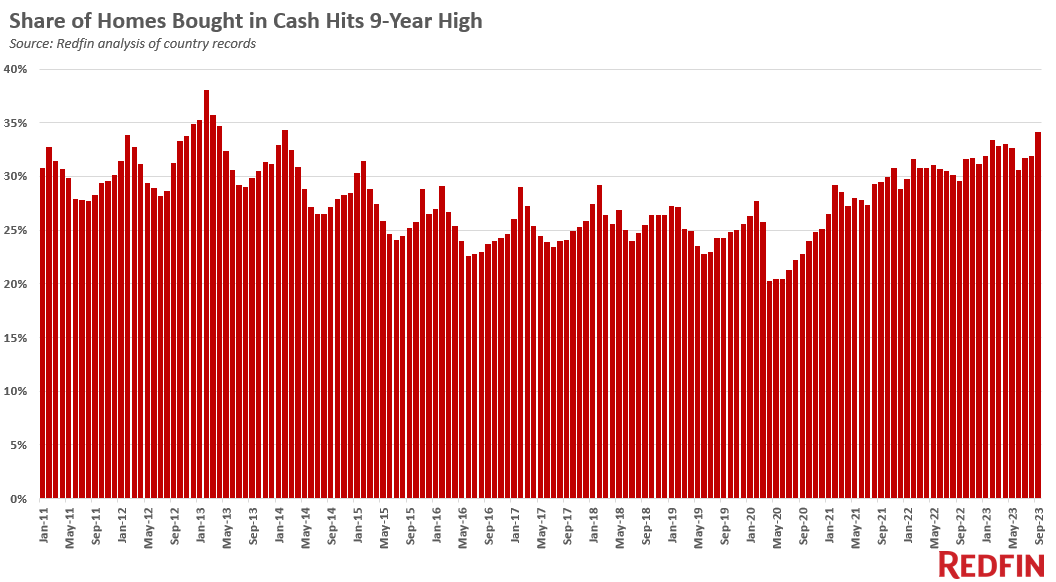
- The share of homes bought in all cash hit its highest level since 2014 in September as elevated mortgage rates made paying in cash more attractive and priced out many buyers who would need loans.
- The number of all-cash sales was still down 11% from a year ago because the overall housing market has slowed so much, but that’s much smaller than the 23% drop in all home sales.
- Buyers are making bigger down payments to offset the cost of high mortgage rates: The typical U.S. buyer put down 16%, the highest percentage in nearly a year and a half.
- 15% of buyers with mortgages used FHA loans, up from 14% a year earlier. Just over 6% used VA loans, down just marginally from a year earlier.
Just over one-third (34.1%) of U.S. home purchases in September were made in cash, up from 29.5% a year earlier and the highest share in nearly a decade.
The data in this report is from a Redfin analysis of county records across 40 of the most populous U.S. metropolitan areas, going back through 2011. The national numbers in this report refers to those 40 metros. September 2023 is the most recent month for which data is available. An all-cash purchase is one in which there is no mortgage loan information on the deed.
All-cash purchases are making up a bigger piece of the homebuying pie for two major reasons. Affluent Americans who can afford to pay cash are more apt to buy homes in such an expensive housing market, when the income necessary to buy a home is higher than ever before, and elevated mortgage rates make buying a home in cash and avoiding interest altogether more attractive.
The weekly average 30-year fixed mortgage rate hit 7.2% in September, its highest level in two decades, and moved even higher in October, nearing 8% and pushing monthly mortgage payments up about 20% from a year ago to record highs. Rates have since come down a bit from their October highs, but they’re still more than double early-pandemic levels.
Rising rates are deterring homebuyers who take out mortgages more than they’re deterring all-cash buyers: Overall home sales are down 23% year over year in the metros included in this analysis, compared with an 11% decline for all-cash sales. It’s worth noting that high rates can also be a deterrent for buyers who can afford to pay in cash, because they could get better returns on their money by investing it somewhere besides the housing market. That’s especially true when home prices are high and there’s potential for them to come down.
“High mortgage rates are exacerbating inequality between people who own homes and people who don’t,” said Redfin Senior Economist Sheharyar Bokhari. “Home prices are roughly 40% higher now than before the pandemic homebuying boom, and soaring mortgage rates have made the divide even bigger by adding more to monthly payments. Affluent Americans are the only ones who can avoid the sting of high mortgage rates; plus, they’re spending less on housing and keeping more money in the bank because they’re avoiding interest payments. Meanwhile, those who are sidelined by high prices and rates not only can’t afford a home now, but they’re not building wealth through homeownership for the future.”
Buyers may get a bit of a break on affordability next year, as home prices are likely to soften at least slightly in light of high mortgage rates and limited demand.
The last time all-cash purchases were this common was in 2014. At that time, affluent buyers and corporate investors who could afford to pay cash were leading the housing market recovery from the subprime mortgage crisis, while would-be first-time homebuyers were still suffering the effects of the Great Recession.
See the table at the bottom of this report for metro-level data on all-cash purchases.
Buyers are making bigger down payments to soften the blow of high mortgage rates
The typical U.S. homebuyer’s down payment was equal to 16.1% of the purchase price in September, up from 15% a year earlier and the highest down-payment percentage since June 2022.
In dollar terms, the median down payment was $60,980. That’s up roughly 15% from a year earlier, the biggest increase since June 2022.
High mortgage rates are fueling the uptick in down payments. Buyers are putting more money down to reduce their loan amount, which would result in slightly smaller monthly interest payments: The more money a homebuyer puts down, the less they’re paying interest on. For example, a buyer who purchases the median-priced U.S. home ($413,000) with a 16% down payment would have a monthly payment of $3,107 at today’s 7.76% mortgage rate. A buyer who puts 10% down on that same home with that same rate would have a monthly payment of $3,300, roughly $200 higher.
Some buyers are able to make relatively large down payments because they’re using equity from their previous home. The share of homes being sold to first-time buyers is declining as it becomes harder to afford a home without selling another one and taking out the equity.
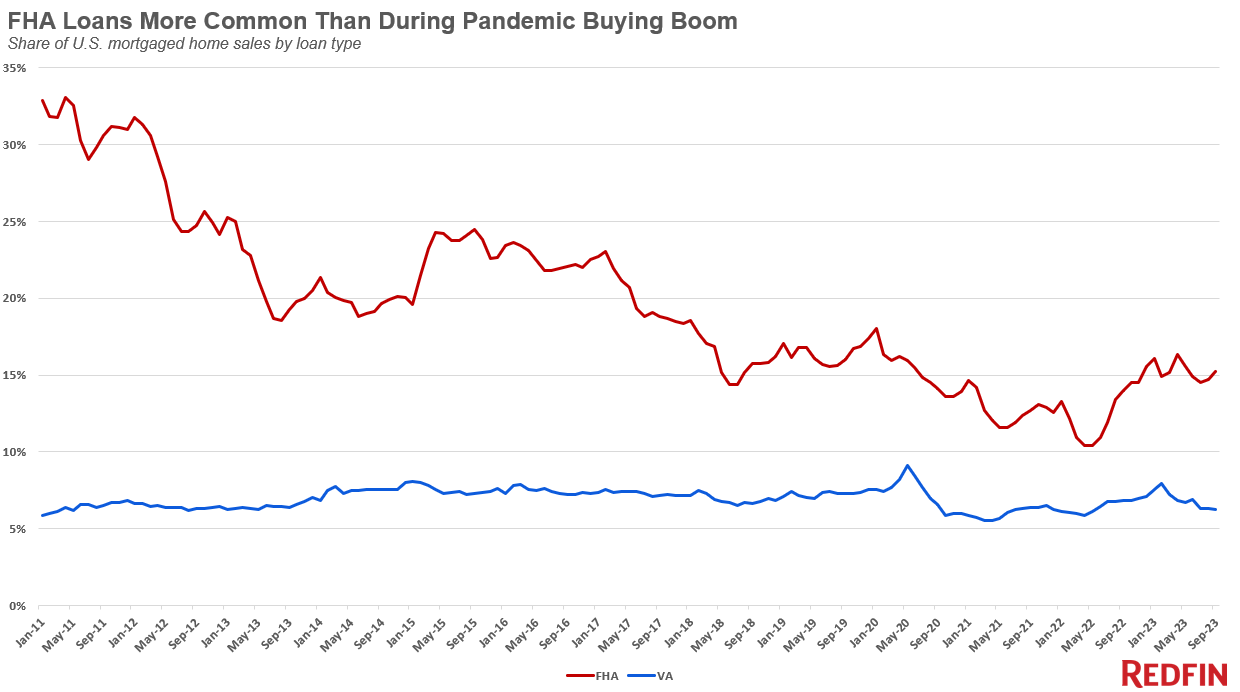
FHA loans are more common than during the pandemic homebuying boom because sellers receive fewer offers
Just over 15% of U.S. mortgaged home sales used an FHA loan in September, up from 14% a year earlier but down from the three-year high of 16.3% hit in April. FHA loans are more common than they were during the pandemic homebuying boom (FHA loans made up roughly 12% of mortgages in late 2021), when sellers typically received multiple offers and chose one with a higher down payment because they believed they were less likely to fall through. Buyers are more likely to get FHA offers accepted now because sellers typically have fewer offers.
About one of every 16 (6.3%) mortgaged home sales used a VA loan, down just marginally from 6.8% a year earlier. The share of home sales using a VA loan typically doesn’t change much over time, though it fluctuated more than usual during the topsy-turvy pandemic market. It was common for about 7% of mortgaged home sales to use a VA loan before the pandemic. The share rose to 9% in spring 2020 when the market suddenly cooled, allowing buyers with lower down payments to make their move, and dropped to 5.5% in spring 2021 as the market burned hot.
FHA and VA loans are both insured by the U.S. government. FHA loans, meant for low- to moderate-income borrowers and popular with first-time homebuyers, have lower down-payment and credit-score requirements than conventional loans. VA loans are available to veterans, service members and their surviving spouses and require little to no down payment.
Conventional loans are the most common type, making up nearly 8 of every 10 (78.5%) mortgaged home sales, down slightly from 79.2% a year earlier.
Metro-level highlights, September 2023
This section is based on Redfin’s analysis of 40 of the most populous U.S. metropolitan areas.
-
- All cash. All-cash purchases were most common in Cleveland, where 49.2% of buyers paid cash. Next came West Palm Beach, FL (49%) and Jacksonville, FL (46.2%). They were least common in Oakland, CA (18%), San Jose, CA (18.2%) and Seattle (20.3%), all quite expensive housing markets.
- All cash, YoY. All-cash purchases increased from a year earlier in nearly all (36) of the metros Redfin analyzed. They increased most in Pittsburgh (13.3 pts.), Baltimore (11.2 pts.) and Denver (10.1 pts.). They declined in Providence, RI (-2.5 pts.), Fort Lauderdale, FL (-0.5 pts.) and Portland, OR (-0.3 pts.) and stayed the same in Milwaukee.
- Down payments. Down payments and down payment percentages were highest in San Francisco, San Jose and Anaheim, CA, all metros where the typical buyer put down 25% of the purchase price. Down payments were lowest in Virginia Beach, VA, Detroit and Pittsburgh, and down payment percentages were lowest in Virginia Beach (3%), Detroit (7.4%) and Philadelphia (8.9%).
- Down payments, YoY. Down payment dollar amounts increased in 35 of the 40 metros Redfin analyzed, dropping in Pittsburgh (-12.9%), Riverside, CA (-12.4%), Nashville, TN (-8.7%), Denver (-3%) and Cincinnati (-2.7%). The biggest increases were in Detroit (61.5%), Jacksonville (50.8%) and Washington, D.C. (49.6%). Down payment percentages dropped in just one metro (Nashville; -2.5 percentage points) and stayed the same in 19. Percentages increased most in Charlotte, NC, Sacramento, CA and Newark, NJ (5 pts. each).
- FHA loans. FHA loans were most common in Riverside (29.6%), Providence, RI (25%) and Las Vegas (22.9%). They were least common in San Francisco, San Jose and Anaheim (less than 4% each).
- FHA loans, YoY. The use of FHA loans increased in 28 of the 40 metros Redfin analyzed. It rose most in Nashville (9 percentage points), Tampa, FL (5.2 pts.) and Phoenix (4.6 pts.), and declined most in Detroit (-6.5 pts.), Cleveland (-6.4 pts.) and Warren, MI (-4.2 pts.).
- VA loans. VA loans were most common in Virginia Beach, VA (41%), Jacksonville (16.6%) and Washington, D.C. (15.2%), all of which have a major military presence. They were least common in San Francisco, San Jose and New York (less than 1% each).
- VA loans, YoY. VA loan usage increased in 12 of the metros Redfin analyzed. It rose most in New Brunswick, NJ, Washington, D.C. and Riverside (less than 1 percentage point each), and declined most in San Diego (-5.6 pts.), Las Vegas (-2.7 pts.) and Jacksonville (-2.3 pts.).
| Metro-Level Summary: Share of All-Cash Sales and Home Sales by Loan Type, Sept. 2023
Share of mortgaged home sales using each common loan type Share of home sales using all cash |
||||||
| U.S. metro area | Share of home sales using all cash | Share of home sales using all cash, YoY (in percentage points) | Share of mortgaged home sales using FHA loans | Share of mortgaged home sales using FHA loans, YoY (in percentage points) | Share of mortgaged home sales using VA loan | Share of mortgaged home sales using VA loan, YoY (in percentage points) |
| Anaheim, CA | 31.7% | 5.9 pts. | 3.5% | -0.7 pts. | 1.7% | -0.8 pts. |
| Atlanta, GA | 41.0% | 1.1 pts. | 20.4% | 2.7 pts. | 7.5% | 0.5 pts. |
| Baltimore, MD | 41.8% | 11.2 pts. | 18.6% | 0.3 pts. | 8.9% | -1.5 pts. |
| Charlotte, NC | 39.4% | 2.9 pts. | 12.9% | 1.9 pts. | 5.5% | -0.9 pts. |
| Chicago, IL | 26.8% | 3.2 pts. | 15.5% | -2.9 pts. | 2.9% | 0.1 pts. |
| Cincinnati, OH | 45.6% | 6.5 pts. | 15.9% | -0.3 pts. | 6.1% | 0.3 pts. |
| Cleveland, OH | 49.2% | 7.4 pts. | 13.6% | -6.4 pts. | 3.5% | -1.5 pts. |
| Columbus, OH | 32.7% | 3.0 pts. | 14.1% | 2.6 pts. | 4.4% | -1.3 pts. |
| Denver, CO | 36.5% | 10.1 pts. | 14.0% | 1.4 pts. | 6.3% | 0.1 pts. |
| Detroit, MI | 38.0% | 3.9 pts. | 20.3% | -6.5 pts. | 3.1% | 0.1 pts. |
| Fort Lauderdale, FL | 40.5% | -0.5 pts. | 17.2% | 4.0 pts. | 3.8% | -0.5 pts. |
| Jacksonville, FL | 46.2% | 3.2 pts. | 15.7% | 0.3 pts. | 16.6% | -2.3 pts. |
| Las Vegas, NV | 33.1% | 0.7 pts. | 22.9% | 2.5 pts. | 9.7% | -2.7 pts. |
| Los Angeles, CA | 22.7% | 3.2 pts. | 15.2% | 1.7 pts. | 2.6% | unchanged |
| Miami, FL | 40.7% | 2.0 pts. | 17.5% | 3.9 pts. | 2.0% | -0.7 pts. |
| Milwaukee, WI | 33.0% | unchanged | 10.6% | 0.3 pts. | 3.6% | -1.1 pts. |
| Minneapolis, MN | 29.7% | 6.5 pts. | 8.8% | -0.5 pts. | 3.4% | -1.0 pts. |
| Montgomery County, PA | 35.0% | 7.6 pts. | 7.6% | -0.7 pts. | 3.0% | -0.8 pts. |
| Nashville, TN | 40.1% | 6.6 pts. | 19.3% | 9.0 pts. | 6.7% | 0.1 pts. |
| New Brunswick, NJ | 33.4% | 6.5 pts. | 12.5% | 0.8 pts. | 2.7% | 0.7 pts. |
| New York, NY | 36.9% | 8.6 pts. | 10.2% | 0.1 pts. | 0.9% | -0.6 pts. |
| Newark, NJ | 26.8% | 7.6 pts. | 14.8% | -2.6 pts. | 2.9% | -0.2 pts. |
| Oakland, CA | 18.0% | 3.9 pts. | 9.3% | 2.7 pts. | 1.7% | -0.5 pts. |
| Orlando, FL | 40.0% | 0.6 pts. | 21.5% | 3.5 pts. | 6.5% | -0.4 pts. |
| Philadelphia, PA | 41.1% | 6.7 pts. | 17.6% | -2.5 pts. | 3.3% | 0.2 pts. |
| Phoenix, AZ | 30.0% | 1.2 pts. | 20.8% | 4.6 pts. | 7.2% | -1.1 pts. |
| Pittsburgh, PA | 41.2% | 13.3 pts. | 17.5% | 2.8 pts. | 4.1% | -1.3 pts. |
| Portland, OR | 24.3% | -0.3 pts. | 13.9% | 3.0 pts. | 4.2% | -1.7 pts. |
| Providence, RI | 24.6% | -2.5 pts. | 25.0% | 2.6 pts. | 6.2% | 0.1 pts. |
| Riverside, CA | 40.7% | 6.0 pts. | 29.6% | 3.6 pts. | 6.5% | 0.6 pts. |
| Sacramento, CA | 26.0% | 5.9 pts. | 15.0% | -0.4 pts. | 5.4% | -1.1 pts. |
| San Diego, CA | 24.9% | 7.0 pts. | 9.6% | 3.3 pts. | 12.0% | -5.6 pts. |
| San Francisco, CA | 26.0% | 5.2 pts. | 1.4% | 0.4 pts. | 0.2% | -0.2 pts. |
| San Jose, CA | 18.2% | 6.3 pts. | 2.4% | 0.1 pts. | 0.9% | 0.4 pts. |
| Seattle, WA | 20.3% | 2.6 pts. | 6.6% | 1.1 pts. | 3.2% | unchanged |
| Tampa, FL | 38.2% | 0.2 pts. | 20.7% | 5.2 pts. | 9.8% | -1.6 pts. |
| Virginia Beach, VA | 23.4% | 2.0 pts. | 14.3% | -0.4 pts. | 41.0% | -0.6 pts. |
| Warren, MI | 35.8% | 4.9 pts. | 9.3% | -4.2 pts. | 4.5% | -0.2 pts. |
| Washington, DC | 26.2% | 5.7 pts. | 13.9% | 0.6 pts. | 15.2% | 0.7 pts. |
| West Palm Beach, FL | 49.0% | 0.8 pts. | 15.5% | 1.4 pts. | 3.0% | -1.8 pts. |
| Metro-Level Summary: Down Payments, Sept. 2023
Median down payments, in dollars and percentages |
||||
| U.S. metro area | Median down payment (dollars) | Median down payment (dollars), YoY | Median down payment (percentage) | Median down payment (percentage), YoY, in percentage points |
| Anaheim, CA | $255,000 | 17.0% | 25.0% | 5.0 pts. |
| Atlanta, GA | $38,041 | 22.7% | 10.0% | unchanged |
| Baltimore, MD | $31,295 | 27.3% | 10.0% | 4.1 pts. |
| Charlotte, NC | $57,000 | 48.8% | 15.0% | 5.0 pts. |
| Chicago, IL | $35,775 | 14.6% | 10.0% | unchanged |
| Cincinnati, OH | $21,998 | -2.7% | 10.0% | unchanged |
| Cleveland, OH | $24,250 | 36.2% | 10.0% | 0.6 pts. |
| Columbus, OH | $35,874 | 23.1% | 10.0% | unchanged |
| Denver, CO | $80,000 | -3.0% | 15.8% | 0.8 pts. |
| Detroit, MI | $16,250 | 61.5% | 7.4% | 2.4 pts. |
| Fort Lauderdale, FL | $60,000 | 1.7% | 20.0% | unchanged |
| Jacksonville, FL | $40,032 | 50.8% | 10.0% | 1.2 pts. |
| Las Vegas, NV | $38,000 | 8.6% | 10.0% | unchanged |
| Los Angeles, CA | $169,375 | 6.3% | 20.0% | unchanged |
| Miami, FL | $80,000 | 9.8% | 20.0% | unchanged |
| Milwaukee, WI | $33,029 | 10.1% | 11.9% | 1.9 pts. |
| Minneapolis, MN | $44,985 | 22.6% | 13.0% | 3.0 pts. |
| Montgomery County, PA | $80,000 | 28.0% | 20.0% | 0.7 pts. |
| Nashville, TN | $49,287 | -8.7% | 12.2% | -2.5 pts. |
| New Brunswick, NJ | $100,000 | 15.9% | 20.0% | unchanged |
| New York, NY | $189,900 | 15.1% | 20.4% | 0.4 pts. |
| Newark, NJ | $95,096 | 37.5% | 20.0% | 5.0 pts. |
| Oakland, CA | $210,000 | 9.3% | 20.0% | unchanged |
| Orlando, FL | $45,000 | 1.6% | 11.0% | 0.8 pts. |
| Philadelphia, PA | $21,000 | 1.8% | 8.9% | 3.3 pts. |
| Phoenix, AZ | $46,500 | 1.6% | 10.0% | unchanged |
| Pittsburgh, PA | $16,940 | -12.9% | 10.0% | unchanged |
| Portland, OR | $90,159 | 12.3% | 20.0% | 4.3 pts. |
| Providence, RI | $40,000 | 0.0% | 10.0% | unchanged |
| Riverside, CA | $43,800 | -12.4% | 10.0% | unchanged |
| Sacramento, CA | $91,900 | 25.4% | 20.0% | 5.0 pts. |
| San Diego, CA | $170,000 | 25.9% | 20.0% | unchanged |
| San Francisco, CA | $400,000 | 7.3% | 25.1% | 0.1 pts. |
| San Jose, CA | $378,500 | 18.3% | 25.0% | 5.0 pts. |
| Seattle, WA | $167,172 | 11.4% | 20.0% | unchanged |
| Tampa, FL | $40,330 | 4.3% | 10.0% | unchanged |
| Virginia Beach, VA | $7,380 | 5.4% | 3.0% | unchanged |
| Warren, MI | $33,000 | 34.7% | 10.6% | 0.6 pts. |
| Washington, DC | $54,800 | 49.6% | 10.0% | 1.6 pts. |
| West Palm Beach, FL | $75,000 | 8.7% | 20.0% | unchanged |


