
- The typical U.S. homebuyer made a $42,000 down payment in January, the lowest level in nearly two years, amid rising mortgage rates and low competition
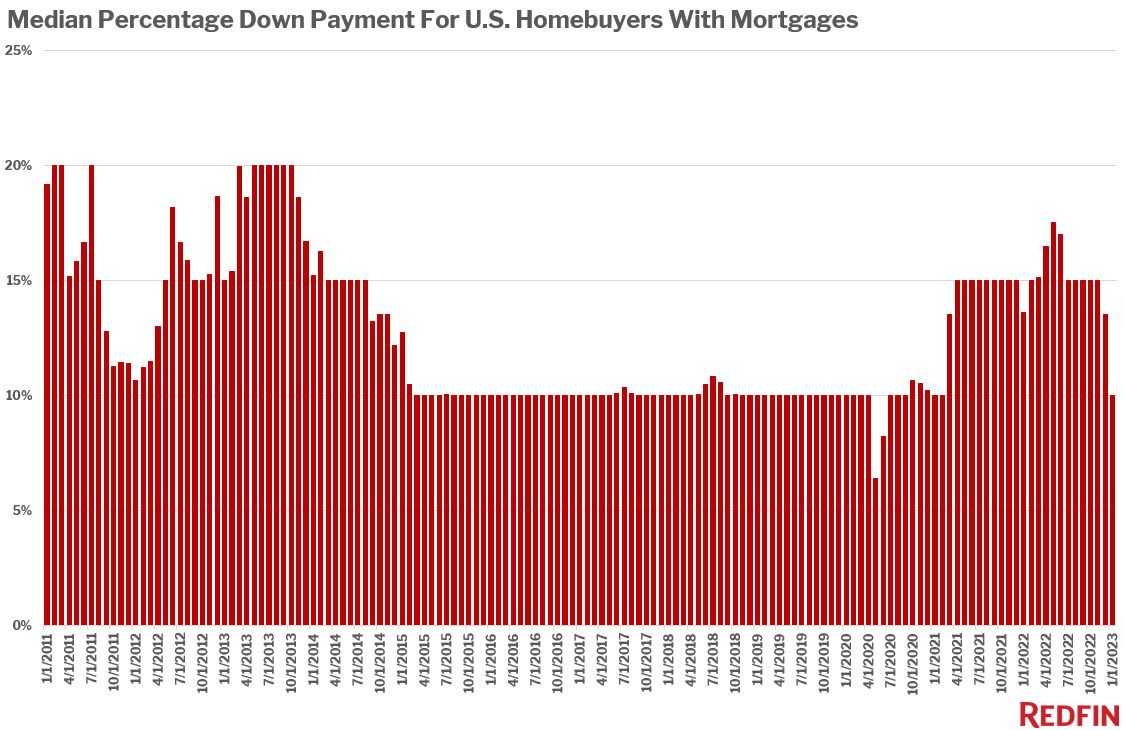
- The median down payment was equal to 10% of the purchase price, down from 14% a year earlier.
- Nearly one-third home purchases were paid for in cash, the highest share in nine years.
- The share of borrowers using FHA and VA loans to fund home purchases reached the highest level in over two years.
The typical U.S. homebuyer’s down payment fell 10% year over year in January to $42,375, its lowest level in nearly two years, amid dwindling competition and high mortgage rates. The median down payment was down 35% from the peak it reached in June, but still up more than 30% from pre-pandemic levels.
January marks the third straight month in which down payments fell year over year.

The median down payment in January was equal to 10% of the purchase price, down from 13.6% a year earlier and the pandemic-era peak of 17.5% in May. The last time down-payment percentages were this low was early 2021, before the pandemic homebuying boom drove buyers to put more money down to make their offers more attractive.
The data in this report is from a Redfin analysis of county records across 40 of the most populous U.S. metropolitan areas. January 2023 is the most recent month for which data is available. The down-payment data is limited to homebuyers who took out a mortgage.
Down payments are falling for several reasons:
- The housing market is slow and there’s not much competition. Most offers for homes written by Redfin agents don’t face bidding wars. That’s a stark difference from the hyper-competitive housing market of 2021 and early 2022. Buyers no longer need to offer a big down payment to prove their financial stability and stand out from the crowd. Now that buyers often have the upper hand, they can offer an amount that works best for their individual circumstances. Diminished competition is also allowing more buyers to use FHA and VA loans, which typically allow for much smaller down payments.
- High housing costs and inflation. 6%-plus mortgage rates, still-high home prices and inflation are hitting homebuyers’ pocketbooks hard. Buyers don’t have as much money to allocate to a down payment because their monthly housing payments are higher than before; they may also be putting cash toward a mortgage-rate buydown instead of their down payment. Additionally, buyers may be inclined to hold onto as much cash as possible in these uncertain economic times.
- Lower home prices = lower dollar down payments. Home prices remain stubbornly high, but they have fallen more than 10% from their May 2022 peak and 1.5% from a year ago. A 10% down payment on a $400,000 home equals $40,000; if that same home was worth $450,000 in May, the buyer would have needed $45,000 for a 10% down payment.
“One silver lining of high mortgage rates and economic turmoil is that they’ve slowed competition,” said Redfin Senior Economist Sheharyar Bokhari. “That means buyers are often able to purchase a home without facing a bidding war and don’t need to fork over a huge portion of their savings for a down payment to grab sellers’ attention. Today’s buyers are also able to save money in other ways: Nearly half of sellers are offering concessions, like helping pay for a mortgage-rate buydown or covering closing costs, to attract buyers.”
Scroll to the bottom of this report for metro-level data on median down payments.
Share of homes bought in cash hits nine-year high
Nearly one-third (32.1%) of U.S. home purchases were paid for with all cash in January, up from 29.7% a year earlier and the highest share in nine years.
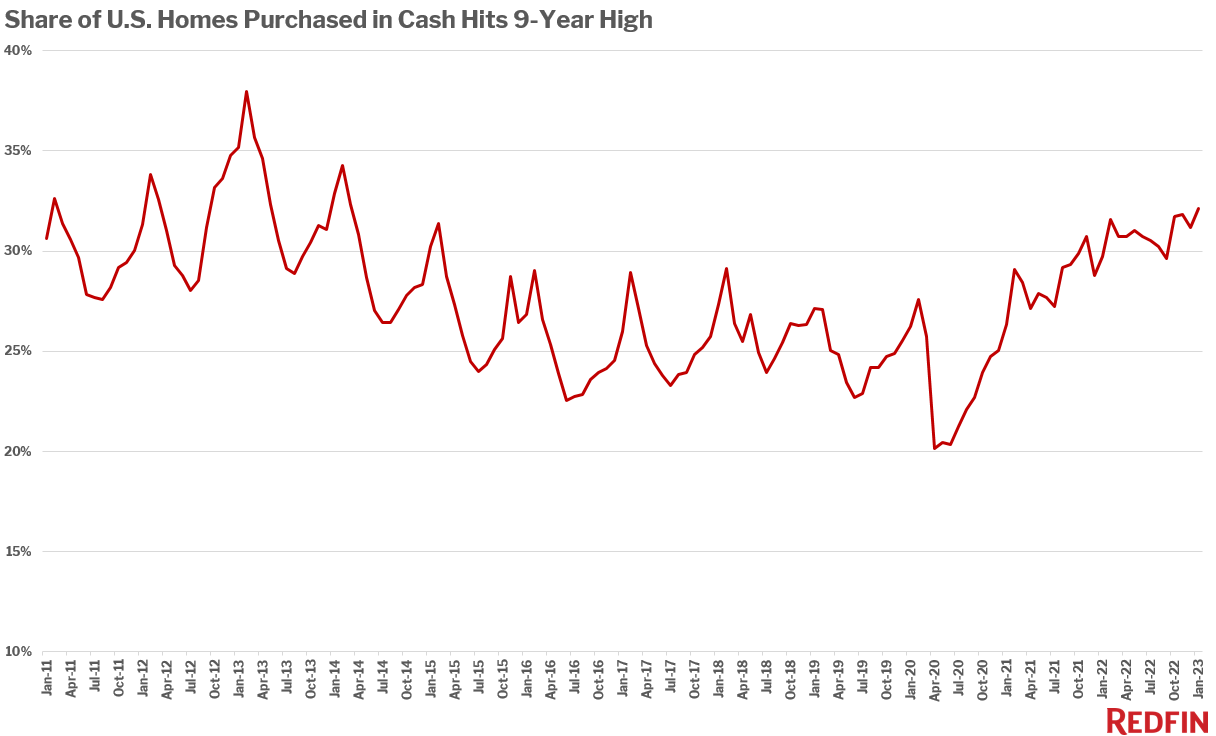
An all-cash purchase is one in which there is no mortgage loan information on the deed.
Buyers—especially affluent ones—are increasingly paying in cash to avoid taking on a high mortgage rate. Cash purchases were also common during the homebuying frenzy of 2021 and early 2022, but for a different reason: Buyers back then were offering cash to beat out the competition.
FHA, VA loans are more prevalent in today’s slow housing market
Sixteen percent of mortgaged home sales used an FHA loan in January, up from 13.3% a year earlier and the highest share since April 2020. The share of mortgaged sales using VA loans rose to their highest level in more than two years, climbing to 7.5% from 6.1% a year earlier.
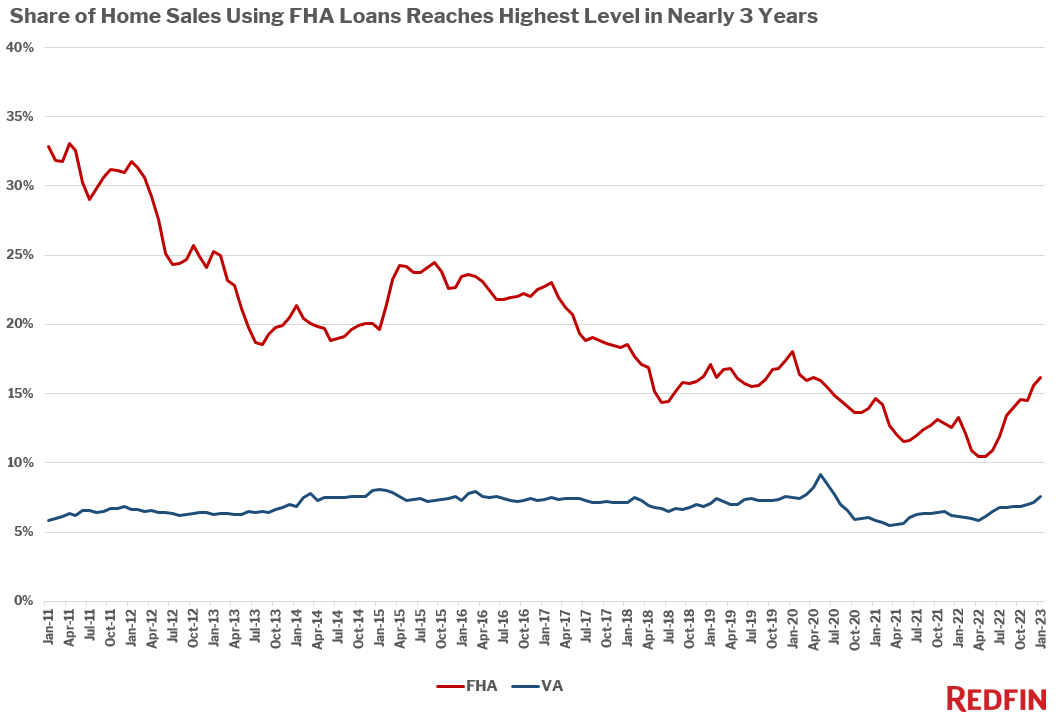
FHA and VA loans, which typically allow for lower down payments than conventional loans, have become more prevalent as the market has cooled and affordability has waned. Most sellers are receiving just one offer for their home–a reversal from the hyper-competitive pandemic housing market–making sellers much more likely to accept FHA and VA loans. Sellers can’t afford to be picky about loan types if they receive just one offer.
FHA and VA loans are both insured by the U.S. government. FHA loans, meant for low- to moderate-income borrowers and popular with first-time homebuyers, have lower down-payment and credit-score requirements than conventional loans. VA loans are available to veterans, service members and their surviving spouses and require little to no down payment. Conventional loans are not insured by the government.
Conventional loans are still by far the most common type. More than three-quarters (76.3%) of borrowers used a conventional loan–but that’s the lowest share since June 2020.
Metro-level highlights: down payments, all-cash purchases, FHA/VA loans
The data below is from January 2023, the most recent month for which data is available, and covers 40 of the most populous U.S. metros.
-
- Down payments: Down-payment percentages were highest in San Francisco, where the typical homebuyer put down 25% of the purchase price. It’s followed by 10 metros with 20% median down payments: Anaheim, CA, San Jose, CA, New York, Oakland, CA, Los Angeles, Seattle, San Diego, New Brunswick, NJ, Miami and West Palm Beach, FL. Down-payment percentages were lowest in Virginia Beach, VA, where the typical homeowner put down 1.8% of the purchase price (that’s largely because so many Virginia Beach buyers use VA loans). It’s followed by five metros with a 5% median: Detroit, Baltimore, Atlanta, Washington, DC and Pittsburgh.
- Down payments, YoY: Down payment percentages increased in just two metros: Newark, NJ, where the typical homebuyer put down 19% of the purchase price, up from roughly 12.5% a year earlier, and San Francisco (25%, up from 23.3%). They declined most in Sacramento (12.4%, down from 20%), Atlanta (5%, down from 10%) and Orlando, FL (10%, down from 15%).
- All cash: All-cash purchases were most prevalent in West Palm Beach, FL, where 52.5% of purchases were made in cash. It’s followed by Cleveland (51.5%) and Jacksonville, FL (46.6%). They were least common in Oakland (13.9%), Seattle (19.7%) and Los Angeles (19.9%).
- All cash, YoY: The share of homes purchased in all cash increased most in Cleveland (17.2 pts.), Riverside, CA (14.8 pts.) and Baltimore (11 pts.). The biggest declines were in Atlanta (-10.7 pts.), Tampa, FL (-4.5 pts.) and Charlotte, NC (-4.3 pts.).
- FHA loans: FHA loans were most prevalent in Detroit (29.5% of mortgaged home sales used an FHA loan), Riverside, CA (26.7%) and Providence, RI (23.8%), and least common in San Francisco (1.3%), San Jose (1.6%) and Anaheim, CA (2.3%).
- FHA loans, YoY: The use of FHA loans increased most in Las Vegas (9.7 pts.), Riverside, CA (9.6 pts.) and Phoenix (8.9 pts.), and declined most in Newark, NJ (-2.5 pts.), Providence, RI (-2.1 pts.) and New York (-2.1 pts.)
- VA loans: VA loans were most prevalent in Virginia Beach, VA (43.7% of mortgaged home sales used a VA loan), Jacksonville (18.5%) and San Diego (17.9%), and least common in San Francisco (1%), San Jose (1.1%) and New York (1.9%).
- VA loans, YoY: The use of VA loans increased most in Virginia Beach (6 pts.), Washington, DC (4.8 pts.) and San Diego (4 pts.), and declined most in Nashville (-1.3 pts.), Detroit (-1.2 pts.) and Baltimore (-0.7 pts.).
| Metro-level summary: Down payments, January 2023 | ||||
| U.S. metro area | Median down payment (in dollars) | Median down payment (in dollars), YoY | Median down payment (percentage) | Median down payment (percentage), YoY |
| Anaheim, CA | $ 215,000 | -2.3% | 20% | 0 pts. |
| Atlanta, GA | $ 21,500 | -28.3% | 5% | -5 pts. |
| Baltimore, MD | $ 19,750 | -1.2% | 5% | 0 pts. |
| Charlotte, NC | $ 32,500 | -5.2% | 10% | 0 pts. |
| Chicago, IL | $ 27,500 | 1.9% | 10% | 0 pts. |
| Cincinnati, OH | $ 18,535 | -7.2% | 9% | -0.1 pts. |
| Cleveland, OH | $ 14,999 | 0.0% | 8% | 0 pts. |
| Columbus, OH | $ 20,723 | -4.3% | 5.7% | -3.4 pts. |
| Denver, CO | $ 60,000 | -10.9% | 10.3% | -3.3 pts. |
| Detroit, MI | $ 8,000 | -20.0% | 5% | 0 pts. |
| Fort Lauderdale, FL | $ 47,250 | -3.3% | 16.9% | -3.1 pts. |
| Jacksonville, FL | $ 28,150 | -7.6% | 10% | 0 pts. |
| Las Vegas, NV | $ 25,106 | -43.3% | 6% | -4.6 pts. |
| Los Angeles, CA | $ 141,044 | -8.4% | 20% | 0 pts. |
| Miami, FL | $ 71,250 | 5.6% | 20% | 0 pts. |
| Milwaukee, WI | $ 22,825 | -10.6% | 10% | 0 pts. |
| Minneapolis, MN | $ 30,000 | 5.1% | 10% | 0 pts. |
| Montgomery County, PA | $ 60,000 | 7.0% | 16.2% | -2.8 pts. |
| Nashville, TN | $ 40,005 | -19.5% | 10% | -5 pts. |
| New Brunswick, NJ | $ 83,000 | 22.1% | 20% | 0 pts. |
| New York, NY | $ 161,000 | 19.3% | 20% | 0 pts. |
| Newark, NJ | $ 75,000 | 50.0% | 18.7% | 7.5 pts. |
| Oakland, CA | $ 147,600 | -17.3% | 20% | 0 pts. |
| Orlando, FL | $ 35,500 | -22.8% | 10% | -5 pts. |
| Philadelphia, PA | $ 21,750 | -14.4% | 8.8% | -1.2 pts. |
| Phoenix, AZ | $ 35,775 | -38.3% | 10% | -5 pts. |
| Pittsburgh, PA | $ 12,500 | -19.0% | 5% | 0 pts. |
| Portland, OR | $ 66,475 | 1.4% | 15% | 0 pts. |
| Providence, RI | $ 35,670 | 18.9% | 10% | 0 pts. |
| Riverside, CA | $ 38,774 | -38.4% | 9.7% | -2 pts. |
| Sacramento, CA | $ 58,254 | -32.5% | 12.4% | -7.6 pts. |
| San Diego, CA | $ 124,000 | -6.1% | 20% | 0 pts. |
| San Francisco, CA | $ 325,000 | -7.5% | 25% | 1.7 pts. |
| San Jose, CA | $ 300,000 | -3.2% | 20% | 0 pts. |
| Seattle, WA | $ 128,165 | 0.9% | 20% | 0 pts. |
| Tampa, FL | $ 32,250 | -14.4% | 10% | -0.9 pts. |
| Virginia Beach, VA | $ 5,362 | -11.5% | 1.8% | -0.2 pts. |
| Warren, MI | $ 20,600 | -6.4% | 8.4% | -1.6 pts. |
| Washington, DC | $ 27,000 | -5.1% | 5% | 0 pts. |
| West Palm Beach, FL | $ 67,500 | 3.8% | 20% | 0 pts. |
| National | $ 42,375 | -10.3% | 10% | -3.6 pts. |
| Metro-level summary: All cash & loan types, January 2023 | ||||||
| U.S. metro area | Share of home purchases using all cash | Share of home purchases using all cash, YoY | Share of mortgaged home sales using FHA loan | Share of mortgaged home sales using FHA loan, YoY | Share of mortgaged home sales using VA loan | Share of mortgaged home sales using VA loan, YoY |
| Anaheim, CA | 26.1% | 3.3 pts. | 2.3% | 0.8 pts. | 3.1% | 1.7 pts. |
| Atlanta, GA | 35.1% | -10.7 pts. | 22.2% | 7.5 pts. | 8.6% | 2 pts. |
| Baltimore, MD | 34.6% | 11 pts. | 23.2% | 2.9 pts. | 9.5% | -0.7 pts. |
| Charlotte, NC | 38.4% | -4.3 pts. | 12.2% | 1.3 pts. | 8.6% | 2.8 pts. |
| Chicago, IL | 25.6% | 4.6 pts. | 19.2% | -0.1 pts. | 3.5% | 0.5 pts. |
| Cincinnati, OH | 41.0% | 10.2 pts. | 17.9% | -1 pts. | 6.0% | 0.5 pts. |
| Cleveland, OH | 51.1% | 17.2 pts. | 20.9% | -0.3 pts. | 7.7% | 2.1 pts. |
| Columbus, OH | 29.6% | -2.6 pts. | 14.9% | 0.2 pts. | 6.6% | 2.3 pts. |
| Denver, CO | 27.7% | 4.7 pts. | 12.8% | 3.4 pts. | 7.0% | 1 pts. |
| Detroit, MI | 36.2% | 1.6 pts. | 29.5% | 4.5 pts. | 3.4% | -1.2 pts. |
| Fort Lauderdale, FL | 45.1% | 4.8 pts. | 17.6% | 5 pts. | 5.3% | 2.3 pts. |
| Jacksonville, FL | 46.6% | -0.4 pts. | 15.5% | 1.9 pts. | 18.5% | 2.9 pts. |
| Las Vegas, NV | 34.2% | -1 pts. | 22.1% | 9.7 pts. | 13.0% | 3.1 pts. |
| Los Angeles, CA | 19.9% | 1.9 pts. | 14.0% | 3.5 pts. | 2.8% | 0.4 pts. |
| Miami, FL | 45.6% | 7.2 pts. | 15.3% | 3.5 pts. | 3.3% | 1.6 pts. |
| Milwaukee, WI | 34.3% | 2.6 pts. | 13.7% | 1.6 pts. | 5.4% | 1.1 pts. |
| Minneapolis, MN | 29.6% | 7.6 pts. | 12.6% | 1.6 pts. | 5.8% | 1 pts. |
| Montgomery County, PA | 26.8% | 0.7 pts. | 9.1% | 0.3 pts. | 4.1% | 1.1 pts. |
| Nashville, TN | 34.9% | -0.5 pts. | 14.5% | 4.2 pts. | 5.3% | -1.3 pts. |
| New Brunswick, NJ | 32.7% | 7.5 pts. | 12.2% | -0.8 pts. | 2.7% | 0.4 pts. |
| New York, NY | 32.0% | 8 pts. | 10.2% | -2.1 pts. | 1.9% | 0.6 pts. |
| Newark, NJ | 26.1% | 5.1 pts. | 17.8% | -2.5 pts. | 2.1% | -0.3 pts. |
| Oakland, CA | 13.9% | 1.7 pts. | 9.4% | 3.8 pts. | 2.8% | 0.8 pts. |
| Orlando, FL | 38.6% | -1.2 pts. | 20.6% | 8.9 pts. | 7.2% | 1.3 pts. |
| Philadelphia, PA | 37.4% | 7 pts. | 21.5% | 3.7 pts. | 3.4% | 0.6 pts. |
| Phoenix, AZ | 29.6% | -3 pts. | 17.8% | 8.9 pts. | 9.1% | 2.3 pts. |
| Pittsburgh, PA | 33.4% | 9.5 pts. | 19.4% | 4.7 pts. | 6.2% | 2.7 pts. |
| Portland, OR | 29.5% | 8.2 pts. | 11.2% | 3.1 pts. | 5.8% | 0 pts. |
| Providence, RI | 25.9% | 5.5 pts. | 23.8% | -2.1 pts. | 5.5% | -0.6 pts. |
| Riverside, CA | 37.1% | 14.8 pts. | 26.7% | 9.6 pts. | 7.9% | 0.9 pts. |
| Sacramento, CA | 23.7% | 2.4 pts. | 16.9% | 6 pts. | 7.9% | 1.9 pts. |
| San Diego, CA | 20.6% | 2.3 pts. | 7.0% | 1.9 pts. | 17.9% | 4 pts. |
| San Francisco, CA | 24.4% | 3.0 pts. | 1.3% | 0.8 pts. | 1.0% | -0.3 pts. |
| San Jose, CA | 20.8% | 6.5 pts. | 1.6% | 0.3 pts. | 1.1% | 0.3 pts. |
| Seattle, WA | 19.7% | 2.4 pts. | 5.7% | 2.8 pts. | 4.1% | 1.5 pts. |
| Tampa, FL | 38.5% | -4.5 pts. | 17.5% | 5.9 pts. | 11.4% | 2.3 pts. |
| Virginia Beach, VA | 20.9% | -0.3 pts. | 14.4% | -0.5 pts. | 43.7% | 6 pts. |
| Warren, MI | 28.7% | 0.6 pts. | 14.8% | 0.2 pts. | 4.0% | 0.2 pts. |
| Washington, DC | 22.1% | 3.5 pts. | 17.2% | 0.1 pts. | 16.9% | 4.8 pts. |
| West Palm Beach, FL | 52.5% | -3.3 pts. | 14.4% | 3.8 pts. | 3.5% | -0.1 pts. |
| National | 32.1% | 2.4 pts. | 16.1% | 2.9% pts. | 7.5% | 1.4 pts. |


