
Homes in rural areas are selling a month faster than last year, and prices are up 16%.
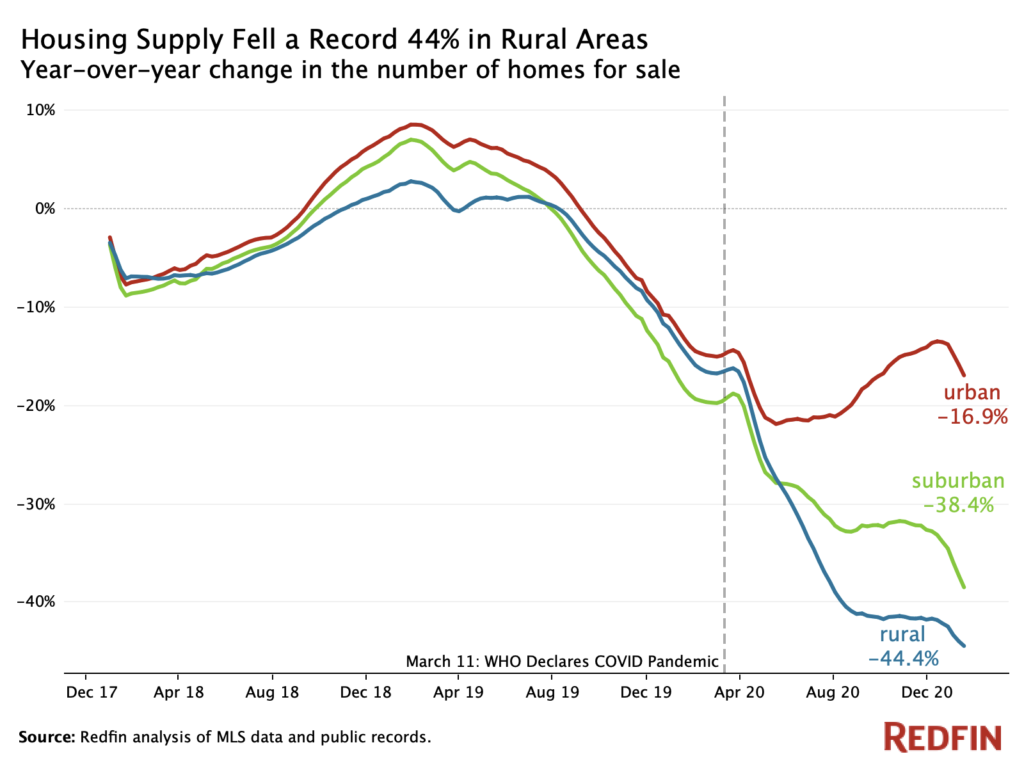
The number of homes for sale in rural areas nationwide declined a record 44.4% year over year in the four weeks ending January 21, and fell 38.4% in suburban areas. Those mark the biggest annual inventory drops since Redfin started tracking this data in 2017.
The shortage of homes for sale is more severe in rural and suburban neighborhoods than urban areas. In urban neighborhoods, the number of homes for sale dipped 16.9% over the same time period, less severe than the 21.5% drop seen in May and June.
“The scarcity of rural and suburban homes for sale is driving the overall housing supply shortage. Many homeowners are staying put, and homes in those neighborhoods are snapped up as soon as they’re listed for sale,” said Redfin chief economist Daryl Fairweather. “Homes in rural and suburban areas remain popular as the pandemic and remote work continue to motivate buyers to prioritize indoor and outdoor space over commute times and urban amenities.”
“Buyers looking for homes in urban areas–where supply is down, but not by as much–will have more luck than buyers searching outside the city,” Fairweather continued. “Developers are focusing on creating new homes outside city centers, where there’s more room for sprawl, but that could mean the shortage in urban areas will worsen over time, with fewer homes being built.”
The total number of homes for sale fell a record 34% year over year in the four weeks ending January 17, and new listings were down 10%, the biggest drop in seven months.
New listings of homes for sale were down 6.3% year over year in rural areas during the four weeks ending January 21, and they were down 5.6% in suburban neighborhoods. Meanwhile, new listings in urban areas were up 1% from the year before.
New listings dropped by nearly 50% year over year in all three neighborhood types in the four weeks ending April 20, at the onset of the coronavirus pandemic. They were on an upswing in the fall before starting to see declines again in rural and suburban neighborhoods.
The lack of new listings and a surge in demand—pending sales were up 43.5% in rural areas, 35.1% in suburban areas and 32.4% in urban areas during the four weeks ending January 21—have contributed to the severe housing shortages.
| National Housing Market Summary, Rural/Suburban/Urban, Four Weeks Ending January 21, 2021 | |||
| Rural areas | Suburban areas | Urban areas | |
| Median sale price | $290,592 | $330,230 | $288,000 |
| Median sale price, YoY | +16% | +14.5% | +15.2% |
| Median price per square foot | $149.82 | $170.43 | $184.82 |
| Median price per square foot, YoY | 14.7% | 14.1% | 15% |
| Home sales, YoY | 18.3% | 23.5% | 21.6% |
| Pending sales, YoY | 43.5% | 35.1% | 32.4% |
| Number of homes for sale, YoY | -44.4% | -38.4% | -16.9% |
| New listings, YoY | -6.3% | -5.6% | 1% |
| Median days on market | 39 | 30 | 36 |
| Median days on market, YoY | -29 | -22 | -14 |
Homes in suburban areas are selling fastest, and homes in rural areas are selling nearly a month faster than last year
The typical home in a rural area spent 39 days on the market before going under contract in the four weeks ending January 21, versus 30 days in suburban areas and 36 days in urban areas.
Homes in rural areas are selling 29 days faster than a year ago. Homes in suburban areas are selling 22 days faster than last year, and in urban areas they’re selling 14 days faster.
Median sale prices are up by double digits in rural, suburban and urban neighborhoods
The median home-sale price in rural areas rose 16% year over year to $290,592 in the four weeks ending January 21, not quite as big as the 17.7% peak annual increase in November.
In suburban neighborhoods, home prices rose 14.5% year over year to a median $330,230, and in urban neighborhoods prices were up 15.2% to $288,000. Those are both the biggest annual increases since at least 2017. While the median sale price in urban areas is lower than it is in suburban and rural areas, the median price per square foot is higher in urban areas: $184.82 versus $170.43 in the suburbs and $149.82 in rural neighborhoods.
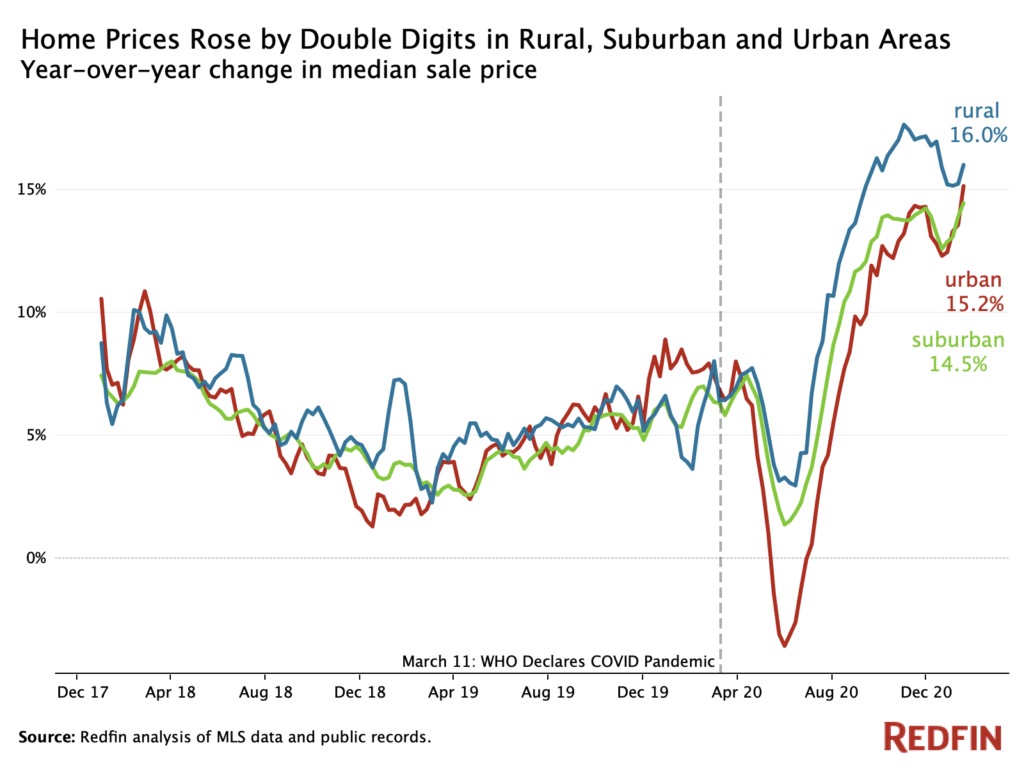
The record home-price growth for urban neighborhoods marks an about-face from the spring, when home prices fell 3.6% year over year in the four weeks ending May 20 before bouncing back in July. Median home prices in rural and suburban areas never fell from the year before, though they did grow only marginally in May and June.
While rural and suburban areas are still hot with homebuyers, urban areas have made a comeback. That’s likely due both to renewed optimism about the return of city life with vaccinations rolling out and the comparatively severe shortage of homes for sale in rural and suburban areas.
Total home sales were up 18.3% in rural areas during the four weeks ending January 21, and they were up 23.5% and 21.6% in suburban and urban areas, respectively. Although home sales dropped significantly in all three neighborhood types in the spring, sales have been growing on a year-over-year basis since September.
Pageviews of homes in rural areas, small towns and large metros are up from a year ago—but down from the pandemic-driven peak over the summer
Pageviews of homes in rural areas on Redfin.com increased 110% year over year in December 2020. Although that means rural homes got twice as many views as the year before, it’s a deceleration from a 273% peak in August and the smallest year-over-year increase since February 2020, the month before the pandemic led to significant homebuyer interest in rural properties.
“Some of the initial boom in homebuyer interest in rural areas was driven by people daydreaming about an escape from densely packed cities at the height of the pandemic,” said Redfin economist Taylor Marr. “But views of homes in rural areas remain well above pre-pandemic levels, and some of that interest has translated into a surge of home sales in rural areas.”

The story is similar for small towns, where pageviews of homes rose 86% year over year in December, down from a 233% peak in September and the smallest annual increase since April.
In metro areas with a population of more than 1 million—which include both urban and suburban neighborhoods—pageviews of homes were up 59% from the year before in December. Pageviews of homes in large metros hit a peak 200% annual increase in October, nearly catching up to the increases seen in rural areas and small towns after lagging behind throughout the spring and summer.
Methodology
The housing market data in this report divides rural, suburban and urban based on categories from the U.S. Department of Housing and Urban Development, which built a model to describe neighborhood types based on responses to the 2017 American Housing Survey.
Note that the categories in the section about Redfin.com pageviews are different from the categories in the section on Redfin housing market data. The pageviews section divides areas into large metro areas (metro areas with a population of more than 1 million, which includes both urban and suburban neighborhoods), small towns and rural areas, while the Redfin housing market section divides areas into rural, suburban and urban neighborhoods.


