
People are staying put longer as rising home prices, a housing shortage and skyrocketing coronavirus cases—especially in senior-living facilities—make moving less attractive for some Americans. But a handful of migration hotspots, including Charlotte, Tampa and Atlanta, are bucking the national trend.
A record 25.1% of U.S. homeowners in 2020 have lived in the same home for more than 20 years, up from 14.3% in 2010 and 8.6% in 2005, as rising home prices over the last two decades have made it more beneficial for Americans to stay put.
In 2020, the typical homeowner had been in their home for 13 years, up from 8.7 years in 2010 and 6.4 years in 2005. That also marks a slight increase from 12.8 years in 2019.
While scores of Americans are on the move because they’re no longer tied to the office, many others are sitting tight. Some people have been reluctant to relocate because they don’t want crowds of prospective buyers coming through their homes during the coronavirus pandemic, while others have been holding off due to surging prices and fierce competition, according to Redfin Chief Economist Daryl Fairweather.
“As home prices continue to climb, moving is becoming increasingly burdensome for Americans and their wallets. Prices surged 15% last year, which means that many home sellers had to cut larger checks to their agents,” Fairweather said. “Consequently, a lot of families are opting to refinance their mortgages so they can benefit from record-low interest rates without putting their houses up for sale.”
Another reason people are staying in their homes longer is a shortage of homes available for purchase. This past decade has been the slowest for home construction since at least the 1960s, with just 6.8 million single-family homes built between 2010 and the end of 2019—about half as many as in the 2000s. This shortage of homes—especially affordable ones— has created a cycle of homeowners staying in their existing homes instead of moving, which further exacerbates the supply crunch.
Some local governments also have tax structures that disincentivize homeowners from moving. In California, property taxes begin at 1% of the home’s initial market value and can increase no more than 2% annually, until the next sale (by comparison, the median sale price in California has increased by an average of 4.8% annually since 2012). As a result, the longer a homeowner remains in their home, the lower their tax rate is relative to the home’s market value. In Texas, homeowners who are 65 or older can defer property taxes until they no longer own or occupy the property, leading some homeowners there to age in place.
Aging in place may continue to accelerate across the country as the coronavirus pandemic highlights the risks of dense senior-living communities. As of October, 22% of assisted-living facilities across 39 states had reported at least one case of Covid-19 among residents and staff members, according to a study by the Centers for Disease Control and Prevention. Of those residents, the coronavirus death rate was 21%, compared with 3% among the general population.
A recent Scotiabank survey of people who are weighing moving a parent, grandparent or themselves into a senior-living facility found that 70% of respondents think they’re more likely to get Covid-19 in a senior-living facility than at home. More than half (55%) of participants said the coronavirus played a role in their decision to move into a senior-living facility later than they originally planned. Scotiabank doesn’t expect senior-housing occupancy to make a comeback until at least the middle of 2021.
Popular migration destinations see homeowner tenure decline, bucking the national trend
A handful of places bucked the national trend—15 of the 42 most populous U.S. metropolitan areas experienced a decrease in homeowner tenure in 2020. Many of these places, including Charlotte, NC and Sacramento, CA, are popular destinations for people relocating from crowded, costly cities during the pandemic.
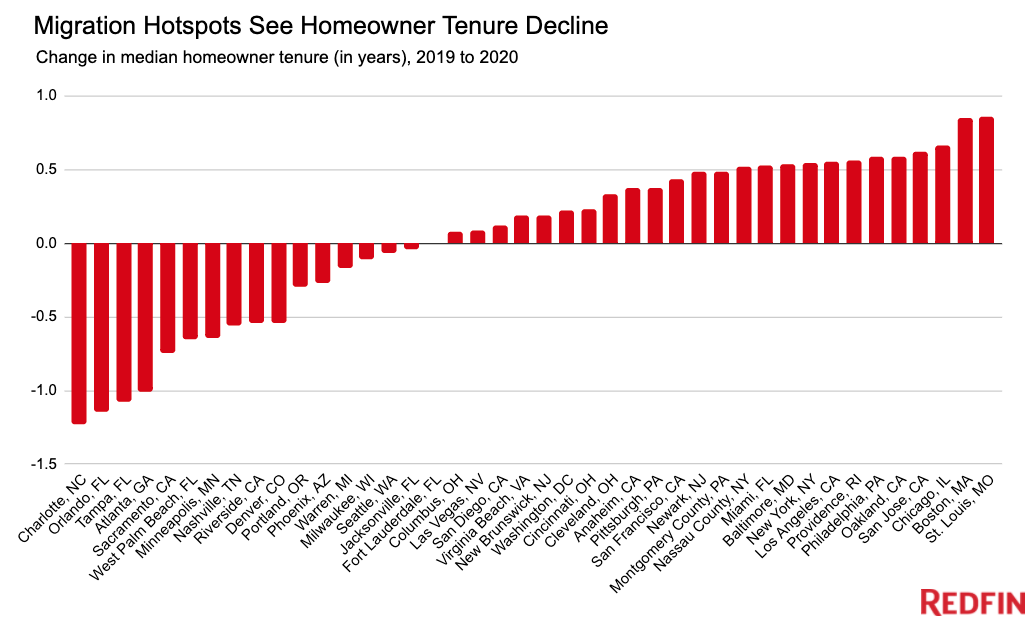
Charlotte experienced the largest decline, with median tenure falling by 1.2 years—to 9.3 years in 2020 from 10.5 years in 2019. It was followed by Orlando, FL and Tampa, FL, both of which saw median tenure decrease by 1.1 years, and Atlanta, which experienced a 1-year decline. Sacramento and West Palm Beach, FL tied for fourth place, down 0.7 years. Four of these places—Charlotte, Tampa, Atlanta and Sacramento—repeatedly made the list of the most popular destinations for people looking to move to a different metro area last year.
In October and November, Tampa saw a near-80% year-over-year increase in the number of people looking to relocate there. More than half (56.4%) of all Tampa home searches on Redfin.com during those two months were from users outside of the metro. The uptick in new residents is likely one factor driving down Tampa’s median homeowner tenure.
“A few years ago, people would come to Tampa on vacation and tell you they want to buy a home here one day. In 2020, those people came running with their checkbooks and actually bought homes. With the pandemic, remote work and low mortgage rates, they realized that ‘one day’ means now,” said local Redfin real estate agent Brian Walsh. “A lot of the buyers are young families who are tired of renting and want to put roots down. Many of them grew up here, moved to a big city to get their foot in the door professionally, and are now coming back to Tampa because they’re working from home and they want to be near the sun and ocean.”
Many homebuyers are coming to Tampa from cities including New York, Washington, D.C., Chicago and Boston, according to Redfin.com search data. Others already live in Tampa, but are upsizing because they’re spending so much time at home during the pandemic, Walsh said. And not every buyer is young. There’s also been an increase in retirees moving to the area, he added.
While a handful of metros saw a decline in homeowner tenure in 2020, most experienced an increase. The largest uptick was in St. Louis, where tenure rose by 0.9 years from 2019 to 2020. It was followed by Boston, up 0.8 years, and Chicago, up 0.7 years.
In Boston, many families pass homes down to future generations instead of putting them up for sale, said local Redfin real estate agent James Gulden. But competition and climbing prices are likely the bigger factors keeping people in their homes, he said.
“With the price gains since 2013 and the lack of homes for sale, many Bostonians have been renovating their houses instead of selling them and moving,” Gulden said. “The market is so competitive that some people just don’t want to wade in and deal with a bidding war.”
Summary of Homeowner Tenure By U.S. Metropolitan Area
| Metro | Change in Median Homeowner Tenure, 2019 to 2020 (in years) | Median Homeowner Tenure, 2020 (in years) | Median Homeowner Tenure, 2019 (in years) | Median Homeowner Tenure, 2010 (in years) | Median Sale Price, 2020 (November) |
|---|---|---|---|---|---|
| Charlotte, NC | -1.2 | 9.3 | 10.5 | 8.2 | $302,747 |
| Orlando, FL | -1.1 | 9.7 | 10.9 | 8.0 | $292,436 |
| Tampa, FL | -1.1 | 10.3 | 11.4 | 8.7 | $274,494 |
| Atlanta, GA | -1.0 | 11.2 | 12.2 | 8.7 | $288,566 |
| Sacramento, CA | -0.7 | 11.8 | 12.5 | 9.4 | $476,676 |
| West Palm Beach, FL | -0.7 | 9.9 | 10.6 | 9.1 | $328,450 |
| Minneapolis, MN | -0.6 | 11.6 | 12.2 | 8.7 | $314,077 |
| Nashville, TN | -0.6 | 8.4 | 9.0 | 7.2 | $335,517 |
| Riverside, CA | -0.5 | 12.4 | 12.9 | 8.8 | $439,462 |
| Denver, CO | -0.5 | 8.6 | 9.2 | 8.7 | $469,285 |
| Portland, OR | -0.3 | 11.3 | 11.6 | 8.4 | $453,784 |
| Phoenix, AZ | -0.3 | 8.4 | 8.7 | 7.6 | $335,860 |
| Warren, MI | -0.2 | 13.2 | 13.3 | 10.2 | $245,112 |
| Milwaukee, WI | -0.1 | 12.0 | 12.1 | 7.9 | $246,166 |
| Seattle, WA | -0.1 | 11.9 | 12.0 | 8.6 | $634,433 |
| Jacksonville, FL | 0.0 | 13.1 | 13.2 | 9.4 | $269,574 |
| Fort Lauderdale, FL | 0.0 | 13.3 | 13.3 | 9.1 | $322,320 |
| Columbus, OH | 0.1 | 13.2 | 13.1 | 9.6 | $248,320 |
| Las Vegas, NV | 0.1 | 7.8 | 7.8 | 7.1 | $321,272 |
| San Diego, CA | 0.1 | 14.3 | 14.2 | 10.6 | $664,848 |
| Virginia Beach, VA | 0.2 | 13.6 | 13.4 | 9.3 | $271,435 |
| New Brunswick, NJ | 0.2 | 14.3 | 14.1 | 10.3 | $377,246 |
| Washington, D.C. | 0.2 | 13.6 | 13.4 | 9.2 | $461,145 |
| Cincinnati, OH | 0.2 | 13.7 | 13.4 | 9.4 | $222,062 |
| Cleveland, OH | 0.3 | 16.3 | 15.9 | 12.0 | $175,178 |
| Anaheim, CA | 0.4 | 16.3 | 15.9 | 11.7 | $797,811 |
| Pittsburgh, PA | 0.4 | 15.3 | 15.0 | 11.5 | $198,466 |
| San Francisco, CA | 0.4 | 14.6 | 14.1 | 10.0 | $1,416,824 |
| Newark, NJ | 0.5 | 15.0 | 14.5 | 10.2 | $440,100 |
| Montgomery County, PA | 0.5 | 15.0 | 14.5 | 11.1 | $364,104 |
| Nassau County, NY | 0.5 | 15.8 | 15.3 | 11.2 | $539,156 |
| Miami, FL | 0.5 | 15.1 | 14.6 | 10.3 | $357,197 |
| Baltimore, MD | 0.5 | 14.8 | 14.2 | 10.1 | $326,639 |
| New York, NY | 0.5 | 14.8 | 14.3 | 10.2 | $561,624 |
| Los Angeles, CA | 0.6 | 17.3 | 16.8 | 12.2 | $715,385 |
| Providence, RI | 0.6 | 14.2 | 13.7 | 7.9 | $330,619 |
| Philadelphia, PA | 0.6 | 15.0 | 14.5 | 10.3 | $249,883 |
| Oakland, CA | 0.6 | 15.2 | 14.6 | 10.8 | $844,732 |
| San Jose, CA | 0.6 | 16.0 | 15.4 | 11.6 | $1,225,217 |
| Chicago, IL | 0.7 | 15.0 | 14.3 | 9.3 | $279,874 |
| Boston, MA | 0.8 | 18.4 | 17.6 | 9.3 | $565,353 |
| St. Louis, MO | 0.9 | 14.0 | 13.2 | 8.3 | $214,167 |
Methodology
Home tenure for 2020 is defined as the number of years between the most recent sale date of a home and Nov. 1, 2020. Similarly, for 2010 and 2019 home-tenure figures, the reference periods are Nov. 1, 2010 and Nov. 1, 2019, respectively.
The median home tenure and the proportion of homeowners in their homes for over 20 years is based on home tenure for all homes present in historical county records of a metropolitan area.


