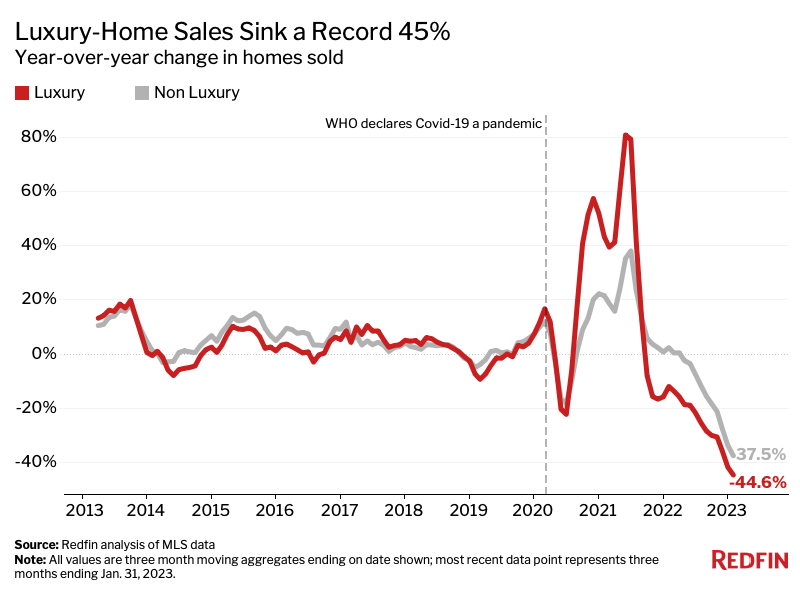
That outpaces the record 37% decline in sales of non luxury homes. The supply of luxury homes for sale is also near historic lows.
Sales of luxury U.S. homes declined a record 44.6% year over year to the second lowest level on record during the three months ending Jan. 31, 2023. That outpaced the record 37.5% drop in sales of non-luxury homes. Redfin’s records date back to 2012.
This is according to an analysis that divided all U.S. residential properties into tiers based on Redfin Estimates of the homes’ market values as of Feb. 25, 2023. This report defines luxury homes as those estimated to be in the top 5% based on market value, and non luxury homes as those estimated to be in the 35th-65th percentile based on market value.
The housing market has cooled significantly over the last year due to elevated mortgage rates, persistently high home prices, ongoing inflation and a shaky economy, but the luxury market has fallen relatively quickly because:
- People tend to purchase fewer expensive goods during times of economic uncertainty.
- Luxury home sales grew faster than non luxury sales during the pandemic, so they now have more room to fall (see chart above).
- A higher mortgage rate makes homebuying more expensive for nearly everyone, but it can add tens of thousands of dollars to the price tag on a luxury home, giving high-end buyers sticker shock.
- Wealthy homebuyers often have a lot of money in the stock market, which had a turbulent start to 2023 following its worst year since 2008.
- Many wealthy Americans are choosing to invest in assets other than real estate because elevated mortgage rates and softening housing prices have cast a shadow over prospective real estate returns.
“Uncertainty is the main factor driving the luxury-market slowdown in Los Angeles,” said Alin Glogovicean, a local Redfin Premier real estate agent. “If you’re investing millions in a property, you want to make sure it will hold its value. Most luxury buyers and sellers are thinking, ‘Let’s just wait and see what happens to the market. When it stabilizes, we’ll be ready to go.’ Everyone is kind of at a standstill.”
The drop in high-end home sales was led by expensive markets on the East Coast and in California. In Miami, luxury-home sales slumped 68.7% year over year during the three months ending Jan. 31, the largest decline among the most populous U.S. metropolitan areas. Next came Nassau County-Suffolk County, NY (-62.6%). Three California metros rounded out the top five: Riverside (-59.8%), Anaheim (-59.3%) and San Jose (-59%). These markets are likely seeing high-end buyers back off because they were already among the least affordable in the nation, and rising rates added fuel to the fire. These markets also saw outsized surges in luxury sales during the pandemic, so luxury purchases are also likely coming down from unsustainable levels.
“The silver lining for the luxury buyers who are still in the market is that competition is sparse and jumbo loans now often have lower mortgage rates than other loan types, in part because there’s less risk that high-end buyers will default on their mortgages,” said Redfin Economics Research Lead Chen Zhao. “Wealthy house hunters are also frequently offered additional rate discounts from their banks as a perk for storing substantial funds there.”
Zhao continued: “Luxury homebuyers should still shop around for the best mortgage rate possible. Research shows that when rates are high, so is the variance in rates between lenders. That’s why it’s smart to request quotes from several lenders and then ask your favorite lender to match the lowest rate.”
Luxury-Home Prices Remain Near Their Peak
The median sale price of luxury homes rose 9% year over year to $1.09 million during the three months ending Jan. 31. While that’s roughly half the year-over-year gain of a year earlier, luxury prices remain near the all-time high of $1.1 million reached in spring 2022.
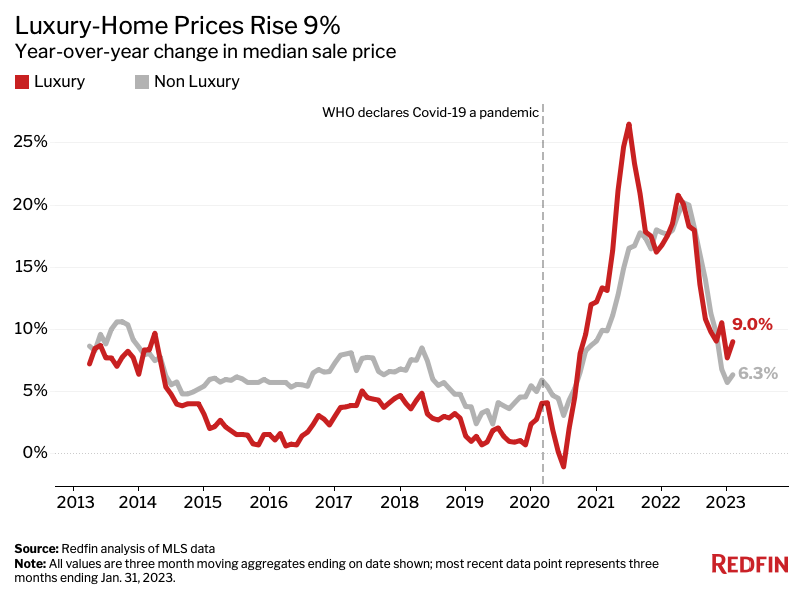
The median sale price of non luxury homes increased 6.3% year over year to $319,000, roughly one-third of the gain of a year earlier.
While the housing market has slowed significantly, home prices have been propped up by a lack of supply.
Luxury-Housing Supply Is Just Shy of Its All-Time Low
The number of luxury homes for sale rose 7.1% year over year during the three months ending Jan. 31, the biggest jump since 2015. The sizable year-over-year increase is largely due to the fact that supply hit rock bottom roughly a year earlier; supply is also piling up because so few people are buying homes.
But supply remains tight by historical standards. The number of luxury homes for sale was not much higher than the record low hit about a year ago.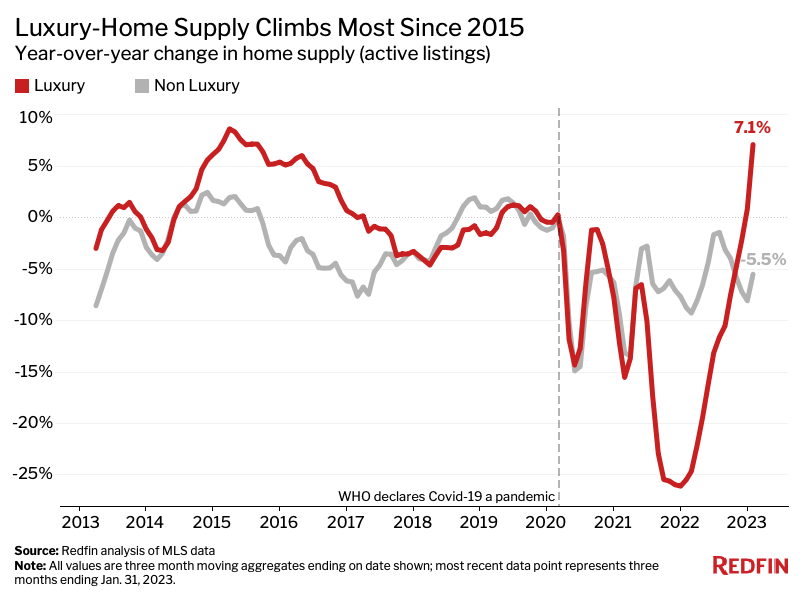
The number of non luxury homes for sale fell 5.5% year over year during the three months ending Jan. 31, but the story is similar to that in the luxury market: There’s a supply shortage. The number of non luxury homes was at the lowest level on record.
Supply remains near historic lows in part because fewer people are putting their homes on the market. With mortgage rates on the rise, many homeowners are hesitant to sell because they don’t want to give up their relatively low rate.
New listings of luxury homes fell 6.6% year over year. New listings of non luxury homes slumped 22.5%, the second biggest drop on record.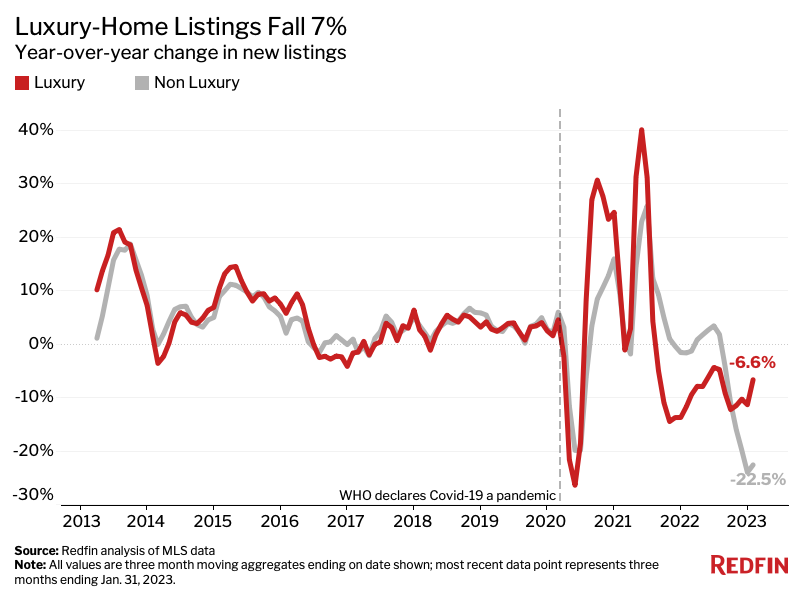
Metro-Level Highlights: Three Months Ending Jan. 31, 2023
Redfin’s metro-level data includes the 50 most populous U.S. metropolitan areas, with the exception of Cincinnati, Detroit, San Antonio and Warren, MI, which we excluded as we investigate the data to ensure accuracy. Scroll down to the table below to find data on your metro.
- Home sales: Luxury home sales fell in every metro. The biggest declines were in Miami (-68.7% YoY), Nassau County-Suffolk County (-62.6%), Riverside (-59.8%), Anaheim (-59.3%) and San Jose (-59%). The smallest decreases were in Kansas City, MO (-23.4%), Cleveland (-24.4%), Pittsburgh (-29.8%), St. Louis (-30.9%) and Dallas (-31.6%).
- Supply: Active listings of luxury homes rose in 25 metros, with the biggest increases in Austin, TX (62.6% YoY), Denver (50.8%), Nashville, TN (40.3%), Seattle (38.6%) and Atlanta (36.4%). The largest declines were in Anaheim (-21.4%), San Jose (-18.5%), St. Louis (-13.5%), Miami (-13.1%) and San Diego (-12.9%).
- New listings: New listings of luxury homes fell in 37 metros. The biggest declines were in Chicago (-40.4% YoY), Anaheim (-38.1%), Oakland, CA (-36.9%), San Jose (-35.9%) and San Diego (-32.2%). The largest gains were in Austin (36%), Atlanta (16.9%), Denver (15.3%), West Palm Beach, FL (14.8%) and Nashville (11%).
- Prices: The median sale price of luxury homes fell in just four metros: San Jose (-10.7% YoY), San Francisco (-4.6%), Oakland (-3.2%) and Sacramento, CA (-1.6%). The biggest jumps were in Jacksonville, FL (23.1%), Orlando, FL (20%), Tampa, FL (18.2%), Miami (17.3%) and Atlanta (16.8%).
Luxury Housing Market Summary by Metro Area: Three Months Ending Jan. 31, 2023
| U.S. Metro Area | Homes Sold, YoY Change | Active Listings, YoY Change | New Listings, YoY Change | Median Sale Price | Median Sale Price, YoY Change | Median Days On Market |
| Anaheim, CA | -59.3% | -21.4% | -38.1% | $3,800,000 | 9.2% | 75 |
| Atlanta, GA | -56.3% | 36.4% | 16.9% | $1,150,000 | 16.8% | 52 |
| Austin, TX | -51.4% | 62.6% | 36.0% | $1,950,000 | 11.4% | 66 |
| Baltimore, MD | -43.0% | -4.0% | -7.5% | $1,040,000 | 6.1% | 50 |
| Boston, MA | -36.0% | 14.2% | -6.3% | $2,200,000 | 4.8% | 41 |
| Charlotte, NC | -45.2% | -11.1% | -17.5% | $1,210,500 | 15.0% | 61 |
| Chicago, IL | -43.9% | -11.8% | -40.4% | $1,070,000 | 6.1% | 84 |
| Cleveland, OH | -24.4% | -12.5% | -17.9% | $663,400 | 3.2% | 33 |
| Columbus, OH | -33.5% | -7.4% | -14.7% | $780,800 | 8.3% | 44 |
| Dallas, TX | -31.6% | 26.1% | -2.9% | $1,300,000 | 8.3% | 44 |
| Denver, CO | -41.6% | 50.8% | 15.3% | $1,600,000 | 6.7% | 32 |
| Fort Lauderdale, FL | -53.4% | -4.6% | -17.3% | $1,595,000 | 16.0% | 76 |
| Fort Worth, TX | -36.0% | 11.4% | -16.9% | $1,000,000 | 8.1% | 64 |
| Houston, TX | -46.4% | 0.5% | -12.2% | $1,100,000 | 14.4% | 41 |
| Indianapolis, IN | -33.2% | 11.7% | 7.6% | $785,000 | 9.0% | 26 |
| Jacksonville, FL | -43.5% | 12.2% | 0.0% | $1,292,500 | 23.1% | 53 |
| Kansas City, MO | -23.4% | 1.1% | -18.5% | $824,600 | 8.2% | 33 |
| Las Vegas, NV | -55.6% | 6.0% | -26.8% | $1,175,000 | 11.9% | 84 |
| Los Angeles, CA | -55.5% | -9.7% | -11.0% | $3,622,500 | 10.6% | 64 |
| Miami, FL | -68.7% | -13.1% | -18.4% | $2,845,000 | 17.3% | 119 |
| Milwaukee, WI | -36.0% | -8.1% | -7.0% | $847,500 | 9.5% | 69 |
| Minneapolis, MN | -34.6% | 2.1% | -29.1% | $944,600 | 6.1% | 39 |
| Montgomery County, PA | -36.2% | -2.1% | 3.6% | $1,220,400 | 12.5% | 48 |
| Nashville, TN | -31.9% | 40.3% | 11.0% | $1,562,700 | 9.7% | 74 |
| Nassau County-Suffolk County, NY | -62.6% | -2.7% | -16.4% | $2,475,000 | 3.1% | 86 |
| New Brunswick, NJ | -44.6% | 3.8% | -12.6% | $1,690,000 | 12.7% | 89 |
| New York, NY | -44.4% | -5.8% | -18.7% | $3,625,000 | 10.0% | 82 |
| Newark, NJ | -42.5% | 8.0% | -5.0% | $1,480,000 | 7.6% | 26 |
| Oakland, CA | -55.5% | -5.3% | -36.9% | $2,580,000 | -3.2% | 21 |
| Orlando, FL | -47.2% | 8.1% | -11.4% | $1,050,000 | 20.0% | 33 |
| Philadelphia, PA | -49.7% | 0.0% | -8.1% | $1,008,500 | 15.3% | 44 |
| Phoenix, AZ | -50.9% | 11.9% | -12.5% | $1,590,900 | 11.6% | 64 |
| Pittsburgh, PA | -29.8% | -4.9% | -6.8% | $725,000 | 7.4% | 64 |
| Portland, OR | -48.8% | 10.4% | -11.3% | $1,280,000 | 2.4% | 43 |
| Providence, RI | -42.1% | -10.7% | -22.7% | $1,287,500 | 9.6% | 43 |
| Riverside, CA | -59.8% | -6.1% | -24.0% | $1,395,000 | 11.6% | 63 |
| Sacramento, CA | -55.2% | 5.7% | -29.5% | $1,400,000 | -1.6% | 65 |
| San Diego, CA | -58.5% | -12.9% | -32.2% | $3,187,500 | 12.0% | 43 |
| San Francisco, CA | -54.9% | 9.3% | 1.4% | $4,700,000 | -4.6% | 35 |
| San Jose, CA | -59.0% | -18.5% | -35.9% | $4,005,000 | -10.7% | 49 |
| Seattle, WA | -50.5% | 38.6% | -20.7% | $2,550,000 | 2.0% | 34 |
| St. Louis, MO | -30.9% | -13.5% | -15.3% | $775,000 | 3.3% | 30 |
| Tampa, FL | -41.8% | 20.4% | -3.7% | $1,300,000 | 18.2% | 24 |
| Virginia Beach, VA | -47.1% | -2.3% | -5.5% | $970,000 | 13.8% | 39 |
| Washington, D.C. | -47.2% | -9.0% | -22.8% | $1,610,000 | 5.6% | 43 |
| West Palm Beach, FL | -51.6% | 19.0% | 14.8% | $2,700,000 | 14.9% | 69 |
| National—U.S.A. | -44.6% | 7.1% | -6.6% | $1,088,900 | 9.0% | 54 |
Non Luxury Housing Market Summary by Metro Area: Three Months Ending Jan. 31, 2023
| U.S. Metro Area | Homes Sold, YoY Change | Active Listings, YoY Change | New Listings, YoY Change | Median Sale Price | Median Sale Price, YoY Change | Median Days On Market |
| Anaheim, CA | -42.7% | -4.3% | -30.0% | $927,000 | 4.2% | 47 |
| Atlanta, GA | -47.0% | 20.8% | -11.6% | $350,000 | 9.7% | 42 |
| Austin, TX | -34.9% | 5.8% | -32.6% | $477,000 | 2.3% | 70 |
| Baltimore, MD | -39.8% | -26.8% | -30.7% | $325,000 | 3.2% | 29 |
| Boston, MA | -32.6% | -17.1% | -26.7% | $625,000 | 4.2% | 26 |
| Charlotte, NC | -44.3% | 5.1% | -21.7% | $347,000 | 11.9% | 51 |
| Chicago, IL | -38.4% | -3.3% | -31.4% | $277,500 | 4.7% | 63 |
| Cleveland, OH | -32.7% | -18.6% | -20.6% | $180,000 | 5.3% | 30 |
| Columbus, OH | -30.8% | -11.8% | -23.7% | $273,300 | 9.3% | 44 |
| Dallas, TX | -30.2% | 13.7% | -14.5% | $380,000 | 8.6% | 45 |
| Denver, CO | -38.8% | 31.2% | -8.7% | $545,000 | 2.8% | 36 |
| Fort Lauderdale, FL | -40.3% | -9.2% | -16.6% | $380,000 | 15.2% | 51 |
| Fort Worth, TX | -31.8% | 29.5% | -2.9% | $320,000 | 6.7% | 42 |
| Houston, TX | -29.6% | 6.2% | -21.5% | $295,800 | 7.6% | 41 |
| Indianapolis, IN | -32.4% | 0.7% | -22.1% | $245,600 | 6.8% | 19 |
| Jacksonville, FL | -47.6% | 5.6% | -28.8% | $345,000 | 12.4% | 54 |
| Kansas City, MO | -32.8% | -15.4% | -28.3% | $255,000 | 5.4% | 26 |
| Las Vegas, NV | -56.2% | 2.2% | -43.1% | $385,000 | 1.3% | 64 |
| Los Angeles, CA | -46.0% | -14.9% | -38.9% | $765,000 | 0.4% | 51 |
| Miami, FL | -43.9% | -11.6% | -25.0% | $448,500 | 19.6% | 59 |
| Milwaukee, WI | -33.4% | -32.6% | -27.3% | $257,500 | 6.4% | 44 |
| Minneapolis, MN | -39.2% | -8.5% | -29.2% | $335,000 | 1.6% | 34 |
| Montgomery County, PA | -34.3% | -21.3% | -31.3% | $420,000 | 7.7% | 24 |
| Nashville, TN | -44.3% | 14.9% | -19.3% | $418,200 | 13.0% | 56 |
| Nassau County-Suffolk County, NY | -45.7% | -21.0% | -33.3% | $597,800 | 5.8% | 36 |
| New Brunswick, NJ | -37.4% | -13.8% | -24.8% | $469,000 | 11.7% | 48 |
| New York, NY | -38.2% | -12.3% | -22.9% | $690,000 | 6.3% | 61 |
| Newark, NJ | -34.6% | -13.6% | -18.0% | $465,000 | 10.7% | 36 |
| Oakland, CA | -42.1% | -4.6% | -32.1% | $875,000 | -2.8% | 31 |
| Orlando, FL | -40.3% | 6.7% | -25.4% | $367,000 | 12.9% | 36 |
| Philadelphia, PA | -52.5% | -15.4% | -28.8% | $219,000 | 6.8% | 43 |
| Phoenix, AZ | -52.5% | -3.2% | -42.5% | $420,000 | 0.9% | 64 |
| Pittsburgh, PA | -31.1% | -19.6% | -24.4% | $180,000 | 2.9% | 58 |
| Portland, OR | -43.8% | -16.1% | -40.3% | $520,900 | 3.8% | 32 |
| Providence, RI | -37.0% | -26.0% | -29.5% | $405,000 | 9.3% | 29 |
| Riverside, CA | -47.5% | -10.6% | -36.4% | $530,000 | 5.0% | 55 |
| Sacramento, CA | -49.0% | -10.9% | -41.1% | $535,000 | -1.8% | 43 |
| San Diego, CA | -50.0% | -21.9% | -48.9% | $799,000 | 5.0% | 33 |
| San Francisco, CA | -38.9% | -4.1% | -27.1% | $1,310,000 | -8.1% | 38 |
| San Jose, CA | -45.5% | -20.3% | -39.0% | $1,325,000 | -4.0% | 25 |
| Seattle, WA | -42.8% | 8.7% | -30.7% | $729,900 | -0.7% | 32 |
| St. Louis, MO | -32.5% | -16.7% | -19.0% | $212,000 | 7.6% | 25 |
| Tampa, FL | -35.9% | 19.3% | -16.4% | $354,900 | 14.5% | 33 |
| Virginia Beach, VA | -37.1% | -19.4% | -26.0% | $302,000 | 8.2% | 28 |
| Washington, D.C. | -43.1% | -12.5% | -29.5% | $485,000 | 2.7% | 46 |
| West Palm Beach, FL | -39.8% | 2.1% | -19.6% | $410,000 | 17.1% | 60 |
| National—U.S.A. | -37.5% | -5.5% | -22.5% | $319,000 | 6.3% | 40 |