
Ten charts that illustrate a record year for the U.S. housing market, including the highest home prices and lowest supply of all time.
2021’s housing market has been, in a word, remarkable. The coronavirus pandemic and the resulting surge in remote work have changed where, when, why and how people buy homes. This past year, home-sale prices hit the highest median of all time, the number of homes for sale fell to an all-time low, there was record demand for second homes, a greater share of homebuyers relocated to a different metro than ever before … and the list goes on.
“The ongoing pandemic, including its seismic effect on the U.S. economy and the way Americans live and work, has made 2021’s housing market anything but typical,” said Redfin Chief Economist Daryl Fairweather. “Remote work, low mortgage rates, a shortage of building materials and wealth inequality that has allowed an influx of affluent Americans to buy vacation homes, to name just a few factors, have come together to create a historic year for real estate. Buyers paid more for homes, bought sooner than they planned, searched outside their hometowns or all of the above. This year’s frenzied housing market has been one for the books—but it may become more balanced in 2022.”
Below is a non-exhaustive list of housing-market records that were set in 2021. Redfin’s housing market data, which applies to records one through five, goes back through 2012. Timeframes for the other records are individually noted.
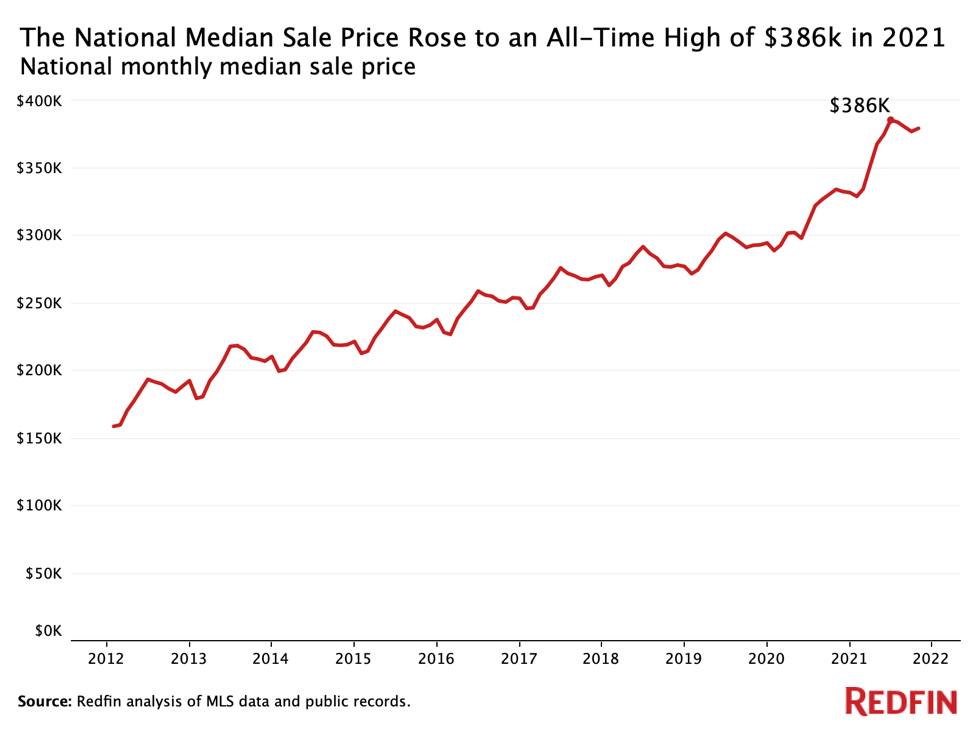
#1) The typical U.S. home sold for nearly $400,000
The national median home-sale price hit $386,000 in June, an all-time high and up 24.4% year over year. The median sale price may hit another all-time high before the end of the year. U.S. home prices have been growing by double digits all year, thanks to low inventory and high demand. Prices are much higher than they were pre-pandemic in just about every part of the country.
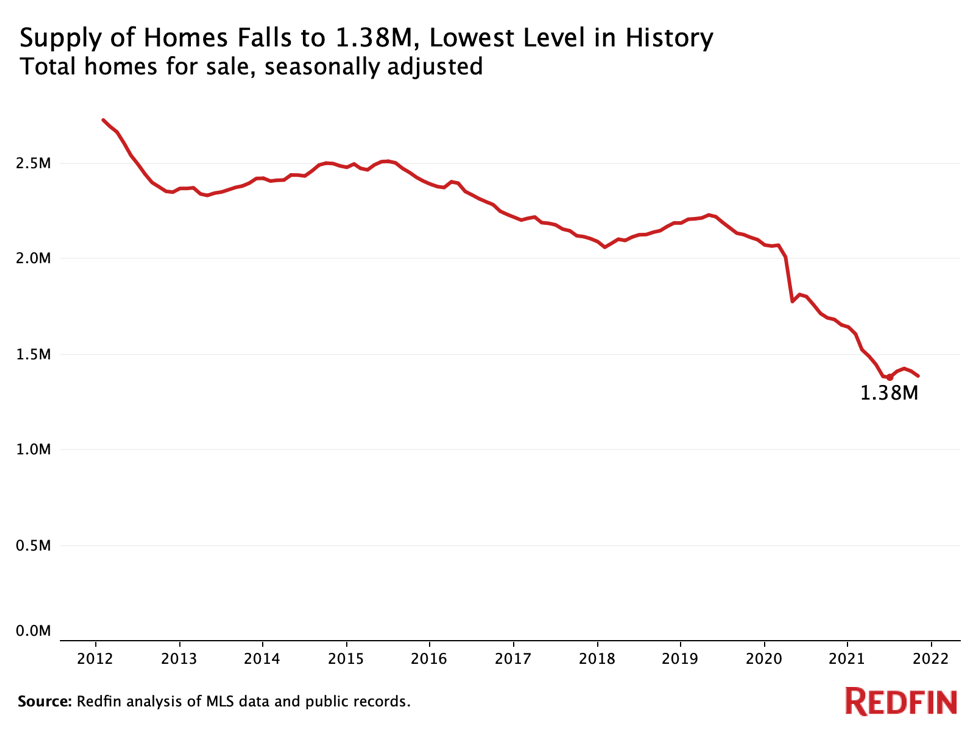
#2) Home supply dropped to its lowest level in history
There were just 1.38 million homes for sale in June on a seasonally adjusted basis. That’s an all-time low and down 23% year over year. The U.S. is in a housing-supply shortage for a combination of reasons: A lack of new construction, surging demand from buyers and homeowners taking advantage of low mortgage rates to refinance rather than sell, to name a few.
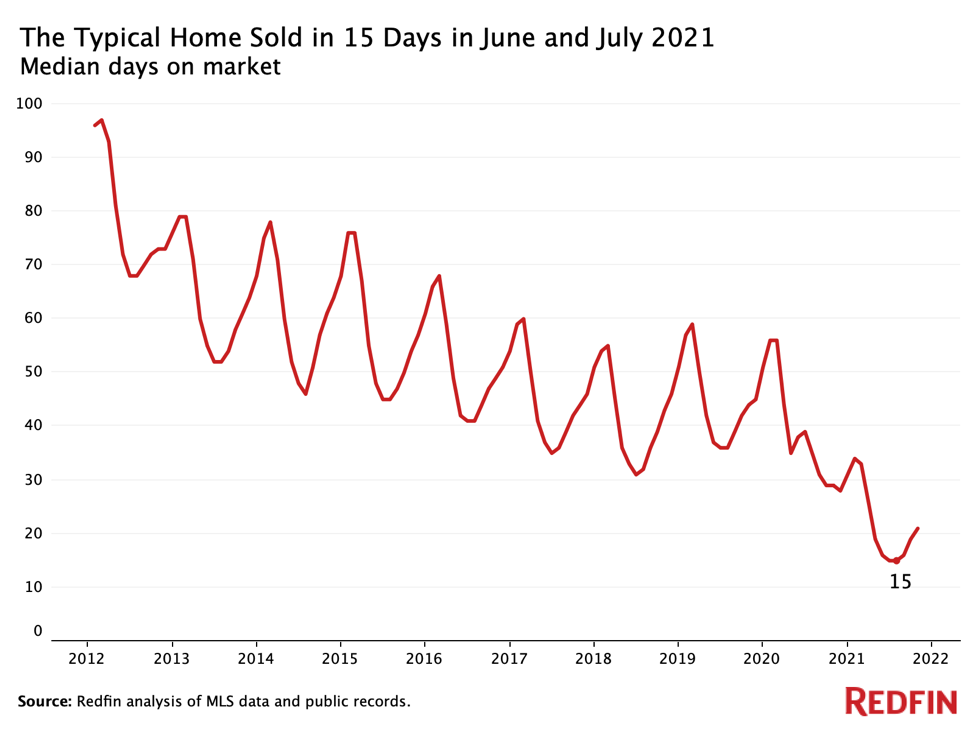
#3) The typical home sold in just 15 days
The typical home that sold in both June and July was on the market for just 15 days. That’s the lowest median days on market in history and down from 39 days in June 2020. The speed of the market is due partly to the supply crunch, which has led buyers to pounce on homes as soon as they’re listed for sale, often without even seeing them in person.
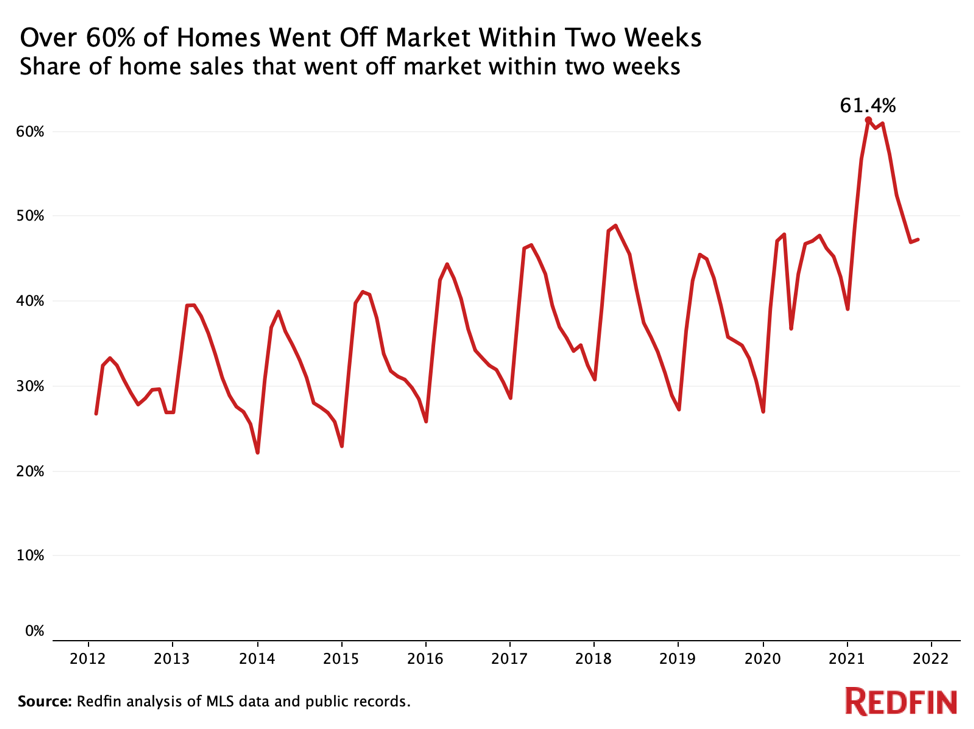
#4) Over 60% of homes went off the market in two weeks
Speaking of a fast market, 61.4% of homes that went under contract in March had an accepted offer within two weeks of hitting the market, an all-time high.
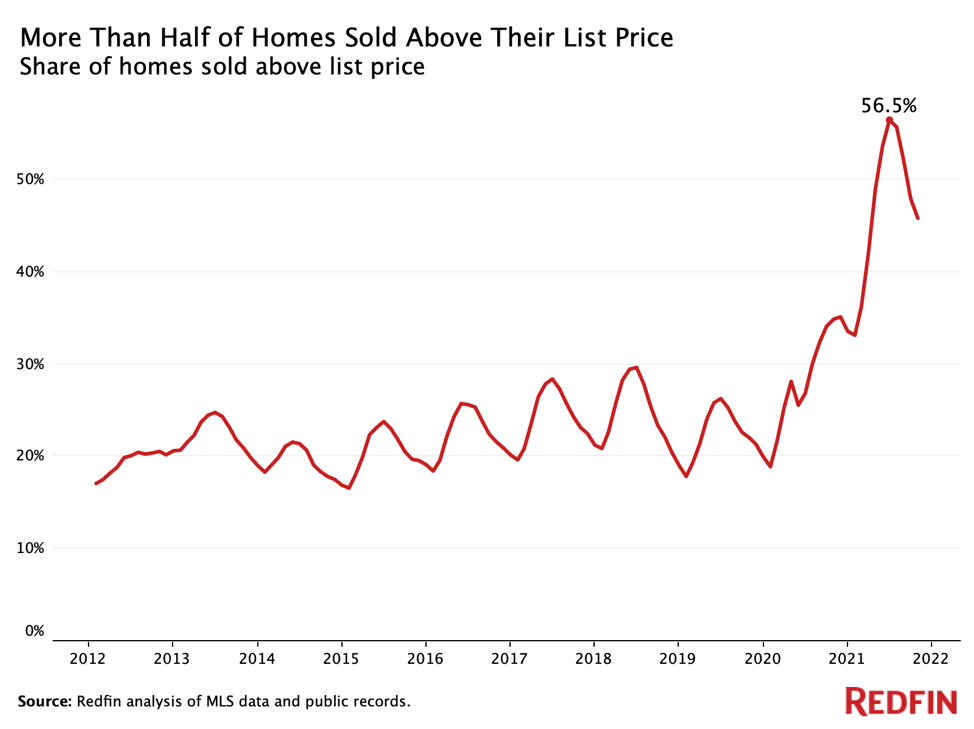
#5) More than half of homes sold above list price
Of homes that sold in June, 56.5% went for above list price. That’s a record high and up 29.6 percentage points from a year earlier. The average home sold for 2.6% above list price in June, another record high.
Homes selling above list price is typically due to bidding wars, which were commonplace this year: Nearly three-quarters of offers written by Redfin agents in April, for instance, encountered competition from another potential buyer.
#6) Mortgage rates dropped to 2.65%
The average 30-year fixed mortgage rate hit 2.65% the week ending January 7, 2021, the lowest of all time. Low mortgage rates are one reason for this year’s homebuying frenzy, which has ultimately resulted in the supply shortage and surging prices.
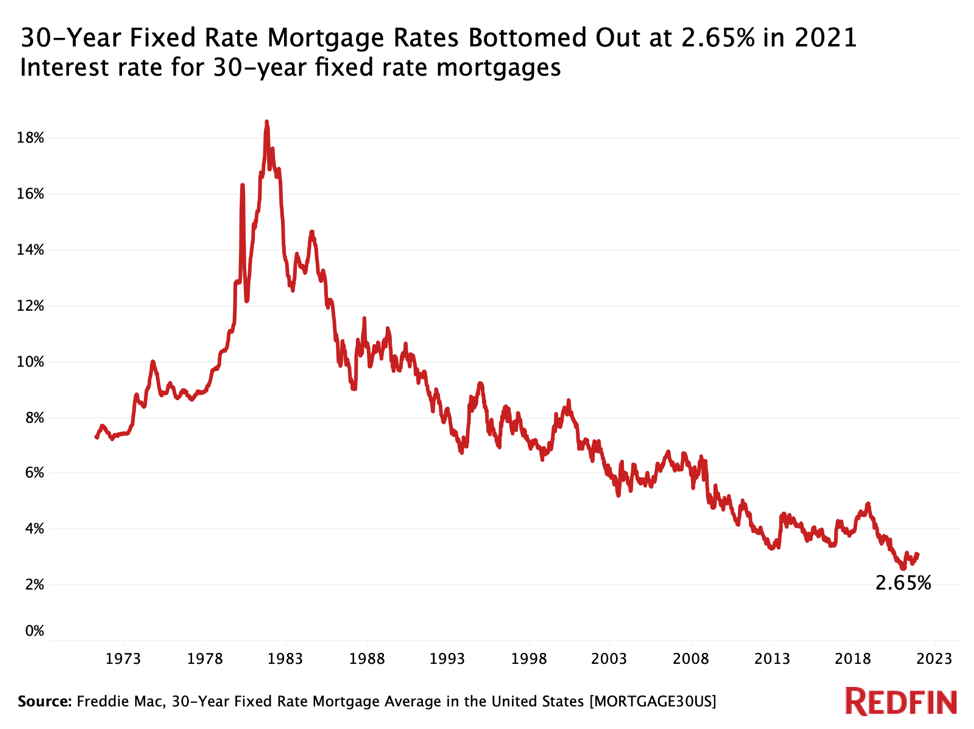
Mortgage rate data is from Freddie Mac and goes back through 1971.
#7) Investors purchased nearly 1 in 5 of all homes bought in the U.S.
Real estate investors bought 18.2% of homes that were purchased in the U.S. during the third quarter of 2021. That’s a record-high share and up from 11.2% a year earlier. In dollar terms, investors bought a record $63.6 billion worth of homes over that period, up from $35.7 billion a year earlier. Many individual homebuyers have found it tough to compete with investors, just one factor that has made the housing market tough for buyers this year.
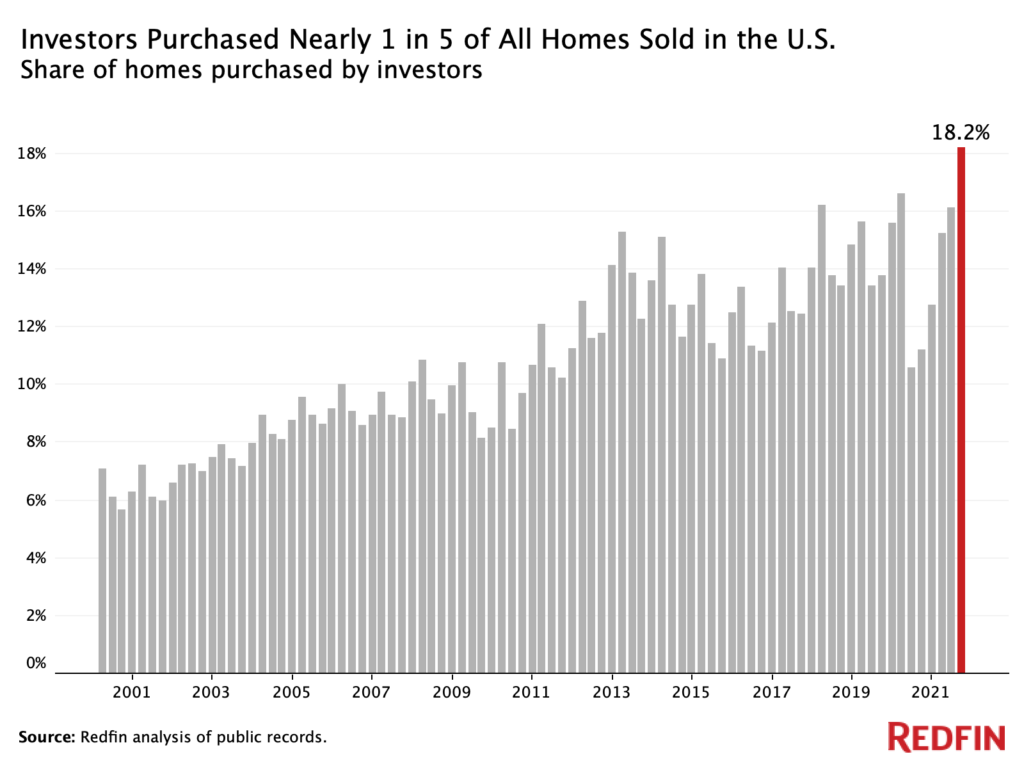
Investor data is from a Redfin analysis of county records and goes back through 2000.
#8) Demand for second homes nearly doubled from before the pandemic
Homebuyer demand for second homes was up 91% from pre-pandemic levels in January, marking record growth. Demand for vacation homes soared as remote work took hold in mid-2020, leaving many affluent white-collar workers with the ability to work from beach houses and ski chalets.
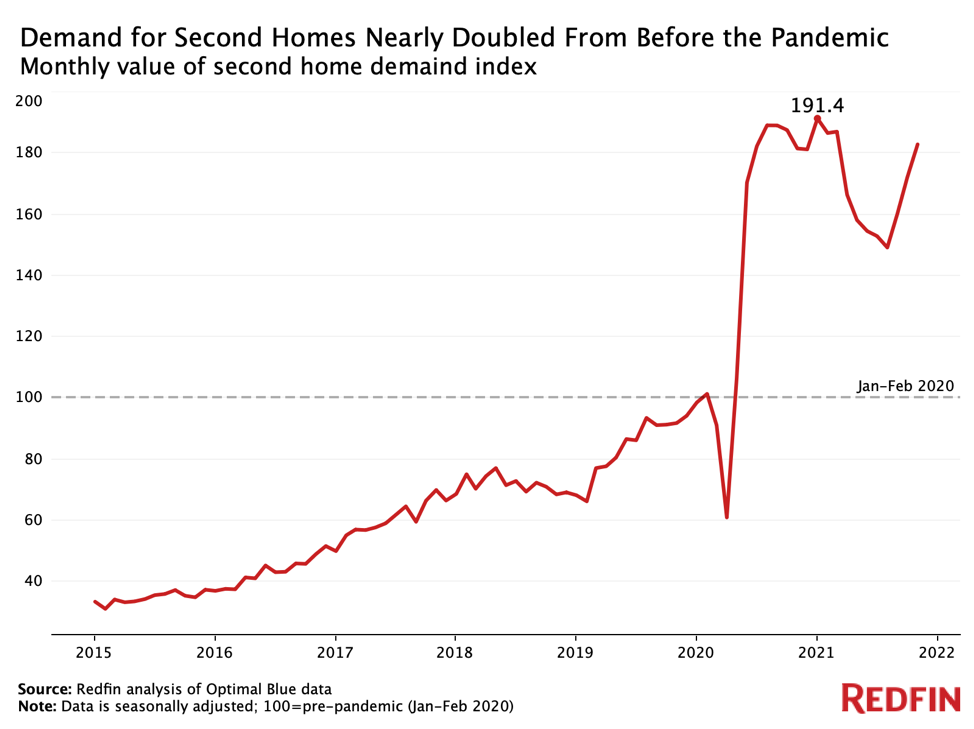
Second-home data is from a Redfin analysis of mortgage-rate lock data from Optimal Blue and goes back through 2015.
#9) Nearly one-third of Americans looked to move to a different metro area
In another side effect of the surge in remote work, 31.5% of Redfin.com users looked to move to a different metro area in the first quarter of 2021, an all-time high and up from 26% from a year earlier. That’s partly due to remote workers moving to relatively affordable areas in search of larger homes, more outdoor space and sunny weather.
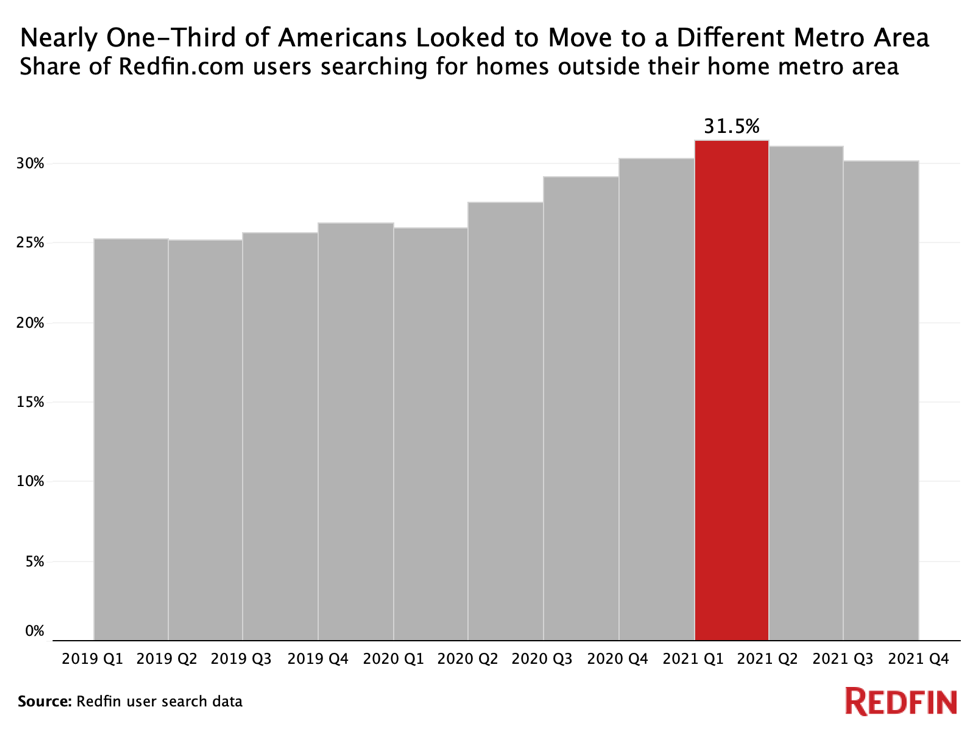
Redfin’s migration data goes back through 2017.
#10) The typical luxury home sold for 26% more than the year before
The median sale price of U.S. luxury homes jumped 26.5% year over year to $990,000 in the second quarter of 2021, marking record price growth. That’s compared with 16% year-over-year growth for mid-priced homes and 13.2% growth for affordable homes. Price growth for luxury homes outpaced that of more affordable homes partly due to affluent Americans reaping the benefits of the year’s strong stock market, gains in home equity and remote work.
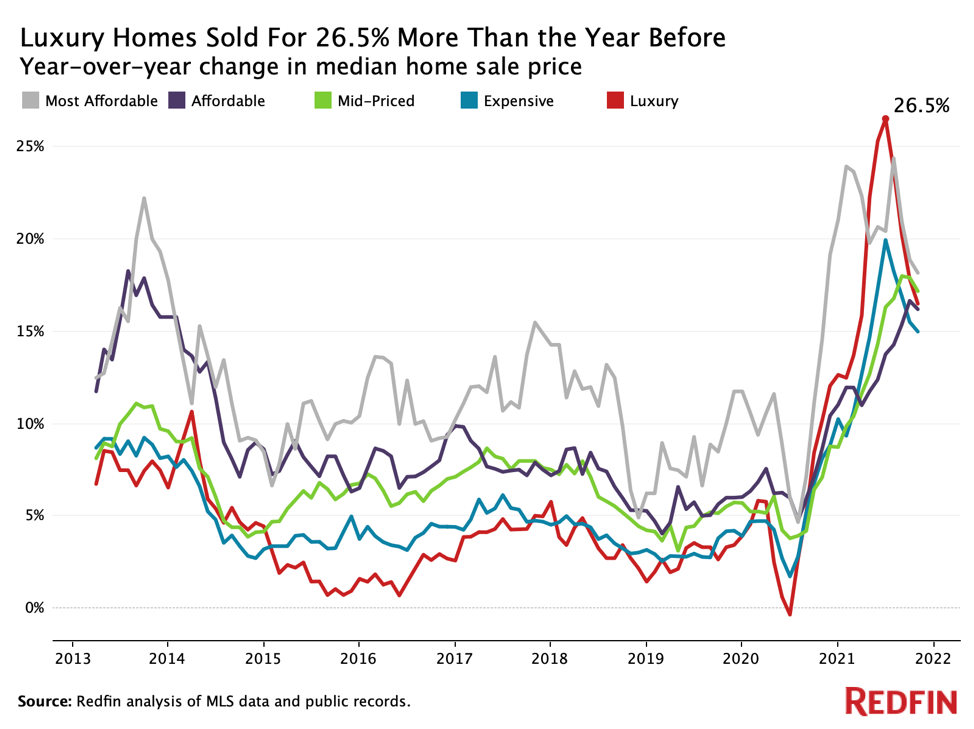
Redfin’s price-tier data goes back through 2013.
Correction: A previous version of this report included outdated information, reporting that the median sale price of U.S. luxury homes jumped 25.8% year over year to $1,025,000 in the second quarter of 2021. The report was updated on December 21 to reflect the correct increase.


