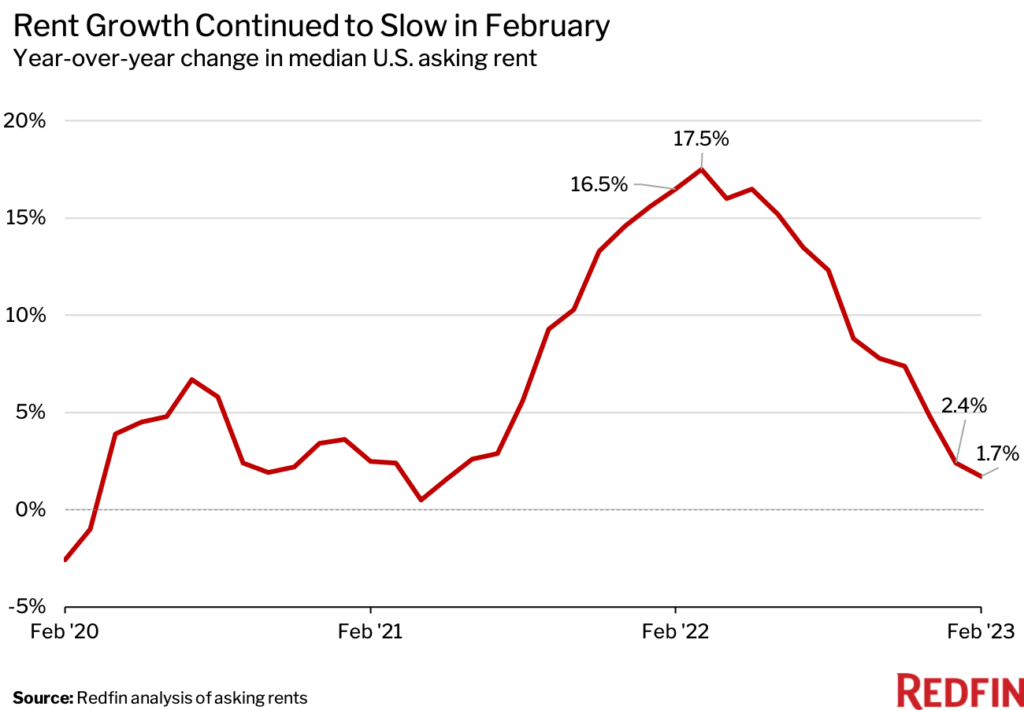
The median U.S. asking rent is up just 1.7% from a year ago—the smallest gain since May 2021—as landlords grapple with vacancies due to still-high rental costs and rising supply.
The median U.S. asking rent rose 1.7% year over year to $1,937 in February—the smallest increase in nearly two years and the lowest level in a year. Rents were up nearly 10 times that much (16.5%) a year earlier.
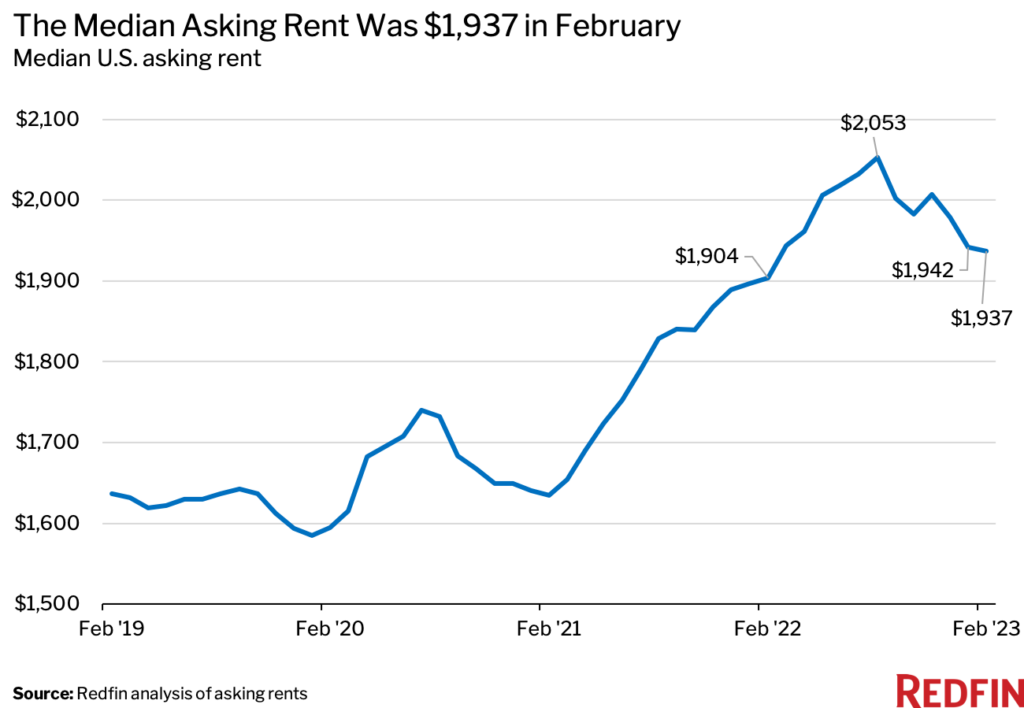
February was the ninth straight month in which rent growth slowed on a year-over-year basis. Rents fell 0.3% from a month earlier. Still, the median asking rent remained 21.4% higher than it was in February 2020, the month before the coronavirus was declared a pandemic.
Rent growth has cooled as persistently high housing costs, inflation, recession fears and a slowdown in household formation have made people less likely to move, putting a damper on demand for new leases. A jump in supply due to a boom in apartment construction has also contributed to the slowdown in rent growth. The number of apartments under construction is up 24.9% year over year to 943,000, the highest level since 1974, according to a recent report from the National Association of Home Builders.
“Landlords are slowing their roll on rent increases because they’re grappling with a rise in vacancies as an influx of new apartments hits the market and demand slows from its peak,” said Redfin Deputy Chief Economist Taylor Marr. “Rents are likely close to hitting a floor, though. That’s because stubbornly high inflation is boosting expenses for landlords, so instead of dropping rents they may seek to lure renters with other concessions, like free parking or a discounted security deposit.”
Marr continued: “While rent growth has slowed, it hasn’t slowed quite as much as expected—in part because the labor market has held up better than anticipated, which has helped prop up demand. This is likely a reason overall inflation remains stubbornly high, as rent growth is a major contributor to inflation.”
Rents Declined in 11 Major U.S. Metro Areas
- Austin, TX (-6.5%)
- New Orleans, LA (-6.4%)
- Phoenix, AZ (-4%)
- Minneapolis, MN (-3.5%)
- Dallas, TX (-2.6%)
- Baltimore, MD (-2.2%)
- Houston, TX (-1.9%)
- Birmingham, AL (-0.5%)
- Chicago, IL (-0.5%)
- Denver, CO (-0.3%)
- Virginia Beach, VA (-0.2%)
Charlotte and Columbus Saw the Largest Rent Increases
- Charlotte, NC (14.3%)
- Columbus, OH (12.6%)
- Milwaukee, WI (9.5%)
- Nashville, TN (9.0%)
- Indianapolis, IN (8.5%)
- Kansas City, MO (8.3%)
- Hartford, CT (6%)
- Buffalo, NY; Providence RI (5.9%)
- Cincinnati, OH; Louisville, KY; Memphis, TN (5.5%)
- Riverside, CA; San Diego (5.3%)
Median Asking Rents: February 2023
| U.S. Metro Area | Median Asking Rent | Year-Over-Year Change in Median Asking Rent |
| Atlanta, GA | $2,059 | 0.8% |
| Austin, TX | $2,166 | -6.5% |
| Baltimore, MD | $1,981 | -2.2% |
| Birmingham, AL | $1,590 | -0.5% |
| Boston, MA | $3,642 | 0.5% |
| Buffalo, NY | $1,602 | 5.9% |
| Charlotte, NC | $1,939 | 14.3% |
| Chicago, IL | $2,275 | -0.5% |
| Cincinnati, OH | $1,552 | 5.5% |
| Columbus, OH | $1,660 | 12.6% |
| Dallas, TX | $2,111 | -2.6% |
| Denver, CO | $2,758 | -0.3% |
| Detroit, MI | $1,616 | 3.7% |
| Hartford, CT | $2,040 | 6.0% |
| Houston, TX | $1,757 | -1.9% |
| Indianapolis, IN | $1,500 | 8.5% |
| Jacksonville, FL | $1,646 | 4.8% |
| Kansas City, MO | $1,531 | 8.3% |
| Las Vegas, NV | $1,798 | 2.6% |
| Los Angeles, CA | $3,361 | 0.5% |
| Louisville, KY | $1,387 | 5.5% |
| Memphis, TN | $1,584 | 5.5% |
| Miami, FL | $3,073 | 1.4% |
| Milwaukee, WI | $1,730 | 9.5% |
| Minneapolis, MN | $1,753 | -3.5% |
| Nashville, TN | $2,117 | 9.0% |
| New Orleans, LA | $1,698 | -6.4% |
| New York, NY | $3,927 | 0.7% |
| Orlando, FL | $2,083 | 1.1% |
| Philadelphia, PA | $2,306 | 0.7% |
| Phoenix, AZ | $2,071 | -4.0% |
| Pittsburgh, PA | $1,792 | 3.7% |
| Portland, OR | $2,576 | 4.8% |
| Providence, RI | $2,312 | 5.9% |
| Richmond, VA | $1,746 | 3.3% |
| Riverside, CA | $2,773 | 5.3% |
| Sacramento, CA | $2,718 | 2.5% |
| Salt Lake City, UT | $1,902 | 5.1% |
| San Antonio, TX | $1,457 | 2.3% |
| San Diego, CA | $3,363 | 5.3% |
| San Francisco, CA | $3,694 | 3.7% |
| San Jose, CA | $3,571 | 3.8% |
| Seattle, WA | $2,812 | 1.2% |
| St. Louis, MO | $1,556 | 4.5% |
| Tampa, FL | $2,189 | 4.1% |
| Virginia Beach, VA | $1,657 | -0.2% |
| Washington, D.C. | $2,627 | 1.5% |
| National—U.S.A. | $1,937 | 1.7% |
Methodology
Redfin analyzed rent prices from Rent. across the 50 largest U.S. metro areas. Cleveland, Oklahoma City, OK and Raleigh, NC are excluded from this report as we investigate the data to ensure accuracy. This analysis uses data from more than 20,000 apartment buildings across the country.
It is important to note that the prices in this report reflect the current costs of new leases during each time period. In other words, the amount shown as the median rent is not the median of what all renters are paying, but the median cost of apartments that were available for new renters during the report month. Currently, Redfin’s data from Rent. includes only median rent at the metro level. Future reports will compare median rent prices at a more granular geographic level.
 United States
 Canada