Rents are growing at half the pace they were in the summer and are expected to keep cooling, which should help bring down overall inflation.
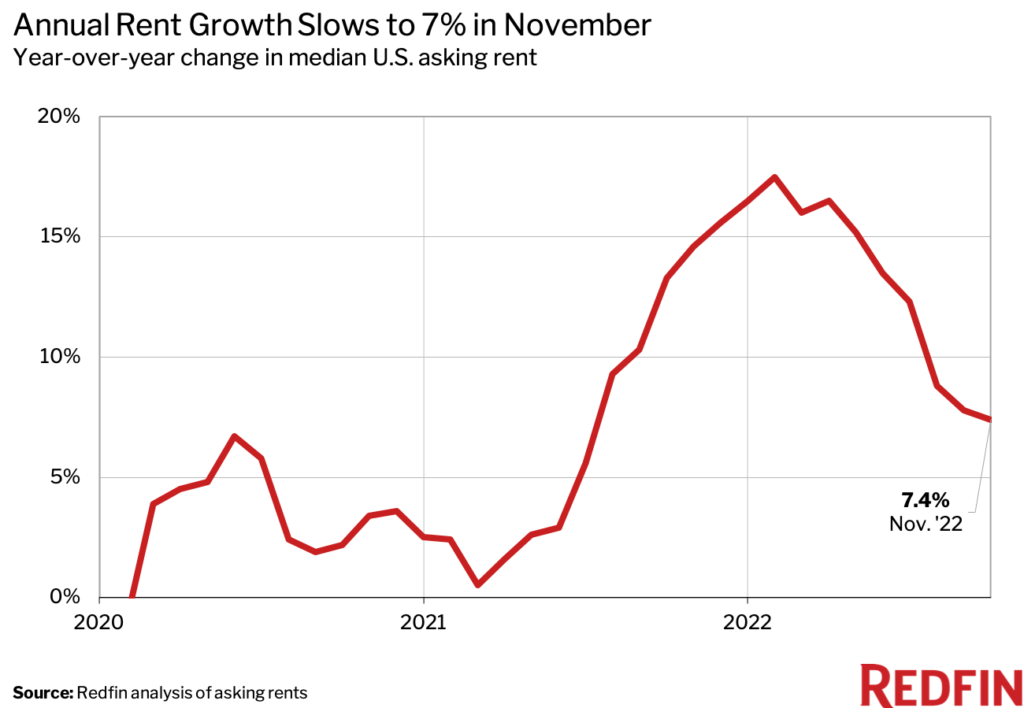
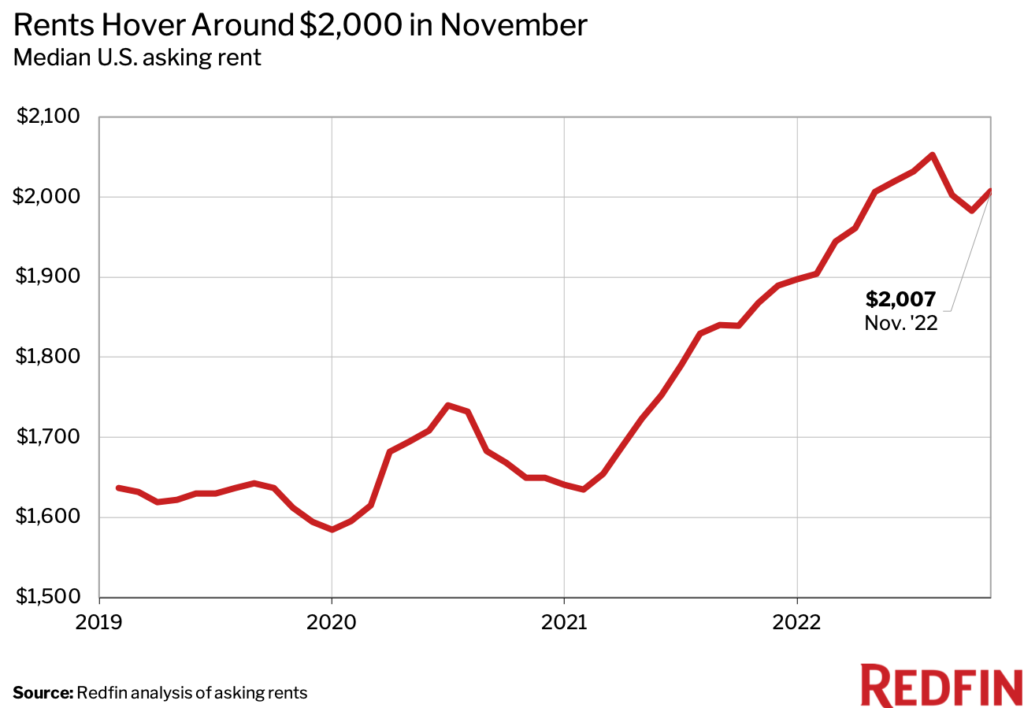
The median U.S. asking rent climbed 7.4% year over year to $2,007 in November, the smallest increase in 15 months and the sixth-consecutive month in which annual rent growth slowed. By comparison, rents were up twice as much in the summer. November also marked the third-straight month of single-digit rent growth following almost a year of double-digit increases.
“Rent growth is likely to continue cooling,” said Redfin Economics Research Lead Chen Zhao. “Asking rents are already down annually in 14 of the metros Redfin tracks, and we expect declines to become more common in the new year. That should ultimately help slow inflation further. Slow inflation will lead to lower mortgage rates, which should also bring more homebuyers back to the market.”
| Rental Market Summary | November 2022 | Month-Over-Month | Year-Over-Year |
|---|---|---|---|
| Median Asking Rent | $2,007 | 1.2% | 7.4% |
Rents Fell in 14 Major U.S. Metro Areas
In Milwaukee, the median asking rent declined 13.1% year over year in November, the largest drop among the 50 most populous U.S. metropolitan areas. Next came Houston (-6.3%), Austin, TX (-5.3%), Baltimore (-4.4%) and Minneapolis (-4.1%).
- Milwaukee, WI (-13.1%)
- Houston, TX (-6.3%)
- Austin, TX (-5.3%)
- Baltimore, MD (-4.4%)
- Minneapolis, MN (-4.1%)
- Chicago, IL (-3.8%)
- Denver, CO (-2.9%)
- Atlanta, GA (-1.8%)
- Dallas, TX (-1.8%)
- Jacksonville, FL (-1.8%)
- Boston, MA (-1.7%)
- Los Angeles, CA (-1.3%)
- Las Vegas, NV (-0.7%)
- New Orleans, LA (-0.3%)
Raleigh and Oklahoma City Saw the Largest Rent Increases
In Raleigh, NC, the median asking rent rose 21.8% year over year in November, the biggest increase among the 50 most populous metros. It was followed by Oklahoma City (17.9%), Indianapolis (15.8%), Cleveland (14.9%) and Nashville, TN (14.8%).
- Raleigh, NC (21.8%)
- Oklahoma City, OK (17.9%)
- Indianapolis, IN (15.8%)
- Cleveland, OH (14.9%)
- Nashville, TN (14.8%)
- Salt Lake City, UT (13.9%)
- Pittsburgh, PA (12.4%)
- Memphis, TN (10.1%)
- Cincinnati, OH; Miami, FL; San Diego, CA (tied at 9.2%)
- Columbus, OH (8.4%)
Median Asking Rents, November 2022
| U.S. Metro Area | Median Asking Rent | Year-Over-Year Change in Median Asking Rent |
| Atlanta, GA | $1,997 | -1.8% |
| Austin, TX | $2,166 | -5.3% |
| Baltimore, MD | $1,978 | -4.4% |
| Birmingham, AL | $1,545 | 2.9% |
| Boston, MA | $3,628 | -1.7% |
| Buffalo, NY | $1,557 | 7.3% |
| Charlotte, NC | $1,890 | 4.6% |
| Chicago, IL | $2,304 | -3.8% |
| Cincinnati, OH | $1,550 | 9.2% |
| Cleveland, OH | $1,522 | 14.9% |
| Columbus, OH | $1,557 | 8.4% |
| Dallas, TX | $2,065 | -1.8% |
| Denver, CO | $2,642 | -2.9% |
| Detroit, MI | $1,618 | 2.8% |
| Hartford, CT | $2,058 | 7.8% |
| Houston, TX | $1,711 | -6.3% |
| Indianapolis, IN | $1,497 | 15.8% |
| Jacksonville, FL | $1,582 | -1.8% |
| Kansas City, MO | $1,479 | 6.3% |
| Las Vegas, NV | $1,781 | -0.7% |
| Los Angeles, CA | $3,412 | -1.3% |
| Louisville, KY | $1,290 | 4.1% |
| Memphis, TN | $1,570 | 10.1% |
| Miami, FL | $3,268 | 9.2% |
| Milwaukee, WI | $1,670 | -13.1% |
| Minneapolis, MN | $1,791 | -4.1% |
| Nashville, TN | $2,070 | 14.8% |
| New Orleans, LA | $1,654 | -0.3% |
| New York, NY | $4,010 | 5.3% |
| Oklahoma City, OK | $1,234 | 17.9% |
| Orlando, FL | $2,084 | 3.1% |
| Philadelphia, PA | $2,290 | 2.0% |
| Phoenix, AZ | $2,028 | 0.7% |
| Pittsburgh, PA | $1,848 | 12.4% |
| Portland, OR | $2,546 | 7.4% |
| Providence, RI | $2,326 | 6.9% |
| Raleigh, NC | $2,100 | 21.8% |
| Richmond, VA | $1,716 | 2.5% |
| Riverside, CA | $2,677 | 2.5% |
| Sacramento, CA | $2,745 | 6.8% |
| Salt Lake City, UT | $1,917 | 13.9% |
| San Antonio, TX | $1,401 | 6.6% |
| San Diego, CA | $3,334 | 9.2% |
| San Francisco, CA | $3,681 | 8.1% |
| San Jose, CA | $3,450 | 4.6% |
| Seattle, WA | $2,994 | 4.8% |
| St. Louis, MO | $1,531 | 6.4% |
| Tampa, FL | $2,100 | 1.7% |
| Virginia Beach, VA | $1,677 | 1.0% |
| Washington, D.C. | $2,622 | 3.0% |
| National—U.S.A. | 2,007 | 7.4% |
Methodology
Redfin analyzed rent prices from Rent. across the 50 largest U.S. metro areas. This analysis uses data from more than 20,000 apartment buildings across the country.
It is important to note that the prices in this report reflect the current costs of new leases during each time period. In other words, the amount shown as the median rent is not the median of what all renters are paying, but the median cost of apartments that were available for new renters during the report month. Currently, Redfin’s data from Rent. includes only median rent at the metro level. Future reports will compare median rent prices at a more granular geographic level.