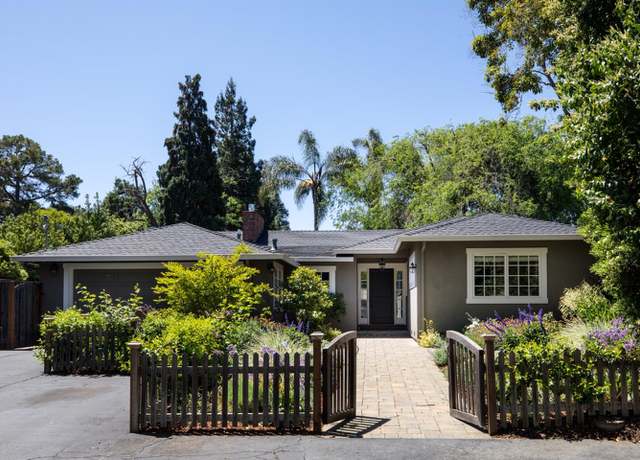
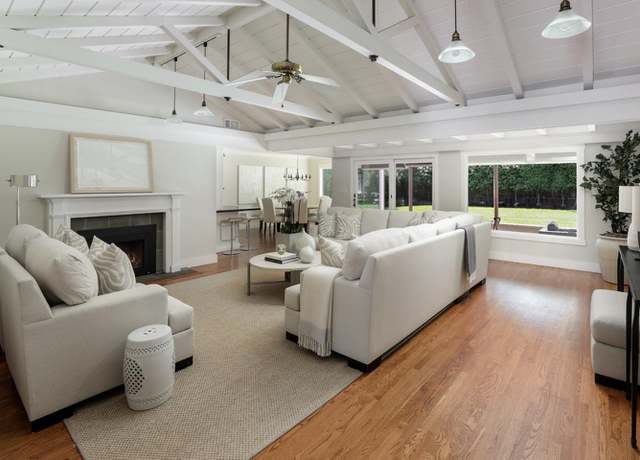
This extensively remodeled and expanded home is located on a quiet cul-de-sac just minutes to excellent schools plus cafes and restaurants. Flowering English gardens introduce the one-story home with 4 bedrooms and 3 baths set on more than one-quarter acre. Classic designer style unfolds within with freshly painted interiors and fine hardwood floors throughout. A spacious living room with a cathedral ceiling, formal dining room, and designer kitchen with high-end appliances all flow together and to the outdoors where an extra-large rear yard includes an arbor-covered patio that feels like an outdoor living room with its retractable awning covered panels for sun protection. Just steps away i
Ideal for various stages of life, whether starting out, scaling up, or simplifying, this 3-bedroom, 2-bath, 2-car garage home merges the feel of a single-family home with the ease of townhome living. Designer style is showcased throughout the open and bright two-story layout, which features soaring vaulted ceilings and numerous clerestory windows that fill the home with exceptional natural light. Fresh updates include newly painted interiors, new carpet, and fine hardwood floors. The kitchen and both bathrooms are beautifully remodeled in a palette of white, harmonizing with the soft neutral tones that extend throughout. One bedroom is thoroughly customized for today's remote work needs and
Welcome to 1295 Albion Court Sunnyvale, a spacious 5-bedroom 3.5- bathroom home nestled on a serene cul de sac just a stones throw from the Los Altos border. Boasting 2,732 sq. ft of living space on a generous 7,841 sq. ft lot, this home has been tastefully updated throughout. Remodeled bathrooms, fresh paint & gleaming hardwood floors. Light-filled chefs kitchen features stainless steel appliances, quartz counter tops, breakfast bar and a sunny nook. There is both a formal living room and a separate family room, each adorned with wood-burning fireplaces. Convenient ground floor bedroom features and adjacent full bathroom. The spacious primary bedroom features a large walk-in closet,
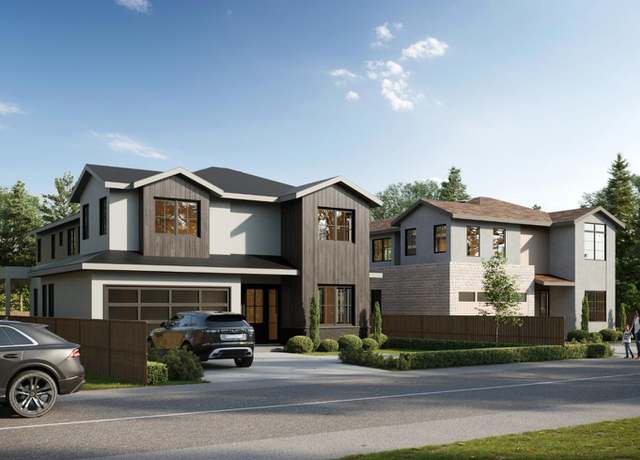
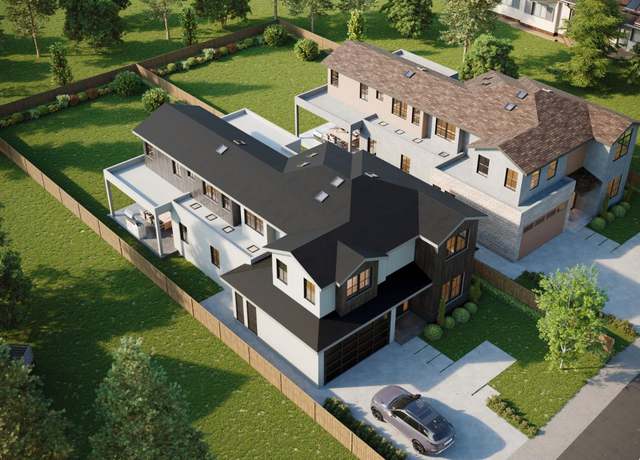
Indulge in the epitome of contemporary living within Mountain View's sought-after Waverly Park neighborhood, where architectural brilliance meets modern luxury. Crafted by the esteemed architect Pearl Renaker of Tektive Design, this residence boasts 5 bedrooms, 3.5 baths, and 3,225 square feet of meticulously designed space. Immerse yourself in seamless indoor-outdoor living through panoramic sliding patio doors, effortlessly connecting the impressive 466-square-foot covered patio to the kitchen and dining areas. Upstairs, discover a sanctuary with 4 bedrooms, 2 baths, and a versatile loft, while the lower level hosts a full suite within the attached ADU. Outside, the sprawling backyard, sp
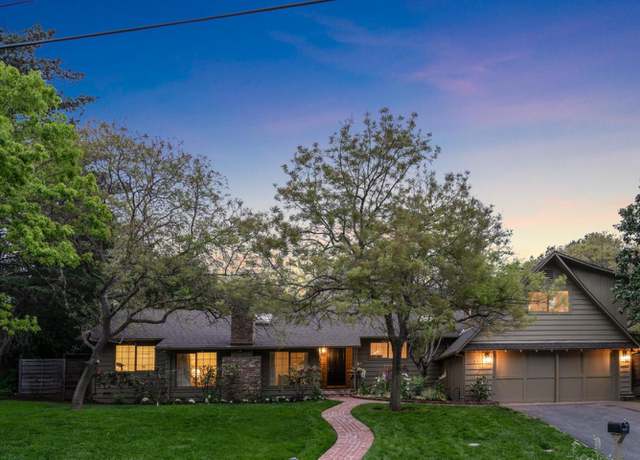
Located in the sought-after Highlands neighborhood, with access to highly acclaimed Cupertino schools, this home presents classic and timeless appeal. With freshly painted interiors and refinished hardwood floors, this home is ready to move-in and enjoy today, yet also offers excellent potential to further customize. The spacious main living room is enhanced by a soaring ceiling, while the dining room is distinguished by wraparound walls of glass and the eat-in kitchen has been updated in a white palette. The 5-bedroom, 3-bath floor plan spans mostly one level with the addition of a secluded multi-room suite upstairs offering versatile space for extended family, an au pair, or remote office
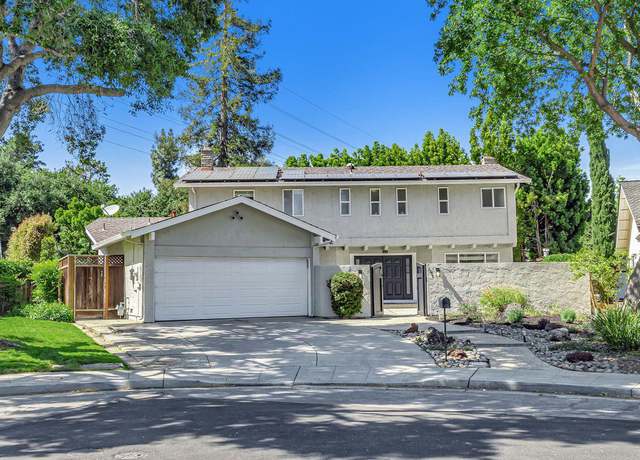
Light, Bright, Beautiful Home, Move-In Condition, Pride of Ownership Neighborhood * West Valley Elementary School, in Award Winning Cupertino Union School District * Corner Lot * Surrounding Trees Give a Feeling of Privacy in Backyard, Patio Area for Relaxing and Entertaining * Nearby Shopping, Restaurants, Concerts, Easy Access to Freeways 280/85/101 * Family Memories: Our parents' home was a gathering place for the whole family, for holidays, celebrations, we would always go to Baachan's (Grandma's) house, we have many warm memories of our family get-togethers there. It is a very friendly neighborhood, with many long-time homeowners. Wonderful Kaki (Persimmon) Tree, we wish we could take
Experience the perfect blend of elegance and comfort in this exquisitely remodeled home situated in one of South Los Altos' most sought-after neighborhoods. This modern residence offers 4 BEDS / 2.5 BATHS, plenty of natural light, designed with contemporary finishes and high-end features throughout. The floor plan includes both a separate living room and a family room with vaulted ceilings and skylights, providing ample space for relaxation and entertaining. The brand-new kitchen is a culinary dream, featuring sleek countertops, premium appliances, and a Butler's pantry for additional storage and meal prep - perfect for keeping the main kitchen tidy and ready for guests. The primary bedroom
Absolutely Stunning Townhome! Feels like a Single Family Home with 3 spacious bedrooms, 2.5 baths, and multiple outdoor spaces! Located in sprawling Toyon Farm 16-acre community with just 60 homes in a tranquil setting and only minutes from schools and amenities. Dramatic high ceilings, tremendous natural light, open floor plan with easy access to two large decks. Chefs dream kitchen with deep quartz countertops, modern cabinetry, top-of-line Thermador appliances including gas cook-top with hood and Brizo faucets (including pot filler). Primary suite has 2 closets (one walk-in) & en-suite bath with extra large vanity. Two other bedrooms, including one with walk-in closet, are served b
Use your imagination to optimize the majestic grounds of this half-acre lot with stunning tree-lined views and a burbling creek in the rear. Located in the esteemed Los Altos Golf and Country Club area. Create a sanctuary with ambience that evokes quintessential California living for those who relish nature, open space and serene surroundings. Fruit orchards were once popular on this site and nearby properties. With a lot frontage of 120 sqft wide there are many possibilities. Build your dream home on a mostly-flat, approximately 26,000+ lot with plenty of room to build. This property benefits from the prestige and convenience of being situated close to top-ranked amenities, world-renowned
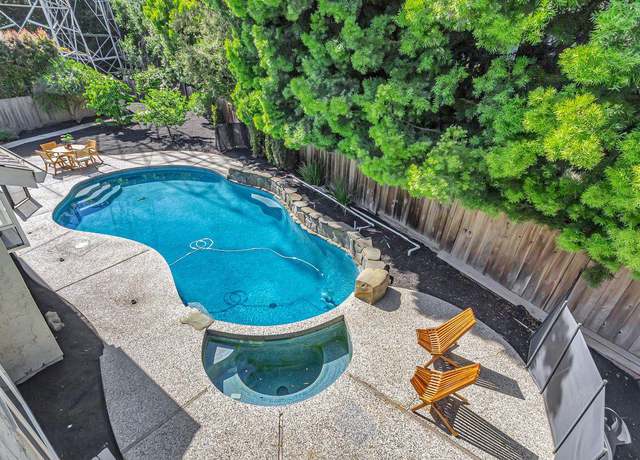
EXTRAVAGANT ESTATE WITH LUXE POOL RETREAT | Within blocks of exclusive Downtown Los Altos, this residence is newly updated to bring you a lifestyle of sophistication and luxury. Entertain in gorgeously appointed gathering areas, or step through folding glass walls to a spectacular backyard with pool, outdoor shower, and terrace with heated lounge. Four ensuite bedrooms and a library are arranged on the main level, while a guest suite, media room, and recreation lounge with full bar await downstairs. Towering ceilings, designer finishes, gorgeous hardwood floors, and multiple skylights instill a sense of contemporary elegance throughout. This coveted setting in a premier neighborhood enjoys
Experience luxurious living in this end-unit PUD townhouse nestled in one of Silicon Valley's most sought-after neighborhoods. Step into a bright and inviting interior adorned with skylights and a sliding door leading to your own private backyard retreat, where you can bask in the tranquility of California's perfect weather. A generously sized bedroom versatile enough to serve as a guest room, family room, entertainment space with wet bar and beverage center, offering flexibility to suit your lifestyle. On the upper level, the expansive living room beckons relaxation and entertainment, boasting a contemporary fireplace and balcony overlooking the community pool and spa. The updated kitchen
Just steps from downtown Los Altos, this designer home boasts fine walnut floors, high-end finishes and fixtures, a fantastic single-level floor plan, two bedroom suites, and a luxurious backyard oasis for entertaining and dining alfresco. The living/dining room welcomes you with a wall of sleek built-ins and direct access to the gorgeous chefs kitchen complete with Calacatta marble countertops, stainless steel appliances, and custom cabinetry. The casual dining room opens to the kitchen, family room, and entertainers yard and outdoor kitchen. The primary suite has double French doors to the yard, custom tiled spa, cold plunge, and a retreat-like bath. The secondary suite overlooks the fron
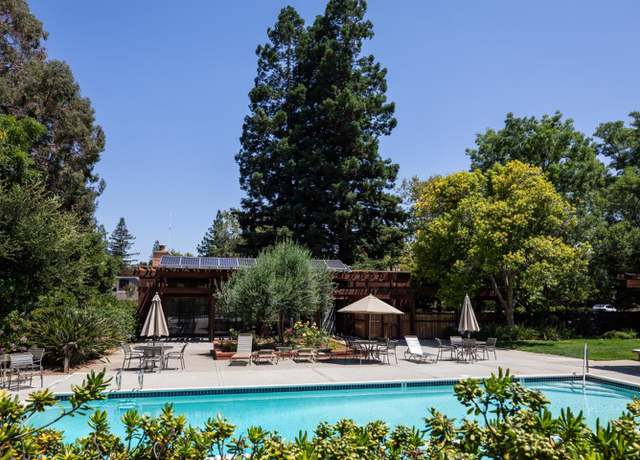
Beautifully remodeled Eichler located in lovely Fallen Leaf Park. This home of nearly 2,300 Sq Ft features an atrium entry, great natural light, dual pane windows, air conditioning, a formal dining room, an office near the kitchen, a wood burning fireplace in the living room and a gas fireplace in the family room. The primary bedroom features an ensuite bathroom with dual vanity, walk-in closet and access to the backyard. Perfect for entertaining, you will enjoy the large low maintenance backyard, solar heated pool, and private outdoor dining and grilling area. Great location with close proximity to schools, parks and freeways.
Quiet luxury awaits. Very special, spacious and lovely single level property, a few blocks to vibrant downtown. High ceilings doors and windows. Superior private location in 10 home development privately nestled on a large corner lot-with the sparkling pool steps away. Great floor plan. Interior features timeless high end design finishes including a soaring wood wrapped ceiling in the living and dining room, in an oversized chef's kitchen, dramatic frameless bay window over the sink, gas island cooktop, breakfast bar, and large casual dining area. Step from the kitchen, or living room outside onto newer composite decking and a pristine easy care yard-and enjoy the quiet rustle of the gorgeo
Welcome to this newly renovated haven nestled in Los Altos. Fully updated in 2021, this home sits on a very private 10,000 sq ft flag lot, offering ideal privacy. Upon entering, the luxurious open floorplan home, the attention to detail has been thoughtfully selected. Featuring Milgard windows/doors with smart touch handles, top-of-the-line Miele and Thermador appliances, a spacious island, and exquisite wood cabinetry. Additionally, a water conditioning system ensures purity with a Pentair salt-free, TAP technology water conditioner. Beautiful white oak hardwood flooring spans throughout the home, providing great natural light. A large attic and loft area provide additional storage, and th
Sought-after premier North Los Altos neighborhood w/ great schools. Comfortable, private & peaceful single-story home w/ gleaming refinished hardwood floors a private wing w/ 3 bedrooms & 2 baths. Good-sized bonus room with a separate entrance & half bath close by, a window w/ a view of the front gardens & new carpeting that could be a great work-at-home office, exercise room, or playroom to name a few options. Recently painted inside & out plus a new HVAC system. Open floor-plan w/ family room/dining room separated by pocket doors to the living room create a large spacious area w/ sliding glass doors to the back patio & mature landscaped yard. A home tha
Thoughtfully renovated and expanded in 1999, this inviting North Los Altos home features 4 bedrooms (2 ensuites), 3.5 bathrooms, and many custom features. Skylights, multiple sets of French/sliding doors, and tall windows fill this home with natural light, while custom-designed cabinetry maximizes space and adds storage. The open living room features a wall of French doors leading to the rear terrace while another set of French doors in the adjoining dining room provides a western exposure. The kitchen and family room offer a soaring ceiling, a second fireplace, and an elongated breakfast bar perfect for casual entertaining. Sliding patio doors allow easy access to the rear terrace, a charm
Los Altos Craftsman in the quiet Loyola Corners neighborhood without through traffic. Near top-rated schools such as Loyola Elementary, Georgina P. Blach Junior High School, and Mountain View High School, as well as, private schools Pinewood, St. Francis, and Bullis Charter (buyer to verify). The home offers easy access to I-280, Snap Fitness gym, parks (McKenzie, Heritage Oaks, Merrymeade, and Rancho San Antonio Preserve), and Rancho Shopping Center. It features a bright, open floor plan with a gourmet kitchen equipped with top-of-the-line SubZero and Wolf appliances, Thomasville cabinetry, granite countertops, and a Carrera marble island. Hardwood floors throughout the main level are comp
Nestled in one of the most prestigious residences in downtown LA, this opulent home resides w/ in one of the most coveted addresses, 100 First St! This luxurious single-level one bedroom + den is seldom seen on the market! Positioned on the desirable second level w/ breathtaking sunset views that overlook Lincoln Park. A modern & airy open floorplan features: soaring ceilings, expansive doors & windows, custom finishes & exquisite wood floors. Spacious balcony-an entertainer's delight ideal for guests! Gourmet kitchen w/ top-tier Viking SS appliances, custom cabinetry & stone counters. A generous primary suite w/ a spa-inspired bathroom, walk-in closet & tucked
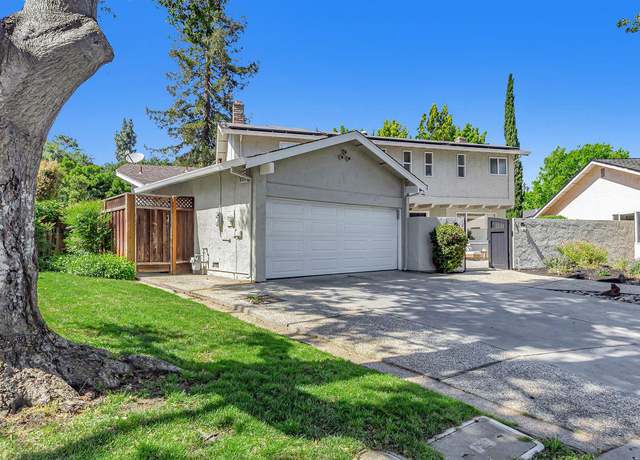
Come see this spacious home conveniently located at the gateway to the Los Altos Highlands. Enter the south-facing home and feel the natural sunlight energize the large step-down living area. Floor plan is smartly divided between living area & bedroom wing for comfort living. Centerpiece Kitchen presides boldly over the casual dining area & Family room while soaking in a view of the rear court & yard. Lots of glass windows, high ceilings, inside laundry, attached garage. Close to shopping, medical, commutes and parks. TOP Cupertino Schools!
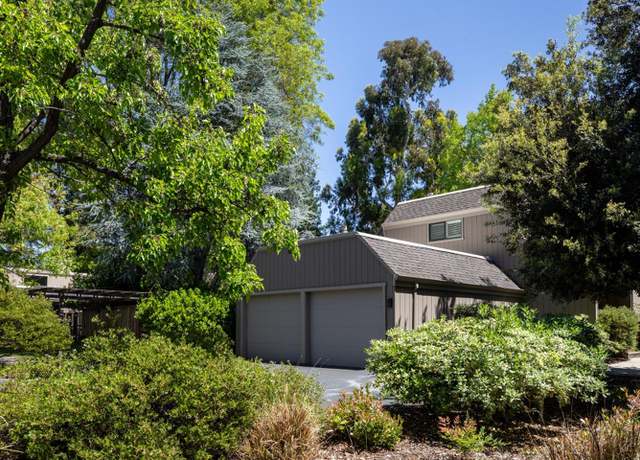
Serenity and tranquility envelop this home. Toyon Farm is the antidote to high density living with only 60 homes on ~16 acres of landscaped grounds and walking paths. This particular home is in one of the most secluded locations within the park-like grounds - and this spacious 3/2 floorplan is rarely available. Thoughtfully architected, this move-in ready home features soaring ceilings that create a voluminous open feeling and large windows that connect you to the naturesque surroundings. The modern kitchen and bathrooms plus other upgraded finishes complete this move-in ready home. There is even a large private deck that enables outdoor living and an extra large 2 car garage with bonus sto
Welcome to your Los Altos Oasis! Built in 2015, this custom home boasts 5 bedrooms, 2 offices, an oversized basement, 5 full bathrooms, 2 powder rooms across 6,451 square feet of living space. Enjoy a half-acre lot with stunning tree-lined views. Inside, a grand entry leads to a living room with a cozy fireplace. The great room seamlessly combines kitchen, dining, and family areas, flowing to the patio and backyard. Hardwood-inspired tiles grace the floors, while the kitchen features high-end Wolf/Sub-Zero appliances and a walk-in pantry. The basement offers entertainment as a movie theater, bar or game room. Retreat to the primary bedroom with views, a walk-in closet, and a luxurious bathr
Welcome to a rare gem in beautiful Los Altos, a residential dream property awaiting transformation! This single-family home offers 2,072 SF of endless potential on a 6,970 SF lot, promising a lucrative opportunity in one of Silicon Valley's most coveted neighborhoods. Well located on a quiet street, this property sits perfectly positioned among beautiful neighboring homes. The allure of this location also lies in its proximity to top-rated schools, making it ideal for those seeking unparalleled educational excellence opportunities, adding undeniable value to the property. Envision the possibilities and consider the potential for renovation or expansion to maximize returns. For those fortuna
Stunning Downtown Los Altos condo with private entrance. This modern home includes high ceilings, large windows, hardwood floors, elegant finishes throughout 1st Street! Perfect kitchen for entertaining includes granite, designer splash, GE Monogram appliances & a dining bar. This home provides a spacious living/dining combo w/ hardwood floors & abundant natural light. Built-in desk in bedroom and ample closet space. The bathroom has a large linen cabinet and a shower/tub & granite. Elevator for accessibility. Car charging stations are 1 blk away. Additionally, the home includes an assigned parking space and a storage closet in the patio and additional storage, providing a
Nestled in the heart of Los Altos, this spacious new construction offers 4 bedrooms, 4.5 bathrooms, and an ADU studio in the backyard. With 3,093 sq. ft. of living space and an 8,375 sq. ft. lot, it's close to top-rated schools like Almond Elementary, Egan Middle, and Los Altos High. The home is designed with Feng Shui principles to harmonize wealth and health and can be seen throughout the home's interior features. The kitchen features state-of-the-art appliances, sleek cabinets, and stunning countertops. The living room has soaring ceilings, a warm fireplace, and a view of the landscaped front yard. The primary suite includes a large closet and an en-suite bathroom. The exterior boasts a
UNLIKE ANYTHING COMING OR AVAILABLE in charming downtown Los Altos. This fully entitled, architecturally designed development offers four units, each of a large size previously only possible by buying and putting 2 units together. Sold as an approved development ready to pull building permits, known to the trade as "shovel ready". The building provides elevator access to all floors, a small shared gym. two full size parking spaces per unit (no electronic lifts) with EV charging and a spare 9th space, individual storage rooms and a bicycle room. Designed with 2 three bedroom + office townhomes featuring 3.5 baths with over 3,000 sq ft each with private rear yard patios. They have a
Blending the excitement of the city with the charm and convenience of a close-knit residential community, this 27 Unit Condominium Development at 450 First Street is located in one of California's most desirable neighborhoods. This luxury complex has four stories of for-sale condos over two levels of secure and private underground parking. The building has a rooftop deck and entertaining area for the exclusive use of its residents. Located close to a fantastic selection of shops, restaurants, and cultural activities. Unit 209 features 2 bedrooms and 2 full bathrooms. The open concept living space features arched windows with a tree lined backdrop and private balcony. High end finishes throu
Blending the excitement of the city with the charm and convenience of a close-knit residential community, this 27 Unit Condominium Development at 450 First Street is located in one of California's most desirable neighborhoods. This luxury complex has four stories of condos over two levels of secure and private underground parking. The building has a rooftop deck with firepit, BBQ area and lounge seating for the exclusive use of its residents. Located close to a fantastic selection of shops, restaurants, and cultural activities. Unit 306 features two bedrooms and 2 full baths, one on either side of the open concept kitchen and dining area. Spacious living room with french doors to your priva
Welcome to your charming oasis in the heart of Loyola Corners! This delightful single-story house boasts two bedrooms, two bathrooms, a separate office/play area, and a host of desirable upgrades perfect for comfortable living. Step inside to discover a cozy yet spacious living/dining room with hardwood floors, recessed lighting, a coffered ceiling, and a modern gas fireplace. The bright kitchen features stainless appliances, recessed lighting, an eat-in area, a wine fridge, and direct access to the deck for outdoor dining. There are endless possibilities for the office/playroom with skylight and pocket doors. Rest comfortably in the generous primary suite with dual closets, french doors le
Sought after single-level condominium in a secure, elevator building with gated parking. All at a great central location - where Palo Alto, Los Altos and Mountain View converge and just 3 blocks from cafes, restaurants and groceries in the San Antonio shopping center. This stylish ground floor unit with an open floor plan features a foyer that leads to an eat-in kitchen. The kitchen opens to the large living/dining area with a sunny balcony. The ample master suite features a walk-in closet and additional balcony. The house has been fully remodeled to current modern, new kitchen with white shaker cabinets, new bathroom room and modern light fixtures, new floorings. Other amenities include wa
425 First is a boutique new development of 20 luxury condominiums in downtown Los Altos. Located just two blocks from Main Street, this collection of one-bedroom, one-bedroom plus den, & two-bedroom residences embrace the dynamic Los Altos lifestyle. The residences at 425 First showcase modern, open floor plans. Natural light flows gracefully into each residence, illuminating the thoughtfully designed sleek interiors. The residences boast high ceilings, wide-plank European Oak hardwood flooring, modern, European-style custom cabinetry, & Dacor professional stainless-steel appliances with a dual-fuel gas range. Residence 15 is a corner one-bedroom home with one bathroom. One parkin
Thomas James Homes proudly presents this stunning 4-bedroom, 3.5-bathroom residence located in Los Altos. This Transitional-style home makes hosting a breeze with the expansive dining and great room spaces, plus a gourmet kitchen with top-of-the-line appliances and an island with bar seating. The first floor ADU comes complete with a living area, kitchenette and en suite bathroom. Head upstairs to the second floor, which offers 2 secondary bedrooms, a full bathroom, and laundry room with sink and storage. Indulge in the luxuries of the grand suites walk-in closet and spa-inspired bath, which includes dual vanities, a free-standing soaking tub, and a walk-in shower. Estimated home completion
Nestled in the vibrant heart of Mountain View, this charming condominium at 2211 Latham St, Apt 124, offers a perfect blend of comfort and convenience. Set in a secure building that boasts elevator access and an exclusive underground parking space, this residence is designed for easy living. The unit features a cozy fireplace, an inviting balcony, and convenient in-unit laundry facilities, setting the stage for a serene living experience. Natural light floods the bedrooms, casting a warm glow that welcomes you into each space. Residents of this community enjoy access to a delightful array of amenities including a swimming pool, spa, BBQ area, and a playful outdoor space. Strategically posit
A rare opportunity to purchase one of the premier estates in Los Altos and a piece of Los Altos history! A stately 100 year old Colonial Revival style home on a flat 2/3 acre lot on a quiet cul-de-sac. Approximately 4,054 sq. ft of living space in the main house plus a one year-old 325 sq. ft. ADU, along with a 3-car garage, large workshop, and basement. It was a Designer Showcase Home in 1987 and has been beautifully maintained by the current owners. Grand-size common rooms with period details plus expansive yards, the perfect home for entertaining on a large scale. The most sought after Los Altos Schools: Oak Elementary, Blach Middle, and Mountain View High School! Great commute access to
South-facing, first-floor, 2b/2ba sunlit end-unit facing interior courtyard, not the road. Ideal for professionals and families, this home is close to Stanford and major tech companies, including Google, and falls within top-ranking Los Altos Schools: Gardner Bullis Elementary, Egan Junior High and Los Altos High School (buyer to verify). The primary bedroom features a large walk-in closet and ample storage space. There are abundant parking options, both underground and on the street. Located in a gated building near downtown, it offers easy access to an array of shops, restaurants, and cultural spots like the Los Altos Library, Community Center, and History Museum, as well as essential ame
425 First is a boutique development of 20 luxury condominiums in downtown Los Altos. Located just two blocks from Main Street, this collection of one-bedroom, one-bedroom plus den, and two-bedroom residences are perfectly positioned to embrace the dynamic Los Altos lifestyle. Newly constructed, the residences at 425 First showcase modern, open floor plans. Natural light flows gracefully into each residence, illuminating the thoughtfully designed sleek interiors. The residences boast high ceilings, wide-plank European Oak hardwood flooring, modern, European-style custom cabinetry, and Dacor professional stainless-steel appliances with a dual-fuel gas range. Residence 21 is a two bedroom home
Premier multi-family development opportunity. One of few underdeveloped sites in R3-1.8 zone. // Code recently modified to relax development standards and significantly increase allowed floor area and density. [For details contact listing agent or review disclosures] // Killer location: walk to Los Altos Village, proximate to 280, Foothill Expy, and San Antonio Rd // Excellent site access: front Lassen, rear alley.
This area's enrollment policy is not based solely on geography. Please check the school district website for more information.
Elementary schools
Middle schools
High schools
GreatSchools Summary Rating
9/10
Springer Elementary School
Public, K-6
8/10
Oak Avenue Elementary School
Public, K-6
8/10
Amy Imai Elementary
Public, K-5
8/10
Montclaire Elementary School
Public, K-5
8/10
Covington Elementary School
Public, K-6
Only showing 5 of
19 elementary schools.
School data is provided by GreatSchools, a nonprofit organization. Redfin recommends buyers and renters use GreatSchools information and ratings as a first step, and conduct their own investigation to determine their desired schools or school districts, including by contacting and visiting the schools themselves.Redfin does not endorse or guarantee this information. School service boundaries are intended to be used as a reference only; they may change and are not guaranteed to be accurate. To verify school enrollment eligibility, contact the school district directly.
Los Altos, California, offers a variety of transportation options, including a well-maintained network of roads for car travel. Traffic levels can vary, but generally, the city experiences moderate traffic, especially during peak commuting hours. Public transportation is available in Los Altos, with buses and light rail services providing connections to surrounding areas. Additionally, the city is conveniently located near major highways and freeways, including Interstate 280, providing easy access to other parts of California. Learn more on our Los Altos city guide.
What types of properties are available in Los Altos?
Los Altos, California offers a variety of single-family home types, including ranch-style, contemporary, and modern homes, each with its own unique architectural style and design. These homes can be found throughout the city, with many located in established neighborhoods and newer developments. Most properties in Los Altos feature three to five bedrooms and were built within the last few decades. To explore different property types for sale in Los Altos, California, use the 'Home type' filter located above the active listings. Customize your search by selecting options like single-family homes, condos, townhomes, and more.
What is life like in Los Altos?
Los Altos, California offers a serene and picturesque environment with its beautiful landscape surrounded by rolling hills and lush greenery. The region experiences a mild Mediterranean climate, characterized by warm summers and cool winters. The area provides a diverse range of job opportunities, particularly in the technology sector, with many renowned companies headquartered nearby. Residents can engage in a variety of recreational activities, including hiking in the nearby nature reserves, exploring local parks, and enjoying the vibrant culinary scene with numerous dining options. Additionally, the region hosts various community events and festivals throughout the year, providing ample opportunities for residents to socialize and connect with their neighbors.
What are the schools and amenities like in Los Altos?
Los Altos, California, offers a variety of public amenities for its residents. The city boasts a number of restaurants, catering to a wide range of culinary preferences. For those who enjoy the outdoors, there are several parks available for recreation and relaxation. Grocery stores are also conveniently located throughout the city, making it easy for residents to access their daily necessities. Additionally, Los Altos offers more amenities such as libraries, fitness centers, and community centers for the convenience and enjoyment of its residents.
In the past month, 20 homes have been sold in Los Altos. In addition to houses in Los Altos, there were also 23 condos, 2 townhouses, and 1 multi-family unit for sale in Los Altos last month. Los Altos is a minimally walkable city in Santa Clara County with a Walk Score of 46. Los Altos is home to approximately 29,108 people and 8,644 jobs. Find your dream home in Los Altos using the tools above. Use filters to narrow your search by price, square feet, beds, and baths to find homes that fit your criteria. Our top-rated real estate agents in Los Altos are local experts and are ready to answer your questions about properties, neighborhoods, schools, and the newest listings for sale in Los Altos. Our Los Altos real estate stats and trends will give you more information about home buying and selling trends in Los Altos. If you're looking to sell your home in the Los Altos area, our listing agents can help you get the best price. Redfin is redefining real estate and the home buying process in Los Altos with industry-leading technology, full-service agents, and lower fees that provide a better value for Redfin buyers and sellers.


 REDFIN IS COMMITTED TO AND ABIDES BY THE FAIR HOUSING ACT AND EQUAL OPPORTUNITY ACT. READ REDFIN'S FAIR HOUSING POLICY AND THE NEW YORK STATE FAIR HOUSING NOTICE.
 United States
 Canada