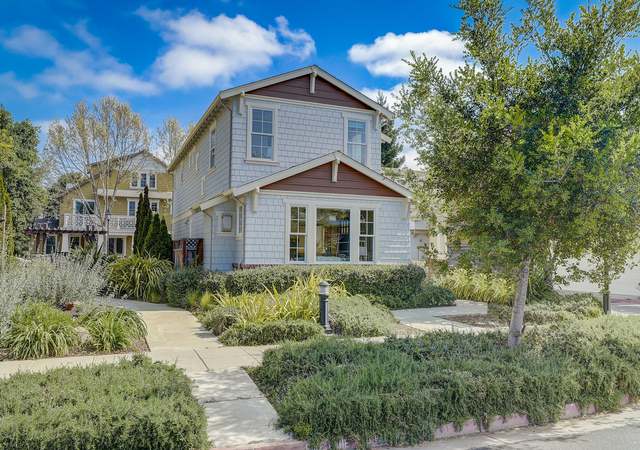
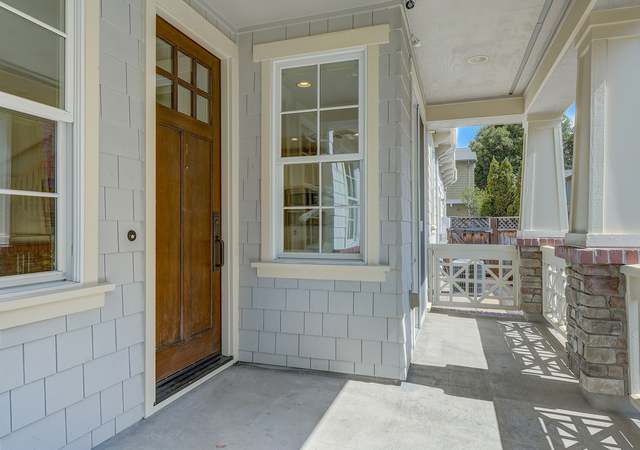
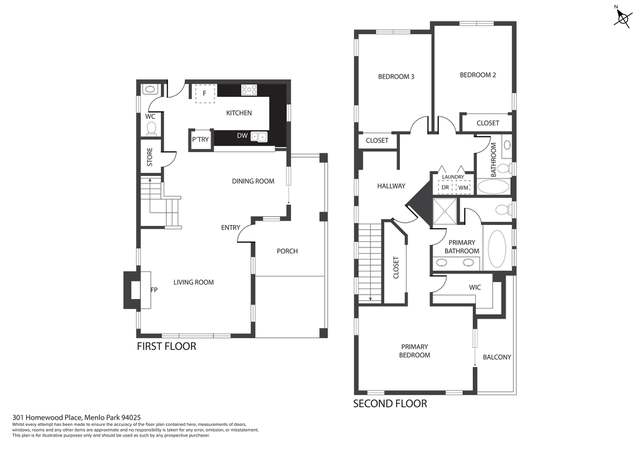
Welcome to this charming home in the highly desired Linfield Oaks neighborhood! Step into the light-filled large open living and dining room with newly refinished hardwood floors, duo-fold Roman shades and gas fireplace. Kitchen has granite slab counters, slab backsplash and views of the side yard. Powder room adds functionality to the main level. Second floor presents 3 BRs with new carpet and 2 BAs. Primary suite beckons with a spacious walk-in closet, additional closet and a balcony to enjoy the sunshine. Pamper yourself in the primary bathroom, complete with a separate shower and large tub, featuring a water-efficient shower head. 2 smart thermostats control the perfect temperatures for
This fully gated estate on a private wide frontage parcel underwent a remarkable transformation in 2009 and emerged an architectural marvel that seamlessly blends contemporary design with opulent comfort. Quietly understated, while showcasing intricate craftsmanship, every detail of the home fuses artistry and comfort. Clean lines of natural stone contrast warm wood tones, while walls of windows bring the surrounding landscape indoors at every glance. Flow between the interior and exterior spaces is seamless, infinitely expanding the space and welcoming a quintessential California lifestyle. The meticulously designed and cultivated landscape provides an ideal venue for entertaining, from va
Nestled at the end of a private cul-de-sac in Menlo Parks sought-after Allied Arts neighborhood, this extensively updated home merges tranquility with downtown convenience. The residence shines with natural light and modern updates, boasting a chef's kitchen with luxury appliances and dramatic vaulted roof windows. The open layout is ideal for both daily life and entertaining. The primary suite offers a restful retreat, featuring high ceilings, spacious bath with skylight and heated floors, and direct backyard access. Outside, the peaceful garden provides a private oasis for relaxation or entertainment. Nealon Park and Sharon Hills Park add to the outdoor recreational options, while the bus
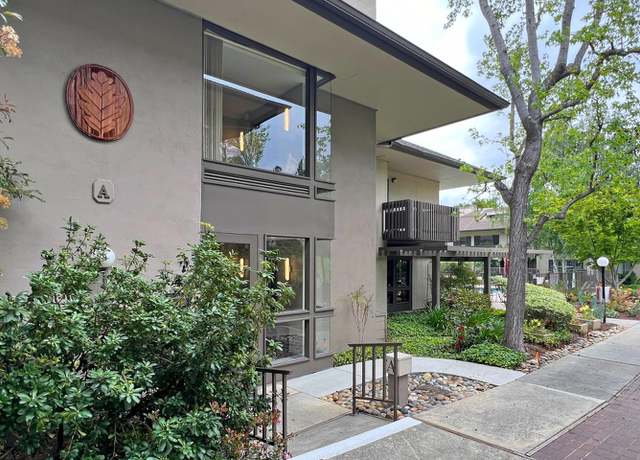
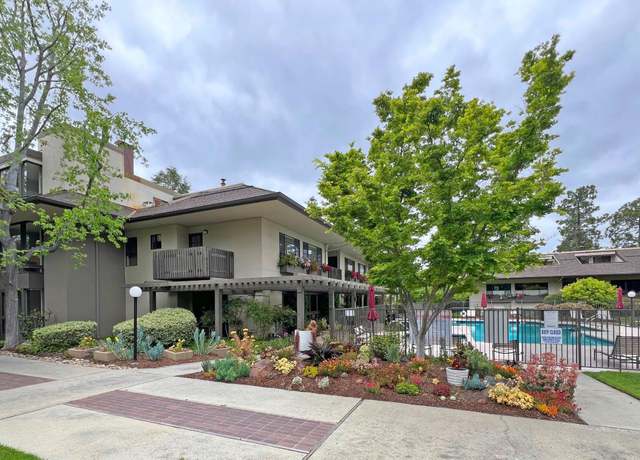
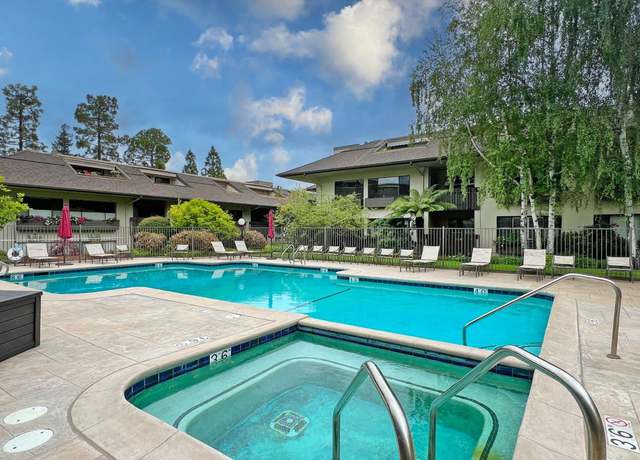
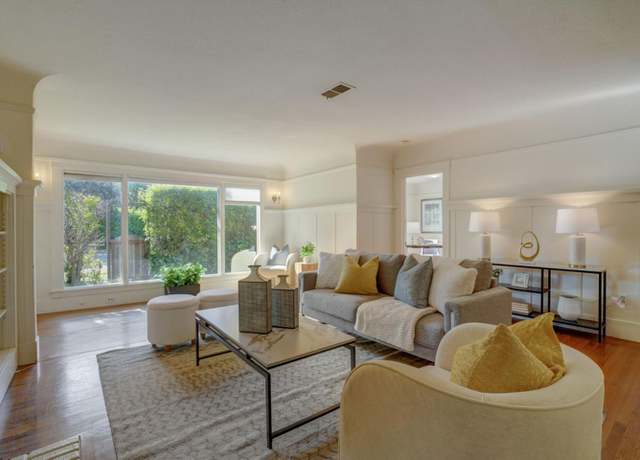
Phenomenal value! Menlo Commons a 55+ living community. Beautiful top floor, single level condo with large patio and extra storage. Gated community. Secured garage with 1 car parking. Close to Stanford University and easy access to Sharon Heights Shopping Center and Freeways. Must See!
1/18
$749,000
1 bed1 bath740 sq ft
2140 Santa Cruz Ave Unit A303, Menlo Park, CA 94025
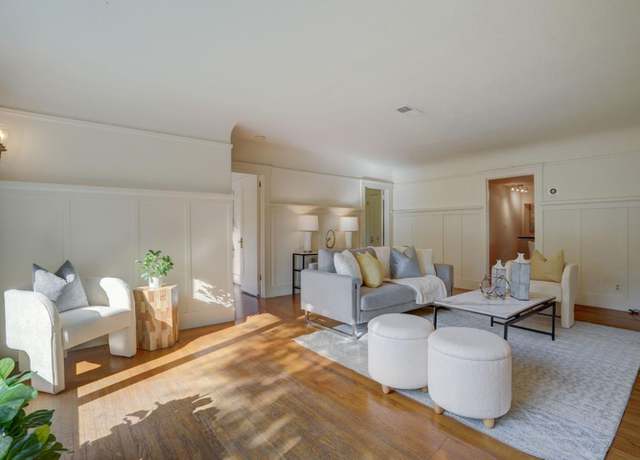
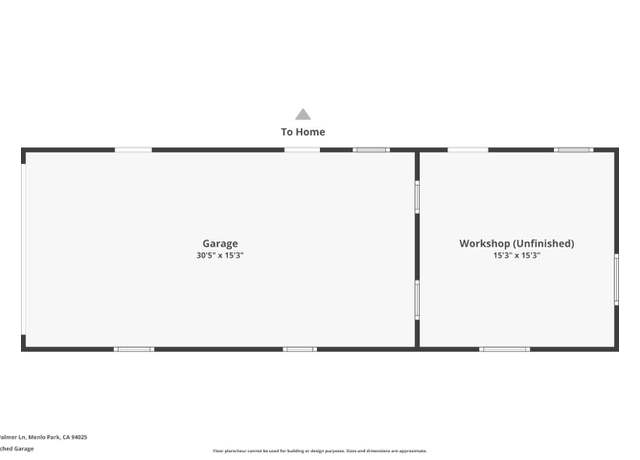
Opportunity meets charm at 541 Palmer Ave, nestled in Menlo Park's North Fair Oaks neighborhood. This property offers the chance to build your dream home or remodel/expand the existing four-bedroom, three-bathroom residence, complemented by a detached garage with bonus space. Situated on a flat, rectangular 12,000 square foot lot, the potential is endless. Palmer Lane boasts several newer and larger homes, offering a unique canvas to customize your next home. Step inside to discover a privately fenced sanctuary featuring large windows that flood the interior with natural light. Hardwood floors add warmth and character to the flexible floorplan, which includes a formal dining room ideal for
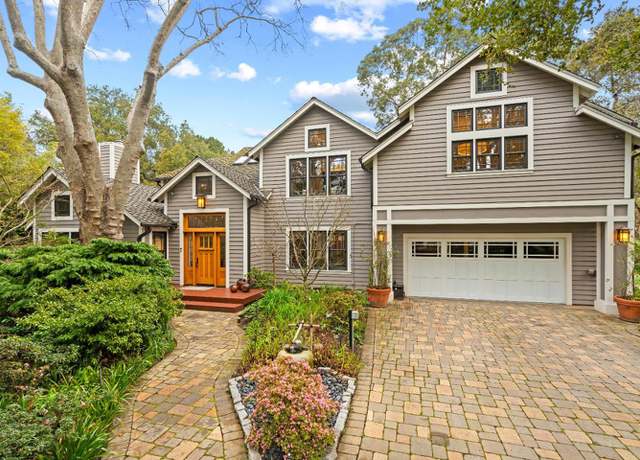
Crafted by Moderna Homes, this rare, newer Mid-Century Modern-inspired home in a prime cul-de-sac location offers unparalleled luxury! Soaring 16-foot ceilings flood the sunken living room with natural light. Enjoy entertaining by the indoor-outdoor fireplace. Imagine creating amazing meals in your chef's kitchen equipped with top-of-the-line Miele appliances. Relax in the upstairs primary suite offering a steam shower, balcony, & a spacious walk-in closet. Two additional bedroom suites are on the upper floor. Providing flexibility for guests, extended family or a home office are two main level bedrooms. The lower level offers additional living areas. Radiant heat, EV charging, &
In the heart of downtown Palo Alto resides this gorgeous modern Craftsman home that emanates warmth and hospitality from the moment you step inside. Nearly 1,800 total sf of contemporary space enjoys stylish appointments and numerous upgrades, from gleaming hardwood floors and high-end appliances, to a new roof, updated kitchen, remodeled bathroom, and much more. A fireplace centers the expansive living room, the dining room opens outdoors for al fresco entertaining, and a seamless connection to the backyard provides an ideal venue to enjoy indoor/outdoor living, complemented by a detached studio guest house. And this incredible location offers tremendous walkability beautiful parks, vibra
Move in and enjoy this newly renovated home nestled in the beautiful Westside neighborhood of Menlo Park near Stanford University. Three large bedrooms plus a huge enclosed office. Beautiful full house remodel in 2024. Meticulously improved with elegant designer touches. Gleaming engineered wood floors. Stunning chef's kitchen with recessed lighting, dual ovens and quartz countertops. Spacious living room with high ceilings. Gorgeous bathrooms. Double pane windows and sliding doors. Dream primary suite with walk-in closet and a fantastic ensuite bathroom. Inside laundry. Large, peaceful and private backyard with huge deck for fantastic outdoor entertaining and daily living. Inspiring views
Robles Apartments is an exceptional pride-of-ownership 13-unit multifamily asset located in the thriving city of Menlo Park. Situated on a 13,320 square foot parcel of land, the subject property was originally constructed in 1959 and has a gross building area of 12,348 square feet, offering its tenants beautifully designed two-bedroom and one-bedroom floor plans featuring individual water heaters. The subject property also offers tenants convenient amenities such as private parking, carport storage, and an on-site laundry facility. The subject property boasts a prime location positioned immediately adjacent to Downtown Menlo Park. This vibrant area offers an abundance of upscale shops and r
Fabulous Completely Renovated Home in West Menlo Park on Lovely Landscaped 5,650+/- Lot. Elegant Living Room with Fireplace. Stunning Eat-in Kitchen with Marble Countertops. 2 Spacious Bedrooms. 1 Bathroom. Beautiful Hardwood Floors. Lovely Landscaped Yard. Award Winning Las Lomitas School District. Close to Downtown, Stanford Shopping Center, Stanford University, and Sand Hill Road. Conveniently Located by 280.
Exquisite two bedroom, two and a half bathroom townhome w/ two-car garage provides a serene sanctuary amidst towering redwood trees. Spanning three levels, this home captivates with its grand living room featuring soaring two-story ceilings and expansive floor-to-ceiling windows framing nature's beauty. A wood-burning fireplace adds warmth, setting the stage for intimate evenings or lively gatherings. The dining room overlooks the striking living room offering an elegant backdrop for memorable meals with family and friends. The open-style kitchen and family room extends to a balcony for alfresco dining or yoga practice. Upstairs, two inviting primary bedroom suites await, each with its own
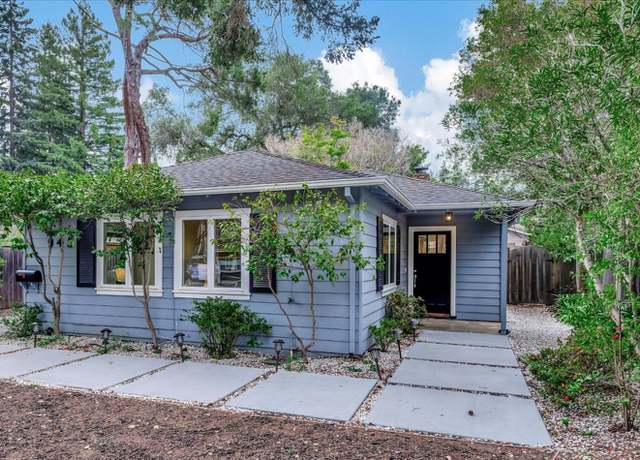
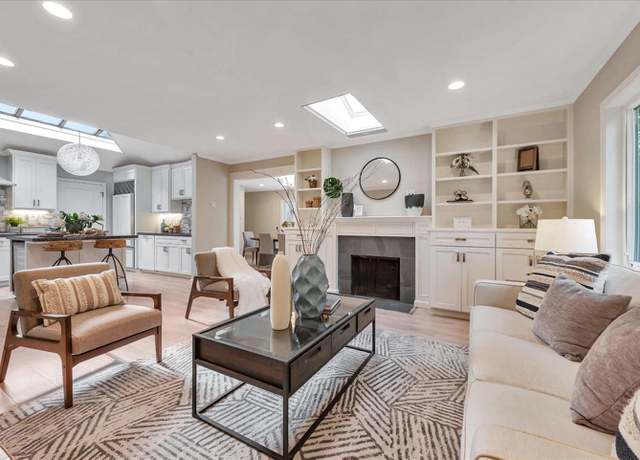
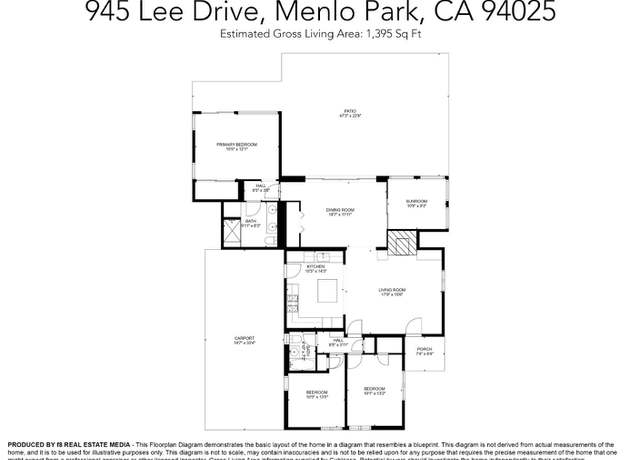
Rarely available updated one level home, tastefully appointed to create the ultimate in indoor/outdoor living and all in a great location. Hardwood floors throughout this sun lit home with vaulted ceilings. Eat in chefs kitchen with stainless steel appliances, gas range, adjacent breakfast nook and built in desk area. Flexible use additional bedroom or office conveniently located off of the living room and kitchen. Open concept dining and living room with vaulted ceilings, gas fireplace, skylights and multiple doors leading to the rear yard. The primary suite is generous with vaulted ceilings with tons of natural light. The primary bath is luxurious with vaulted ceiling dual vanity, shower
Opportunity knocks, this Single family property was operating as a kid's private & nursery school since 1960s until last year 2023. Zoned R1000U, the square footage is approximately 1,299 sq. ft in the main house, the 2nd structure is a garage space (approx. 400sq. ft) that was converted into a classroom back in 70s. The 3rd structure in the far back corner is the nursery play house structure. The lot size is 56x200 (11,200 sq. ft) that can be split under SB9 according to the city. Great location, easy access to both downtown Palo Alto and Menlo Park, 101, tech companies like Meta, google, Stanford and more
Stunning Home in Prime Menlo Park. Elegant Living Room with Fireplace and Built-in Bookshelves. Formal Dining Area. Gourmet Kitchen with Granite Countertops and Ample Storage. Primary Suite Retreat with Office Area and Fireplace. 3 Bedrooms. 2 Bathrooms. Lovely Landscaped Yard. Award Winning Las Lomitas School District
Nestled on a tree-lined street in the beloved neighborhood of The Willows, this elegant new construction blends function and beautiful modern design with today's lifestyle in mind. Enter through the mahogany door to find wide planked flooring, 9' ceilings, and rooms filled with natural light. The versatile fourth bedroom downstairs suits an office, fitness room, or guest quarters. The stunning kitchen features a large island with custom rift-cut white oak finish cabinetry crowned by the porcelain tile waterfall countertop. Equipped with premium Thermador appliances, including a six-burner double oven range and integrated refrigerator, the kitchen invites casual dining at the island or the s
OUTSTANDING, just completed CUSTOM REMODEL in fantastic Menlo Park location! Spacious and light, this stunning contemporary home has been meticulously remodeled with no expense spared! The striking modern interior features an open floorplan with soaring ceilings and well proportioned rooms complemented by fine finishes such as wide plank European Oak floors, custom cabinetry, marble slab countertops, custom lighting and quality fixtures & fittings throughout. * Dramatic Living Room with modern gas fireplace & a wall of sliding glass doors opens out to the spacious rear deck * Gorgeous new gourmet Kitchen features a large island with counter seating, custom cabinetry, marble sla
This graceful residence, in the treasured Suburban Park neighborhood, is defined by its open concept living spaces, refined design elements and endless entertaining possibilities. Just moments from both Flood Park and the Meta campus, the home is poised for an active lifestyle. The cheery façade and inviting porch transitions to the open floor plan just inside. The recently (2023) renovated chef's kitchen offers an expansive center island, quartz slab counters, Thermador stainless appliances and opens to the bright family room creating a true great room that spills out to the idyllic rear yard for lively indoor-outdoor entertaining. The main level features a 4th bedroom perfect for v
Welcome to this elegant 3-bedroom, 2.5-bathroom home located in the North Fair Oaks neighborhood of Menlo Park, CA. This beautifully renovated residence exudes sophistication and offers a generous 1,689 square feet of living space and a detached 2-car garage. Step inside to discover a spacious living room with vaulted ceiling. The kitchen boasts a charming island, granite countertops, complemented by hardwood cabinets and a gas stove, creating a space where culinary delights come to life. Designer bar lights add an extra touch of refinement to the space. This home is ideally situated to provide a seamless blend of convenience and functionality. Step outside to unwind in the peaceful backyar
Welcome to 2170 Gordon Ave, nestled in the heart of Menlo Park. Boasting 4 bedrooms and 2.5 baths, this ideally situated home is near exceptional Las Lomitas schools, lush parks, and vibrant restaurants. Step inside to a light-filled family room highlighted with large windows and lots of space to relax and entertain. The upgraded kitchen features stylish countertops and plenty of storage. The master suite provides a serene retreat with a private en-suite bath, offering a relaxing escape after a long day. Three additional bedrooms and well-appointed bathrooms offer versatile living spaces that can be tailored to suit your lifestyle. Step outside to the expansive backyard, where endless possi
Imagine a private and peaceful setting and a home with an abundance of curb appeal and you will know you have arrived at 1990 Camino de Los Robles. This warm and welcoming home spans two levels and was designed with an emphasis on light and open spaces, high ceilings, and a soothing color palette. Situated on a 7546 +/- square ft corner lot, this special four bedroom home offers two levels of comfortable living space and an easy flow between rooms. The property is located in the sought after Las Lomitas School district.
Vibrant downtown living with stunning views and modern convenience! This 2br 2ba corner is one of the building's most coveted floor plans with open living, kitchen, and dining areas. Abundant natural light showers the space and an expansive ceiling-to-floor windows give away picturesque courtyard views. one- level. Newer interior painting, flooring, and ample walk-in closets. The best perks are the 24/7 security and on-site manager. Concierge service for package pickup and receiving, dry cleaning pickup and delivery. Travel? Just drop off keys and go. Amenities include: Gym, pool, pool-side pavilion, on-site laundry, and more. EV chargers to go live soon!
Custom Built Three Story Home with Unmatched Privacy and Quality of Construction. Formal Entry. Elegant Living Room with Fireplace and Built-in Window Seats. Separate Dining Room with Boxed Beam Ceilings. Chef's Eat-in Kitchen with Center Island with Sink, Breakfast Bar, Farmhouse Sink, Inset Cabinetry, Two Dishwashers, Butler's Pantry, and Ample Storage. Opens to Spacious Family Room with Fireplace, Vaulted Ceilings, Accordion Doors, and Ample Natural Light. Separate Main Level Office with Built-in Custom Cabinets. Mud Room with Built-in Cabinets. Main Level Bedroom Suite. Upper Level Features Laundry Room and Four Bedroom Suites with Loft Area. Exquisite Primary Suite with Fireplace and B
The epitome of timeless elegance & modern luxury on one of Menlo Parks premier streets. Custom built by current owner featuring a fabulous layout spanning 3 levels with 5 beds, 4 full baths and 2 half baths. Epicurean kitchen with gorgeous marble countertops & island seating. A delightful casual dining area with integrated seating complements the kitchen, while the formal dining room exudes elegance with its refined paneling & convenient butler's pantry. The classic living room, complete with cozy fireplace, has adjacent charming sunroom, offering a tranquil retreat. The luxurious master suite has spa-like bath, expansive walk-in closet, & generously sized balcony. Lo
Stunning 5 Bedroom 3.5 Bathroom Home in Award Winning Las Lomitas School District. Formal Entry. Elegant Living Room with Fireplace. Formal Dining Room. Chef's Eat-in Kitchen with Center Island with Sink, Sub-Zero and Viking Appliances, Butler's Pantry, and Breakfast Nook. Opens to Spacious Family Room with Fireplace. Main Level Bedroom Suite, Laundry Room, and Half Bathroom. Primary Suite Retreat Features Fireplace, Double Sinks, Tub, Stall Shower, and Spacious Walk-in Closet. 5 Bedrooms. 3.5 Bathrooms. Interior Features Include High Ceilings and Central Air Conditioning and Heating. Owned Solar Panels. Lovely Landscaped Yard with Decks Perfect for Entertaining and Apricot, Nectarine, Oran
Fabulous 5 Bedroom 3 Bathroom Home in Menlo Park. Formal Entry. Elegant Living Room with Fireplace and Vaulted Ceilings. Formal Dining Room. Chef's Eat-in Kitchen with Breakfast Bar and Stainless Steel Appliances. Opens to Spacious Family Room with Vaulted Ceilings and Fireplace. Main Level Bedroom and Bathroom. Primary Suite Retreat Features Walk-in Closet, Double Sinks, Oversized Tub, and Stall Shower. 5 Bedrooms. 3 Bathrooms. High Ceilings. Lovely Landscaped Yard with Decks Perfect for Entertaining. Award Winning Las Lomitas School District
Wonderful two story, end unit Townhome "Behind the Gates". Private location with gated entry, surrounded by the newly designed Sharon Heights Golf Course. One of the largest units in the complex with 3bd, 2.5ba and 2,460sf of living space. Separate dining area with wet bar. Hardwood flooring and Plantation shutters on lower level. Lovely living area with gas fireplace. Separate family room off kitchen. Gourmet eat-in kitchen with Granite countertops and stainless steel appliances. Large primary suite with vaulted ceiling, plantation shutters and dual wardrobe closet areas. Private primary balcony overlooking blooming maples. Sharon Heights golf course views from guest bedrooms. Ga
Pictures don't do this home justice - at least that is what I am told! Menlo Park schools! Spacious home walkable to hot new restaurants, downtown, excellent schools and CalTrain! Quality of life at its finest. Discover the perfect blend of comfort and convenience in this spacious end unit townhome nestled in the heart of Menlo Park's vibrant Springline District. Three units total, the building lives like attached single family homes including beautifully landscaped gardens. Welcome to your new sanctuary featuring 2 bedrooms and 1.5 bathrooms, including two oversized bedrooms that offer ample space for home offices in each. Upstairs laundry, custom recessed lighting, private patio and a ren
Gracefully situated on a prime corner lot is a light-infused two-story home within the coveted Classics development. Quality abounds in this 4 bedroom, 2.5 bath single family home. The professionally manicured grounds are a tranquil oasis, boasting a completely fenced back yard, a large flagstone rear yard that's perfect for entertaining. The appealing mature trees and landscaping invites seamless indoor-outdoor living with its expansive feel & private walled hedges. Only blocks from Menlo Park's downtown, Stanford University, and Caltrain & across from Burgess Parks' pools, gyms, tennis, community center, etc. Inside this designer residence you will find a light and bright liv
One of the best locations in Menlo Park on the north side of Santa Cruz Ave with no through traffic and just over one-half mile to downtown. Whole-home renovation in 2016 plus newly refreshed with refinished hardwood floors and a palette of white for chic sophistication. Natural light is a signature of the home both morning and afternoon with many skylights, most of which open and are equipped with automated sensor controls. Family room with bath, or optional fifth bedroom, is customized for temperature-controlled wine storage. 4 spacious bedrooms include the primary suite. Delightful outdoor venues with large spa, barbecue kitchen, and TRX fitness area. Attached 2-car garage wired for EV.
Stunning Newly Renovated 3 Bedroom 2.5 Bathroom Home with Separate Office in Award Winning Las Lomitas School District. Formal Entry. Elegant Living Room. Chef's Eat-in Kitchen with Thermador Appliances, Brazilian Granite Center Island, Inset Cabinetry, and Skylight. Separate Dining Area. Primary Suite Retreat Features Double Sinks, Floating Vanity, and Italian Limestone Shower Walls. 3 Bedrooms. 2.5 Bathrooms. Separate Office. Expansive Mud Room with New LG Washer and Dryer. Interior Features Include White Oak Hardwood Floors, Central Air Conditioning, High-end Finishes Throughout. Lovely Landscaped 10,012+/- Lot. Large Backyard Covered Patio Perfect for Entertaining. Parking Area in Front
Welcome to this charming Craftsman style Farmhouse with a welcoming front porch, nestled within the inviting North Fair Oaks enclave of Menlo Park. Originally constructed in 1927, this home has gracefully weathered the years, retaining its allure and character. The main level has 3 bedrooms, two of which feature adjoining full baths while the primary bedroom, complete with full bath and walk-in closet, resides on the second floor. The updated kitchen has granite counters, a gas range, built-in microwave, dishwasher, disposal, and refrigerator. Wood floors throughout lend to the charm and character of this home. Outside, a spacious backyard awaits your personal vision for this oversized lot.
This 4bd/3ba home has high end finished interiors, gourmet chef's kitchen featuring Viking gas stove, hardwood floors throughout and no shortage of storage. The exterior patio has a BBQ island and a cooktop - perfect for summer indoor/outdoor living. Walking distance to renowned Las Lomitas school district schools, parks and restaurants. Bonus:its right across from the brand-new MP fire station, offering extra safety and peace of mindtalk about a win for your fire insurance!
Experience the luxury and peace of mind of new construction near downtown Menlo Park, offering premium finishes and 10-year new home warranty. The chef's kitchen is adorned with pristine quartz countertops, Thermador appliances, a 5-burner stove, custom cabinetry, and exquisite pendant lighting. This flows seamlessly into the expansive living area, complete with coffered ceilings, an electric fireplace, and sliding French doors that create a breathtaking wall of windows overlooking the backyard. The main level includes a generously sized bedroom and a full bathroom, ideal for accommodating guests. Upstairs, you'll find three more bedrooms and two full bathrooms, with the primary suite takin
Ultra-modern gated luxury enclave in Atherton! Rebuild from the studs with soundproofing materials by enveloping the home in ultra-thick studio-grade quiet sheetrock, Milgard soundproof windows w/ extra thick glass, & open cell foam insulation into walls, attic, crawl space, & underfloor areas, with an additional smooth finish acrylic stucco layer not only for the modern look but also providing extra massing for enhanced quietness. Beyond the 8 ft tall metal gate & 8 ft high solid wood fence towards the street, the home boasts ample outdoor leisure spaces w/ complete privacy, including a half-basketball court & a lush backyard. The interior features 14 ft vaulted ceili
A brand new 2024 contemporary home in a prime location. Close to one of the world's top schools, Stanford University & excellent Menlo Park Schools: Laurel/Encinal Elementary, Hillview Middle, Menlo-Atherton High. Boasting a soaring high vaulted ceiling, numerous windows & a huge kitchen skylight the home is bathed with natural light. The home features energy-efficient recessed lighting, hardwood floors & a family room. An open-concept living room & kitchen features a shaker-style cabinetry & is equipped with premium stainless steel Thermador appliances including a cooktop, dishwasher, exhaust fan, microwave, oven & refrigerator. It also has a pantry, wat
An unparalleled living experience awaits in this architectural masterpiece nestled on over 1/3-acre in esteemed Sharon Heights, one of Silicon Valley's premier neighborhoods. Encompassing over 4400 sf of living space, this home presents a seamless fusion of grand Colonial aesthetics and contemporary elegance. Immerse yourself in the epitome of luxury living through a thoughtfully designed floorplan featuring expansive formal rooms, a chef's kitchen with top appliances, a family room, and the retreat-like primary suite with its own fireplace. Enjoy a harmonious connection to the outdoors on grounds that offer peaceful space for al fresco entertaining, as well as a spacious guest home. And th
Best value in the prestigious Sharon Heights neighborhood of Menlo Park! Bright & spacious corner unit 3 bedroom townhome with attached two car garage and large bonus space. Ideally located in the coveted Sharon Glen community, this home features high ceilings, natural light, separate indoor laundry room, remodeled kitchen w/ stunning quartz counters & sunny eating area, central AC & heating, recess lighting, stylish ceiling mount fixtures, custom window shades, closet organizers, & vinyl wood-like flooring throughout home. Walls of glass lead to private back deck with steps leading to the solar heated community pool and expansive lawn area. Approx. 1,480 sf of living
Introducing a remarkable real estate opportunity in East Palo Alto, where comfort, convenience, and investment potential converge seamlessly. This spacious property features a generous lot, offering ample outdoor space for relaxation and gatherings. Investors will find immense value in the property's potential for rental income, thanks to its size and prime location near Silicon Valley businesses, including tech giants like Facebook and Amazon, as well as the renowned Stanford shopping mall. Situated just moments away from downtown Palo Alto, residents can easily explore the vibrant dining, shopping, and cultural scene. The home's location in a East Palo Alto neighborhood adds an extra laye
Known in the Development as "The best Unit"; this spacious One-Level unit is steps to Downtown Menlo Park. Large, private patio for entertaining or enjoying the morning sun!
This charming, spacious townhome is an inner circle end-unit, located in a quiet resort-like residential area next to the Sharon Heights Country Club with convenient access to Hwy 280, Sharon Park Shopping Plaza, Stanford Shopping Center, Stanford University, and top Stanford and Palo Alto medical facilities, regional parks and hiking trails within 10 minutes! The award-winning Las Lomitas School and Menlo-Atherton High. The home features many recent upgrades including maple hardwood floors, roof, two-zone central HVAC, Milgard energy-efficient double-pane windows, and copper crawl space plumbing. A private fenced patio/deck faces a large beautifully landscaped area to the pool and spa. The
This area's enrollment policy is not based solely on geography. Please check the school district website for more information.
Elementary schools
Middle schools
High schools
GreatSchools Summary Rating
9/10
Ohlone Elementary School
Public, K-5
8/10
Escondido Elementary School
Public, K-5
8/10
Oak Knoll Elementary School
Public, K-5
8/10
La Entrada Middle School
Public, 4-8
8/10
Laurel Elementary School
Public, K-5
Only showing 5 of
23 elementary schools.
School data is provided by GreatSchools, a nonprofit organization. Redfin recommends buyers and renters use GreatSchools information and ratings as a first step, and conduct their own investigation to determine their desired schools or school districts, including by contacting and visiting the schools themselves.Redfin does not endorse or guarantee this information. School service boundaries are intended to be used as a reference only; they may change and are not guaranteed to be accurate. To verify school enrollment eligibility, contact the school district directly.
Homes for sale in Menlo Park have a median listing price of $2.82M. Some of these homes are Hot Homes, meaning they're likely to sell quickly.
What are some of the most popular neighborhoods in Menlo Park?
Popular neighborhoods include Old Palo Alto, West Atherton, Midtown Palo Alto, Belle Haven, Lindenwood, Crescent Park, Sharon Height, The Willows, College Terrace, and Allied Arts.
Menlo Park, California offers a variety of transportation options for its residents. The city is well-served by public transportation, including Caltrain and SamTrans, providing easy access to the surrounding areas. For those who prefer to drive, Menlo Park experiences moderate traffic levels, making commuting by car a feasible option. Additionally, the city is conveniently located near major highways such as US Route 101 and Interstate 280, facilitating quick and easy travel to nearby cities. Learn more on our Menlo Park city guide.
What types of properties are available in Menlo Park?
Menlo Park, California offers a variety of single-family home types, including ranch-style, contemporary, and modern homes, each with their own unique architectural features and designs; these homes can be found throughout the city, including in neighborhoods like Sharon Heights, Allied Arts, and Felton Gables. Most properties in Menlo Park feature 3-5 bedrooms and were built in various years, providing a range of options for potential buyers. To explore different property types for sale in Menlo Park, California, use the 'Home type' filter located above the active listings. Customize your search by selecting options like single-family homes, condos, townhomes, and more.
What is life like in Menlo Park?
Menlo Park, California offers a serene and picturesque environment with a diverse range of landscapes, including lush green parks, rolling hills, and vibrant gardens. The weather is generally mild and pleasant throughout the year, with warm summers and cool winters. The city provides ample job opportunities, particularly in the technology sector, with numerous renowned companies and startups based in the area. Residents can engage in a variety of recreational activities, such as exploring the network of hiking and biking trails, enjoying outdoor sports in well-maintained parks, and indulging in the local culinary scene. Menlo Park also hosts a vibrant arts and culture scene, with art galleries, theaters, and community events showcasing local talent.
What are the schools and amenities like in Menlo Park?
Menlo Park, California, offers a variety of public amenities for its residents. The city boasts a number of restaurants, catering to a wide range of culinary tastes. For outdoor enthusiasts, there are numerous parks available for leisure and recreation. Residents also have access to several grocery stores for their daily needs. Additionally, Menlo Park provides other amenities such as libraries, fitness centers, and public transportation options.
In the past month, 33 homes have been sold in Menlo Park. In addition to houses in Menlo Park, there were also 12 condos, 5 townhouses, and 6 multi-family units for sale in Menlo Park last month. Menlo Park is a moderately walkable city in San Mateo County with a Walk Score of 58. Menlo Park is home to approximately 32,548 people and 26,346 jobs. Find your dream home in Menlo Park using the tools above. Use filters to narrow your search by price, square feet, beds, and baths to find homes that fit your criteria. Our top-rated real estate agents in Menlo Park are local experts and are ready to answer your questions about properties, neighborhoods, schools, and the newest listings for sale in Menlo Park. Our Menlo Park real estate stats and trends will give you more information about home buying and selling trends in Menlo Park. If you're looking to sell your home in the Menlo Park area, our listing agents can help you get the best price. Redfin is redefining real estate and the home buying process in Menlo Park with industry-leading technology, full-service agents, and lower fees that provide a better value for Redfin buyers and sellers.


 REDFIN IS COMMITTED TO AND ABIDES BY THE FAIR HOUSING ACT AND EQUAL OPPORTUNITY ACT. READ REDFIN'S FAIR HOUSING POLICY AND THE NEW YORK STATE FAIR HOUSING NOTICE.
 United States
 Canada