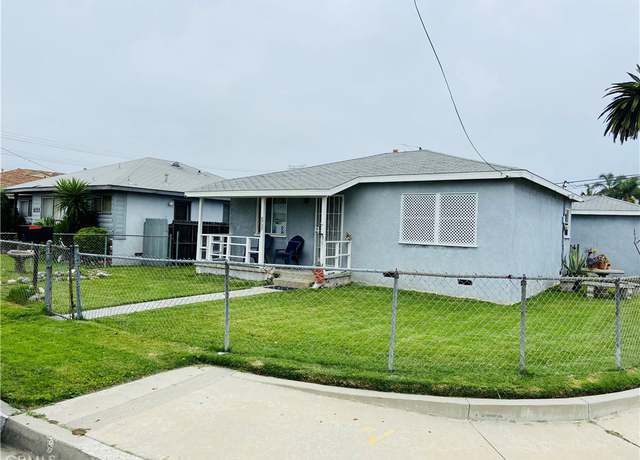
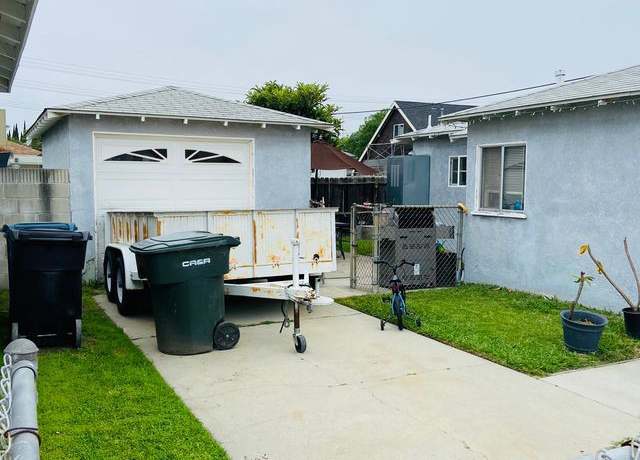
* * Investment Opportunity in Paramount, CA! * * Welcome to this fantastic property offering not one, but two separate homes on a spacious corner lot in the heart of Paramount, CA. Nestled on a charming tree-lined residential street, this unique opportunity provides the perfect blend of comfort, convenience, and potential for investors or end users. The main highlights of this property include:- * * Two Separate Homes: * * Enjoy the freedom and flexibility of two distinct living spaces, offering the potential for rental income, multi-generational living, or the opportunity to live in one unit and rent out the other. - * * Spacious Interiors: * * Both homes boast generous interior
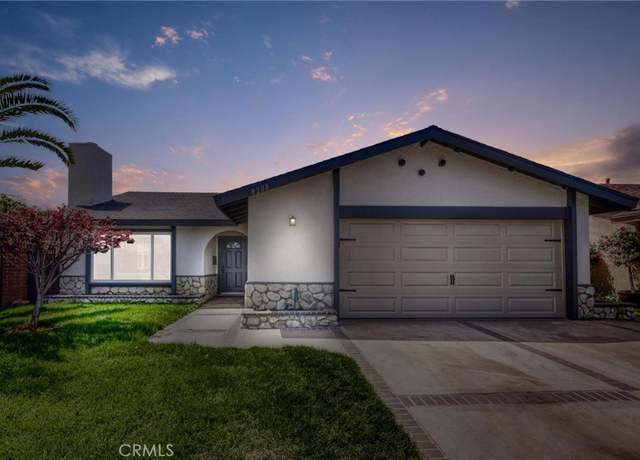
COMPLETELY REMODELED 4 BEDROOM 2 BATH ON A CUL DE SAC. THE HOUSE FEATURES NEW WATERPROOF FLOORING, RECESS LIGHTING. NEW KITCHEN CABINETS, NEW QUARTZ, STAINLESS STEEL APPLIANCES. BOTH BATHROOMS HAVE BEEN FULLY REMODELED WITH NEW TILES, NEW VANITY AND BATH TUB. 2 CAR ATTACHED GARAGE WITH EASY ACCESS FROM INSIDE THE HOUSE. GOOD SIZE FRONT AND BACKYARD. NEW CENTRAL AC/HEAT. BRAND NEW LIFETIME ROOF. OFFERS DUE 6 PM ON MONDAY. VA BUYERS are welcome also.
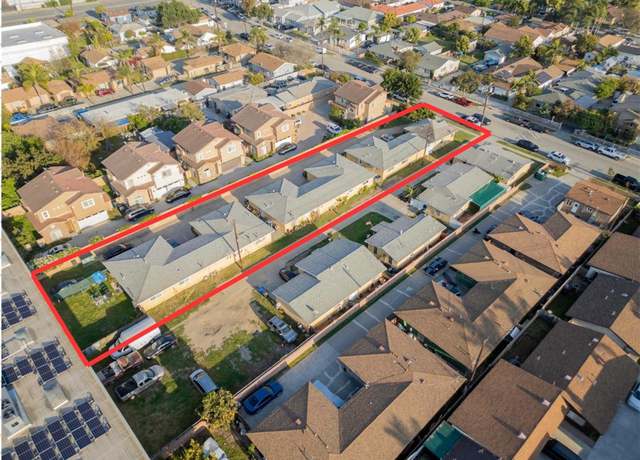
This incredible investment opportunity features 6 units- all 2 bedroom, 1 bathroom. Three duplex-style 2-unit structures. Each building includes a 2-car garage (shared between 2 units) and each unit has private indoor washer/dryer hookups. HUGE 17,859 sqft lot perfect for future development. Long-term tenants in all units; rents are under market. Two units have been remodeled. Lots of parking, and front and back units have yards. Tenants pay electricity and gas, with separate meters for each unit. Don't miss this gem!
DON'T MISS OUT ON THIS GREAT OPPORTUNITY!! HUGE POTENTIAL!! SELLER HAS APPROVED PLANS AND HAS PULLED PERMITS FOR A SECOND STORY CONSTRUCTION. HUGE LOT. .. DOUBLE ADU POTENTIAL! HOME WAS GUTTED AND COMPLETELY UPGRADED IN 2017. NEW COPPER PLUMBING, ELECTRICAL, RECESSED LIGHTS, DRYWALL, INSULATION AND MUCH MORE. NEW ROOF IN 2019. GARAGE WAS CONVERTED TO LIVING ROOM AND CAN EASILY BE PERMITTED AS AN ADU. CLOSE TO PUBLIC TRANSPORTATION AND GREAT SCHOOLS. VERY NICE COMMUNITY TO SETTLE DOWN IN.
WELCOME to desirable Paramount City! You can't get better if you want to live near Los Angeles. This beautiful and spacious townhouse has 2 beds and 2 baths, a secure parking, gated community, 2 parking spaces, private complex, community laundry, a well-kept house, is close to schools, shopping and freeways and much more! Bring your best offer . .. WON'T LAST!
Welcome to your updated single condo with 2 covered parking spaces, within a gated community in Paramount, California! This charming residence boasts a spacious layout spanning 671 square feet, featuring modernized floors, kitchen, and bathroom for a fresh and inviting ambiance with a great pool view. The community's gated entrance ensures security and privacy, offering peace of mind for residents. Conveniently located on the same street as Paramount High School, education and community amenities are just moments away. Embrace the convenience of this prime location while enjoying the comforts of your stylishly renovated condo. Don't miss your chance to experience the best of Paramount livi
Experience the comfort of this home with all the amenities of a 55+ gated community: from a welcoming club house for social gatherings to a pool, relaxing spa, beutiful landscaping, and well-maintained access roads. And all of this comes at an incredibly affordable monthly rate! Ideal for those seeking to downsize and savor life's moments, this 2-bedroom, 1-bathroom residence has been thoughtfully upgraded for your enjoyment. To truly grasp the warmth and coziness this home provides, a viewing is essential.
Welcome to your home located at 16825 Passage Ave Unit 312 in Paramount, CA. This charming 1 bedroom 1 bathroom private end unit condo offers an ideal blend of comfort and convenience. Step inside to discover a well-designed living space with natural light and an open-concept layout that seamlessly connects the living, dining, and kitchen areas with direct access to an intimate patio which is perfect for relaxing evenings. The kitchen provides a walk-in pantry with built in storage and a stackable washer and dry space. The bedroom provides an extra-large walk in closet. You can also enjoy a shared backyard space perfect for outdoor grilling and relaxation. Conveniently located to local shop
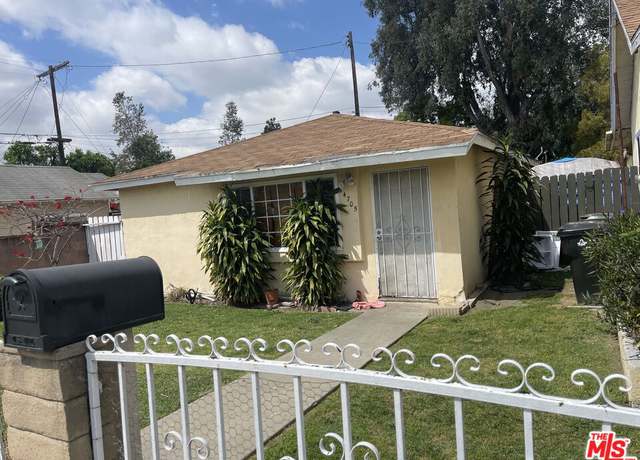
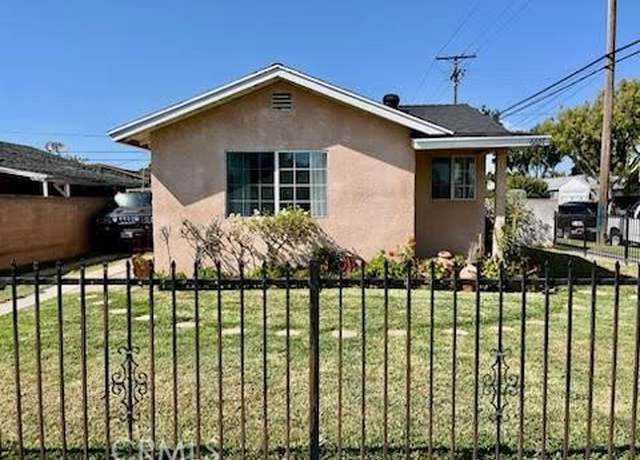
Welcome to 8235 Quimby Street in Paramount! This charming single-family home offers comfortable living with 2 bedrooms, 1 bathroom, and a cozy atmosphere spread across 627 square feet of living space. Situated on a lot spanning 2,313 square feet. As you step inside, you'll be greeted by a warm and inviting interior featuring a well-appointed kitchen, a bright living area, and two spacious bedrooms. The layout is thoughtfully designed to maximize functionality while maintaining a sense of coziness throughout. This property is currently tenant-occupied, ensuring immediate income potential for investors. However, rest assured that the tenants will vacate the premises by the time of close of es
Welcome home all first time homebuyers! This condo is a perfect starter home for any growing family. Located near shopping and close to all freeway access including 105, 710 and 605 freeways. This condo has two patio areas in both the front and rear of the unit…Not to mention central air and heat along with inside laundry. What this condo needs is some TLC/flooring and paint! So with a full price offer the seller will provide a flooring and paint credit. This home is the best priced condo in north Paramount…
Upstairs condo ready to be called home! You'll enjoy this cozy one bedroom, one bath condo. Spacious living room and indoor laundry. Located on the second level, the community offers a large pool, gated parking and lot's of guest parking.
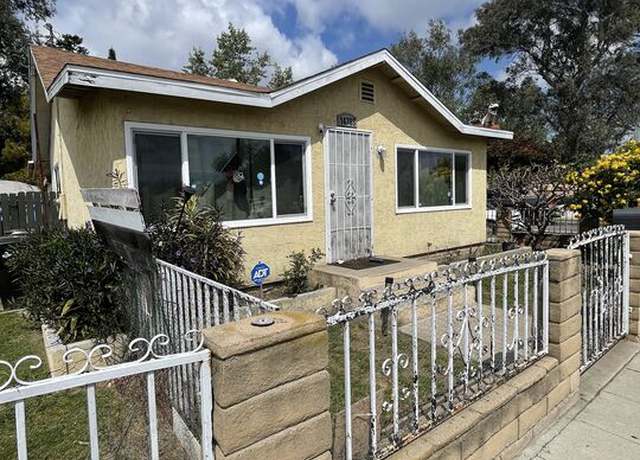
Welcome to this fabulous investment opportunity, offering the perfect blend of comfort, space and potential income! This unique and spacious lot features TWO detached houses, TWO detached garages, and a HUGE detached barn structure. This unique property presents a versatile opportunity for both homeowners and investors alike. The front house boasts functionality with two bedrooms and one bathroom, a generously sized kitchen, living room, service porch with laundry hookups and detached one car garage with long driveway for ample parking. The back unit is currently being utilized as a one bedroom, one bathroom home, but shows up on the tax records as having two bedrooms. The back unit could e
Beautiful Mobile Home in Paramount. Features 4 Bedrooms & 3 Baths, Approx. 1,600 Sq. Ft. Lots of Upgrades. Close to Gas Stations, Restaurants, School, Shopping Center, 105 Freeway. 55 + Paramount Mobile Village. 2 Parking Spaces. Pool and Event Room and Guest Parking Spaces. Land Rent is $ 1,000 per month.
Beautiful- proud of ownership, move in ready condominium; in the desirable area of Downey Lakes Gated Community!! This condominium has it all!! A specious, bright open floor plan with recess lights. Central heat and air, a fireplace for those cozy winter days, convenient inside laundry room with plenty of storage and shelves. A cozy balcony in the master bedroom. An attached two car garage. For those hot summer days, enjoy the bbq area and jacuzzi! 5 minutes to the 105 and 605 freeways. Close to Downey landing shopping center, restaurants, and movie theaters! * Complex is FHA approved!
$550,000
2 beds2.5 baths1,082 sq ft
8302 Somerset Ranch Rd Unit D, Paramount, CA 90723
HERE IS A RARE OPPORTUNITY TO OWN A DUPLEX IN PARAMOUNT CITY. THIS PROPERTY HAS GATED ENTRY. THE FIRST UNIT HAS TWO BEDROOMS ONE BATHROOM AND THE SECOND UNIT HAS ONE BEDROOM AND ONE BATHROOM. CENTRAL LOCATION NEAR TO SHOPPING CENTERS, MAJOR FREEWAYS, SCHOOLS AND PUBLIC TRANSPORTATION.
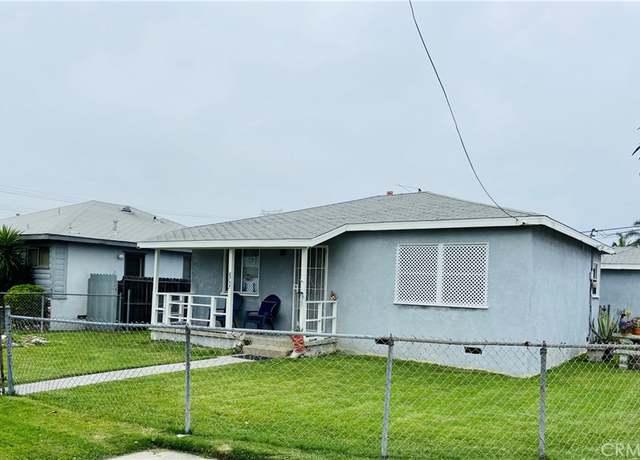
* * * * * * * * THE SELLER IS WILLING TO PROVIDE A CREDIT IN LIEU OF DELIVERING THE PROPERTY VACANT * * * * * * * * * * Located right at the entrance to downtown South Gate, east of the 710 Fwy, and centrally located to everything. This is a single-story home featuring 3 bedrooms & 2 bathrooms. There is a separate storage room/area and direct access to the laundry from inside the home as well. When you walk into the home there is a large living room, a dining area/room, one full bedroom with an ensuite 3/4 bathroom (shower, sink, and toilet), and a large kitchen with room for a kitchen table, storage and, more. The back portion of the home features its own entrance,
Beautiful 2022 built single family home located in the heart of Paramount with no HOA, no Mello Roos, and High Efficiency, Solar included (own solar, without any cost to buyer) This spacious and modern home boasts 4 bedrooms and 2.5 bathrooms, offering comfortable living for you and your family. With an attached 2-car garage, convenience is at your fingertips. Central heating, energy star qualified equipment, Central Air, electric, energy star qualified equipment, High Efficiency, SEER Rated 13-15 Step inside and discover luxury vinyl plank flooring that flows seamlessly throughout both levels, adding a touch of elegance to the ambiance. The heart of the home is the kitchen, where quart
Excellent location in Paramount in a desirable neighborhood. Tenant occupied. Do not disturb tenants. Property will be delivered vacant. 24 Hours notice for showing
We are pleased to present an estimated 28,505 SF commercial lot with 2,242 SF of improvements located in the City of Bellflower. The property is currently occupied by two month-to-month auto repair and auto sales tenants, with an existing spray paint booth in place. Located along the busy Lakewood Blvd and Alondra Blvd corridor with 288 feet of frontage, the property is well positioned for an owner-user seeking significant street presence, or for a developer seeking a substantial site for a new development. Zoned General Commercial (https:// ecode360.com/43108644), the property is permitted for car washes, auto, retail, medical, restaurant, offices, hotel/motel, service station, churches, a
Fantastic offering in a great area of Bellflower! This 2-on-1 located on an oversized corner lot of 6557 sq. ft. features 2 separate houses on 1 lot. .. perfect for multi-generational living or the savvy investor--live in one & rent out the other. The front home is 2 bed. 1 bath with approximately 750 sq. ft. of living space, charming front porch, cute kitchen & bath, hardwood floors throughout the living room & bedrooms with an amazing front yard, private backyard and detached 1 car garage. The back home is a 2 bed. 2 bath with approximately 860 sq. ft. of living space featuring hardwood floors, a huge kitchen upgraded with granite counters & custom cabinetry, remod
Welcome to this newly remodeled home in the city of Downey, offering 3 bedrooms and 2 baths. Situated near shopping centers, entertainment venues, and a host of amenities, this property provides both comfort and convenience. Step inside to discover a bright and airy interior, featuring modern finishes and thoughtful design touches throughout. The spacious living area is perfect for gatherings with family and friends, while the updated kitchen offers ample counter space and storage. Retreat to the serene master bedroom complete with an ensuite bathroom, providing a private oasis after a long day. Outside, the expansive backyard offers endless possibilities for outdoor enjoyment, from al fres
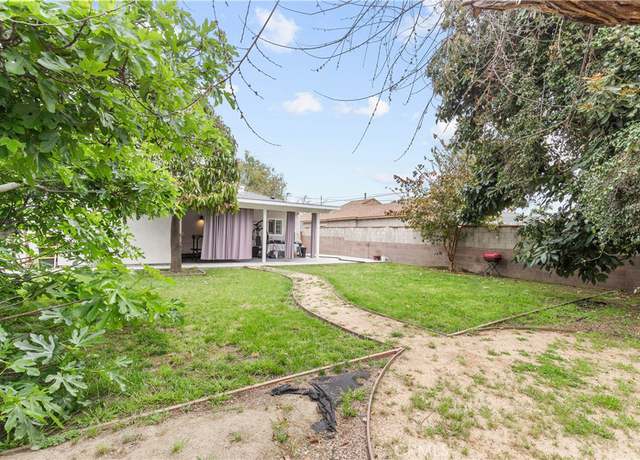
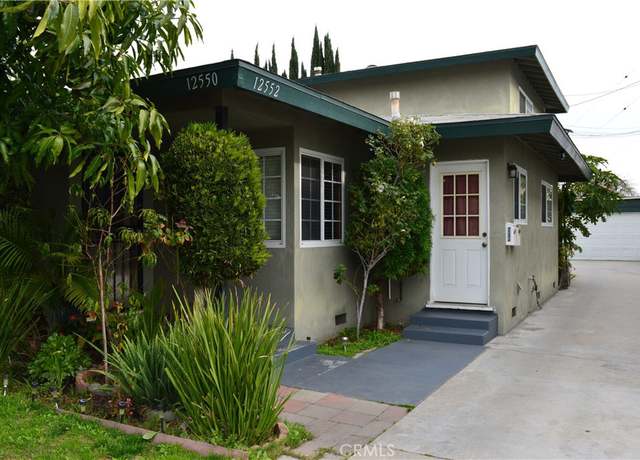
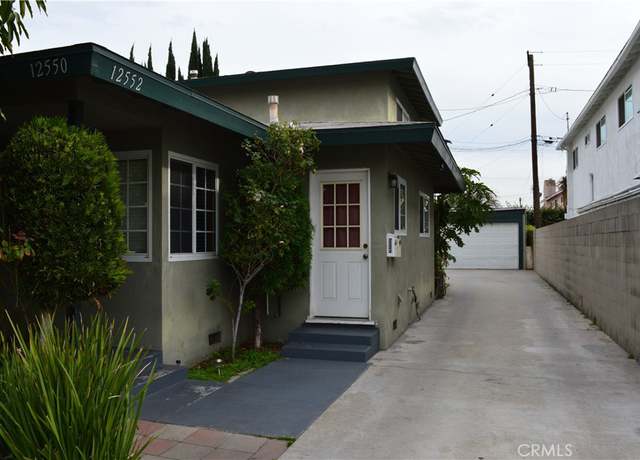
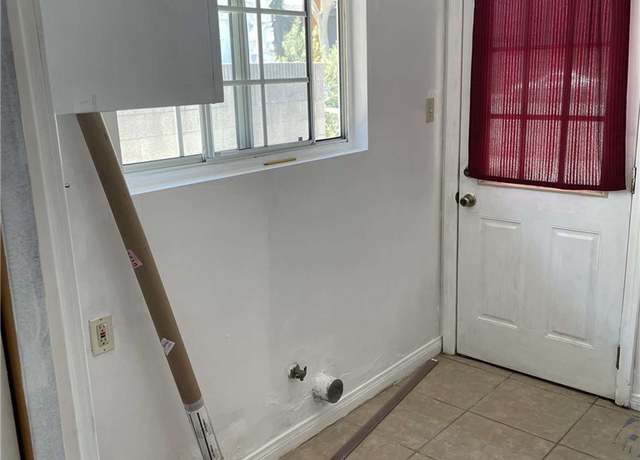
Just Listed for Sale! Amazing find! Great opportunity to own (2) on a lot, Legal (2) unit/duplex in the desirable city of Downey, CA 90242. Live in one and rent the other or rent both out. Steps away from Brookshire Children's Park and less than 1.5 Miles from "Downey Landing" which features local Cine-mark theater, fitness center, restaurants, bars, grills and a large array of stores. Great addition to any real estate portfolio or real estate schedule. 105 Fwy's are near by connecting you to 605 Fwys, 5 Fwys and 710 Fwys. Front Unit (12550) single story consists of: (2) Bedrooms (1) Bathroom, indoor laundry room, ample living room, dining room next to kitchen. Rear unit (12552) c
Welcome to your sanctuary of comfort and style where every detail has been curated to create an unparalleled living experience. As you enter, be greeted by the seamless flow of the spacious open-concept kitchen, living room, and dining room, perfect for effortless entertaining and daily relaxation. This remarkable home boasts just under 1900 sqft of spacious living, adorned with granite kitchen counters and laminate floors providing a blend of elegance and practicality. Indulge in culinary delights in the kitchen or gather around the dining table for intimate meals with loved ones. With 3 bedrooms and 2 baths, including a primary suite with a walk-in closet, this residence offers the ideal
Welcome to this stunning remodeled 2-bedroom, 1-bathroom home with a bonus office room that could easily serve as a 3rd bedroom, As you step inside, you'll be greeted by a bright interior with high ceilings that create an inviting atmosphere. The recently painted walls complement the new kitchen flooring, offering a fresh and contemporary feel throughout. The heart of the home is the spacious kitchen, featuring beautiful white cabinets, a dishwasher, and a charming farm-style sink. For added comfort, this home is equipped with central A/C and heating. The convenience of an indoor laundry room adds to the practicality of daily living. Outside, a detached guest house awaits, providing additio
Charming 2-bedroom , 1 bathroom home on a full size lot. Possible for expansion or ADU on this 4908 sq ft lot. Detached two car garage with plenty of parking space on the drive way. Ideal for those seeking a project with room for cosmetic improvements. Conveniently located near schools, parks, restaurants, Close to the 105 & 710 freeways.
5 recently upgraded bungalow style rental units on a 19,563 sf lot (Frontage:70', Depth:280') in Bellflower. The property is situated on the south side of Artesia Blvd and East of Downey Avenue. New concrete driveway with metal gate. New interior paint, bathrooms, kitchens, flooring, and windows. All units offer laundry hookup. 2 units with 3 bedrooms & 2 bathrooms, 2 units with 2 bedrooms & 1 bathroom, and 1 unit has 1 bedroom and 1 bath. All 5 units are month-to-month leases and all rents are current. 5 separate electric & gas meters. Tenants pay all electric and gas. Owner pays water & trash. A small billboard in the front of property facing Artesia Blvd collects
Introducing this FULLY renovated charming 2-bedroom, 1-bathroom home with tons of outdoor space and plenty of parking in the 2-car garage, driveway, backyard, behind the garage with easy ALLEY access through ROSECRANS AVE. The detached garage was reconstructed to its original 2-car garage with a new automatic garage door/motor and washer/dryer hookups (Once used as unpermitted conversion) inside. Still, accessible utilities were caped for future ADU owners. This home boasts a remodeled kitchen with granite countertops, new cabinets, and appliances. Also, the NEW 220 V home's electrical box, outlets (surge protector & tamper resistance), and new electrical wiring were upgraded to the a
First-time buyer's dream! Stylish tri-level detached townhouse in the Emerald Village gated community. 3 bedrooms 3 bathrooms, over 1,700 SF living space. One bed room and bath down stairs could also make a great client friendly office space. Laundry accommodates full size side-by-size washer and dryer. Spacious second floor finds high ceilings, good-size open kitchen with great lighting from large widows, sizable pantry, plenty cabinets, barstool counter plus area for a big breakfast table, partitioned dining area, huge living room with a view, fireplace and entertainment nook. Top floor, second bed room, full bathroom, and primary suite with a view, also has walk-in closet with shelving.
Welcome to your dream home in the heart of Bellflower! This fantastic property offers an exceptional blend of modern living and potential income generation, making it a rare find in this highly sought-after area. Situated on a generous corner lot, this spacious home boasts 3 bedrooms and 2 bathrooms, providing ample space for comfortable living. The 2 Accessory Dwelling Units (ADUs) presents an excellent opportunity for rental income. As you step inside, you'll be greeted by a well-designed floor plan that seamlessly connects the living, dining, and kitchen areas, creating an ideal space for both relaxing and entertaining. The kitchen features modern appliances, sleek countertops, and plent
A wonderful opportunity to own a well maintained 16 unit apartment in Bellflower. 8 units are 2 Bedroom, 1.5 Bath, appox. 875 Sqft. and 8 units are 1 Bedroom, 1 Bath, approx. 620 Sqft. 5 units have patio, 5 units have balcony/deck, and 3 units have backyard. Laundry Room has 5 washers and 4 dryers (2 stacked units) that are owned. 1 large storage/office area, approx. 500Sqft with bathroom. Gross income is approx. $27,750 per month. Gated Complex with Remote/Code Access Car Entry. 25 Parking Spaces. Newer iron fence, Newer concrete parking lot, Newer water heater. Palm Street Park is located across the street with playgrounds for kids and numerous picnic tables. Perfect for gatherings and en
Beautiful home, 5 bedrooms, 4 full bathrooms and two 1/2 bathrooms. Well-kept, in a quiet neighborhood of North Long Beach. Used as 2 units plus a one bedroom ADU. New kitchen with new appliances, granite countertops and Isle. Den, patio and separate laundry room. The master bedroom upstairs has a bathroom with a double head shower and elegant Moganite walls.
Welcome to a rare opportunity for savvy investors! This well maintained duplex in Lynwood offers not only a comfortable living space but also a steady stream of income. Located in a prime area, this property is a gem for those looking to make a smart real estate investment. This duplex offers one large house with 3 bedrooms 2 bathrooms, large family room, dining area, laundry room, large den or bonus room, and plenty of storage space. The second house offers 2 bedrooms, 1 bathroom, large kitchen and ample storage space. This property also features a separate two-car garage building. This property has new roofs on both houses and garage, new gas lines throughout, new windows on the front, an
Attention investors! This is an extraordinary opportunity to acquire a versatile Commercial/Residential Income Property in the highly desirable City of Bellflower. You won't want to miss out on this must-see investment property, featuring 6 recently renovated units. Each unit has undergone meticulous rehab, including brand new kitchen cabinets, updated laminate flooring, upgraded recessed lighting, modern dual pane windows, and stylish bathrooms. The property offers a variety of unit configurations, including (4) spacious 2-bedroom/1-bathroom units, (1) 3-bedroom/2-bathroom unit, and 1 charming 1-bedroom/1-bathroom unit at the front. 7 carport parking spots and 2 car garages, with one curre
Prime development opportunity at 8524 Park St. , Downey, CA! This expansive and level 8,625 SF lot, situated in the heart of Bellflower, is fully entitled and primed for construction. The meticulously designed plans encompass three two-level townhomes, each boasting generous dimensions of 1,456, 1,726, and 1,436 square feet respectively. Featuring a sought-after floor plan, each townhome comprises 3 bedrooms, 2.5 bathrooms, and a spacious 3-car tandem garage. Enjoy the convenience of a strategic location, just off the Downey Ave exit from the 91 Freeway, enhancing accessibility for future residents. Whether you choose to build your dream home or capitalize on the potential for a lucrative s
This FOURplex has four, 2 bedroom/1 bathroom units and is centrally located in Downey near the 105 freeway. The building recently had it exterior repainted and a tune up on its roof. If you are looking to add doors to your real estate investment portfolio, look no further. Each unit has their own electric and gas meters. They each have washer/dryer hook ups in their units. One unit is quite original, while the other three have had some updating. Great neighborhood for rentals as they don't come up very often. This building is located on a quiet cul-de-sac with similar buildings. This is a trust sale and able to be sold quickly if you are interested. The building has a private gated grass ar
Welcome to this fantastic investment opportunity in the heart of Bellflower. The Three-plex is well maintained, and located on a peaceful cul-de-sac. The property is within proximity to thriving Downtown Bellflower, freeways, shopping and restaurants. Each unit is a separate building on the property. You can live in one home, and rent out the other two buildings. The main home has 3 bedrooms, 2 bathrooms, 2 Car Garage ( * Located on 9024 Flower Street, Bellflower * ), while the other two buildings are each 2 bedrooms/1Bathroom, each have a 1 car garage. There is a long entrance drive way for additional parking, if needed. The 15,888 square foot lot has great opportunity for additional devel
This area's enrollment policy is not based solely on geography. Please check the school district website for more information.
Elementary schools
Middle schools
High schools
GreatSchools Summary Rating
7/10
Clinton, William Jefferson School
Public, K-8
7/10
Abraham Lincoln School
Public, K-5
6/10
Wesley Gaines School
Public, K-3
5/10
Howard Tanner School
Public, K-5
5/10
Los Cerritos School
Public, K-5
Only showing 5 of
14 elementary schools.
School data is provided by GreatSchools, a nonprofit organization. Redfin recommends buyers and renters use GreatSchools information and ratings as a first step, and conduct their own investigation to determine their desired schools or school districts, including by contacting and visiting the schools themselves.Redfin does not endorse or guarantee this information. School service boundaries are intended to be used as a reference only; they may change and are not guaranteed to be accurate. To verify school enrollment eligibility, contact the school district directly.
Paramount, California offers a variety of transportation options to its residents. The city experiences moderate traffic levels, making driving by car a feasible mode of transport. Paramount is also served by a public transportation system, providing an alternative to those who prefer not to drive. Furthermore, the city is conveniently located near several major highways and freeways, ensuring easy access to surrounding areas. Learn more on our Paramount city guide.
What types of properties are available in Paramount?
Paramount, California offers a variety of single-family home types, including ranch-style homes, bungalows, and contemporary residences. These homes can be found throughout the city, with ranch-style homes predominantly located in the northern neighborhoods, bungalows scattered throughout the central areas, and contemporary residences primarily situated in the southern parts of Paramount. Most properties feature two to four bedrooms and were built between the 1950s and 1990s. To explore different property types for sale in Paramount, California, use the 'Home type' filter located above the active listings. Customize your search by selecting options like single-family homes, condos, townhomes, and more.
What is life like in Paramount?
Living in Paramount, California offers a vibrant community with a range of amenities and services. The landscape of Paramount is characterized by a mix of urban and suburban areas, providing a diverse living environment. The weather in Paramount is typically mild, with warm summers and mild winters, allowing for year-round outdoor activities. The city provides various job opportunities across different industries, contributing to a thriving local economy. Residents can engage in a variety of recreational activities, including parks, sports facilities, and cultural events, ensuring an active and fulfilling lifestyle.
What are the schools and amenities like in Paramount?
Paramount, California offers a variety of public amenities for its residents. The city is home to numerous restaurants, providing a wide range of culinary options. For those who enjoy outdoor leisure, there are several parks available for relaxation and recreation. Grocery shopping is convenient with multiple stores throughout the city. Paramount also provides other amenities such as schools, libraries, and fitness centers to cater to the diverse needs of its residents.
In the past month, 7 homes have been sold in Paramount. In addition to houses in Paramount, there were also 9 condos, 2 townhouses, and 6 multi-family units for sale in Paramount last month. Paramount is a moderately walkable city in Los Angeles County with a Walk Score of 64. Paramount is home to approximately 53,634 people and 16,955 jobs. Find your dream home in Paramount using the tools above. Use filters to narrow your search by price, square feet, beds, and baths to find homes that fit your criteria. Our top-rated real estate agents in Paramount are local experts and are ready to answer your questions about properties, neighborhoods, schools, and the newest listings for sale in Paramount. Our Paramount real estate stats and trends will give you more information about home buying and selling trends in Paramount. If you're looking to sell your home in the Paramount area, our listing agents can help you get the best price. Redfin is redefining real estate and the home buying process in Paramount with industry-leading technology, full-service agents, and lower fees that provide a better value for Redfin buyers and sellers.


 REDFIN IS COMMITTED TO AND ABIDES BY THE FAIR HOUSING ACT AND EQUAL OPPORTUNITY ACT. READ REDFIN'S FAIR HOUSING POLICY AND THE NEW YORK STATE FAIR HOUSING NOTICE.
 United States
 Canada